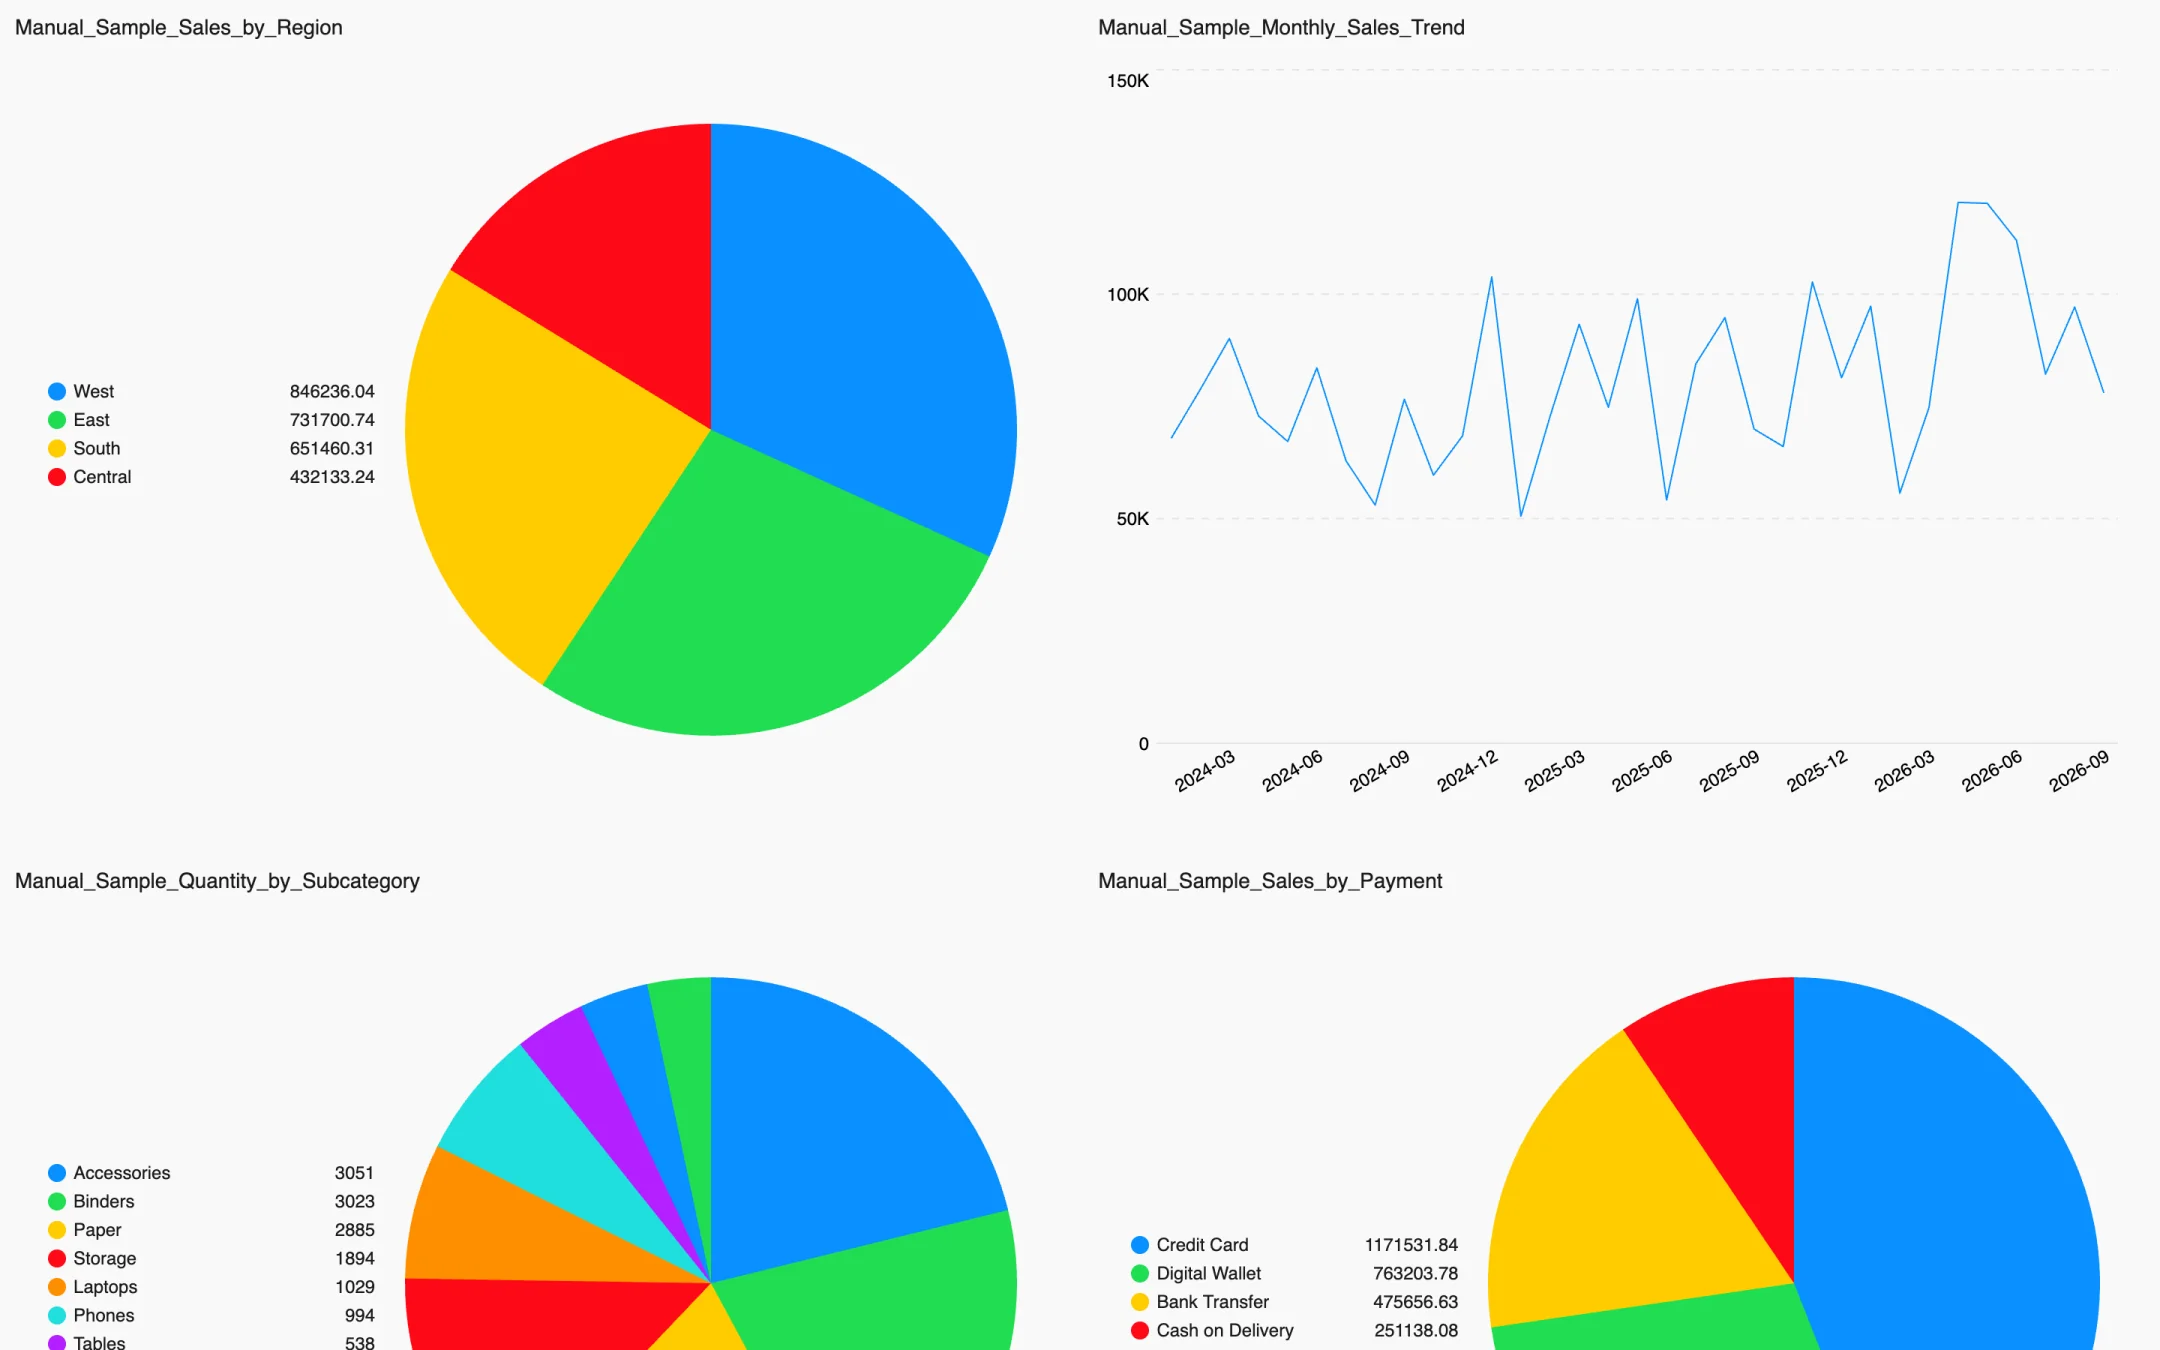
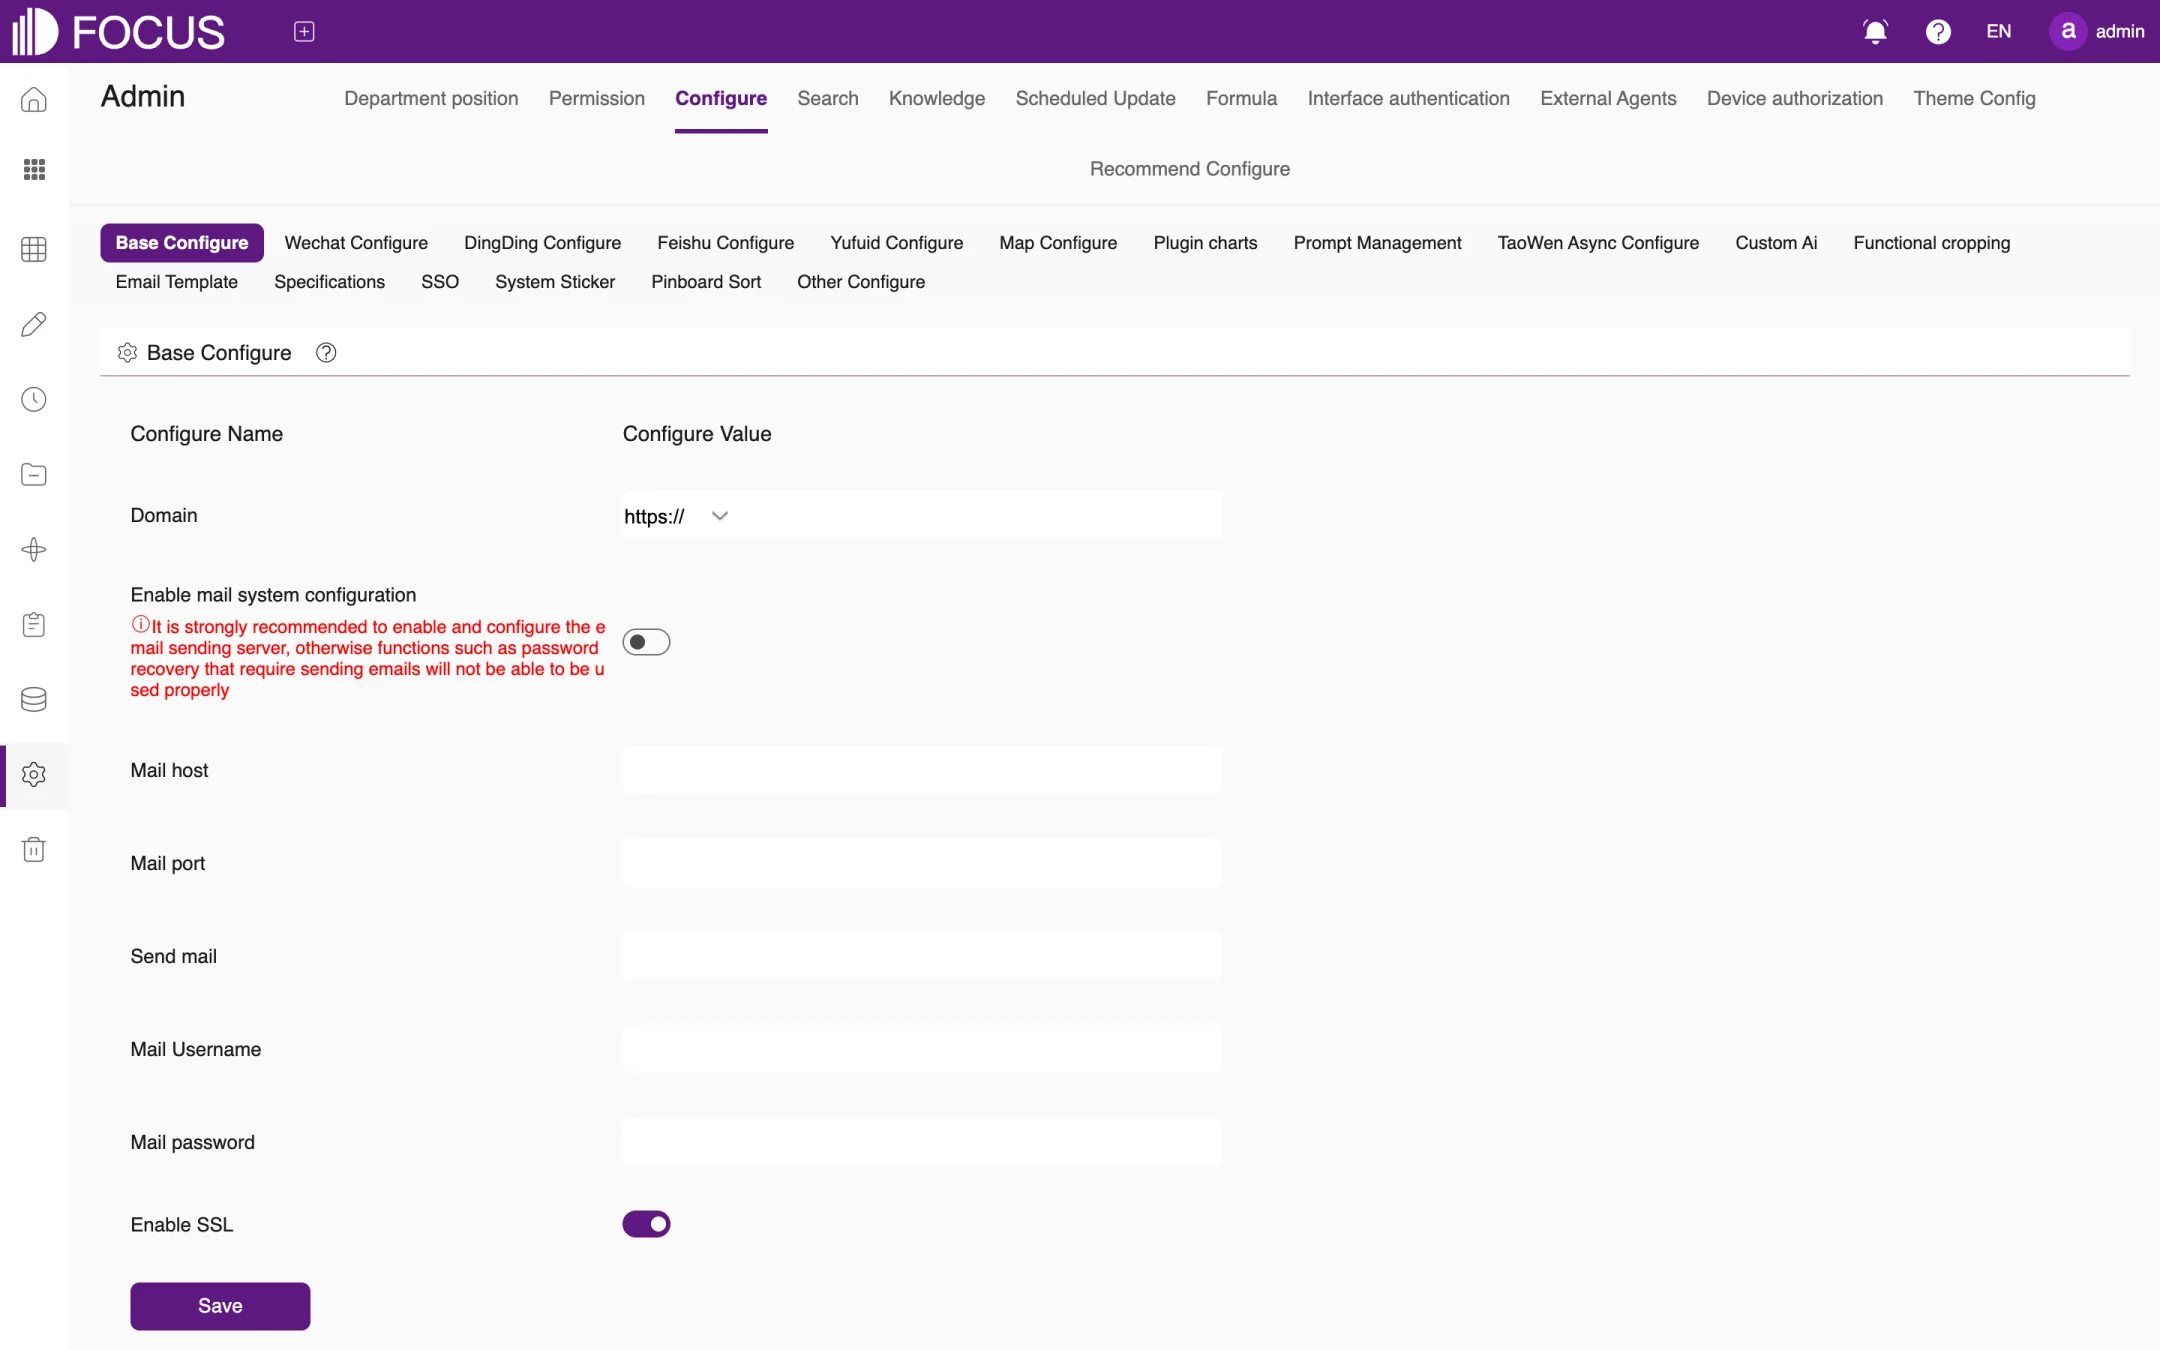
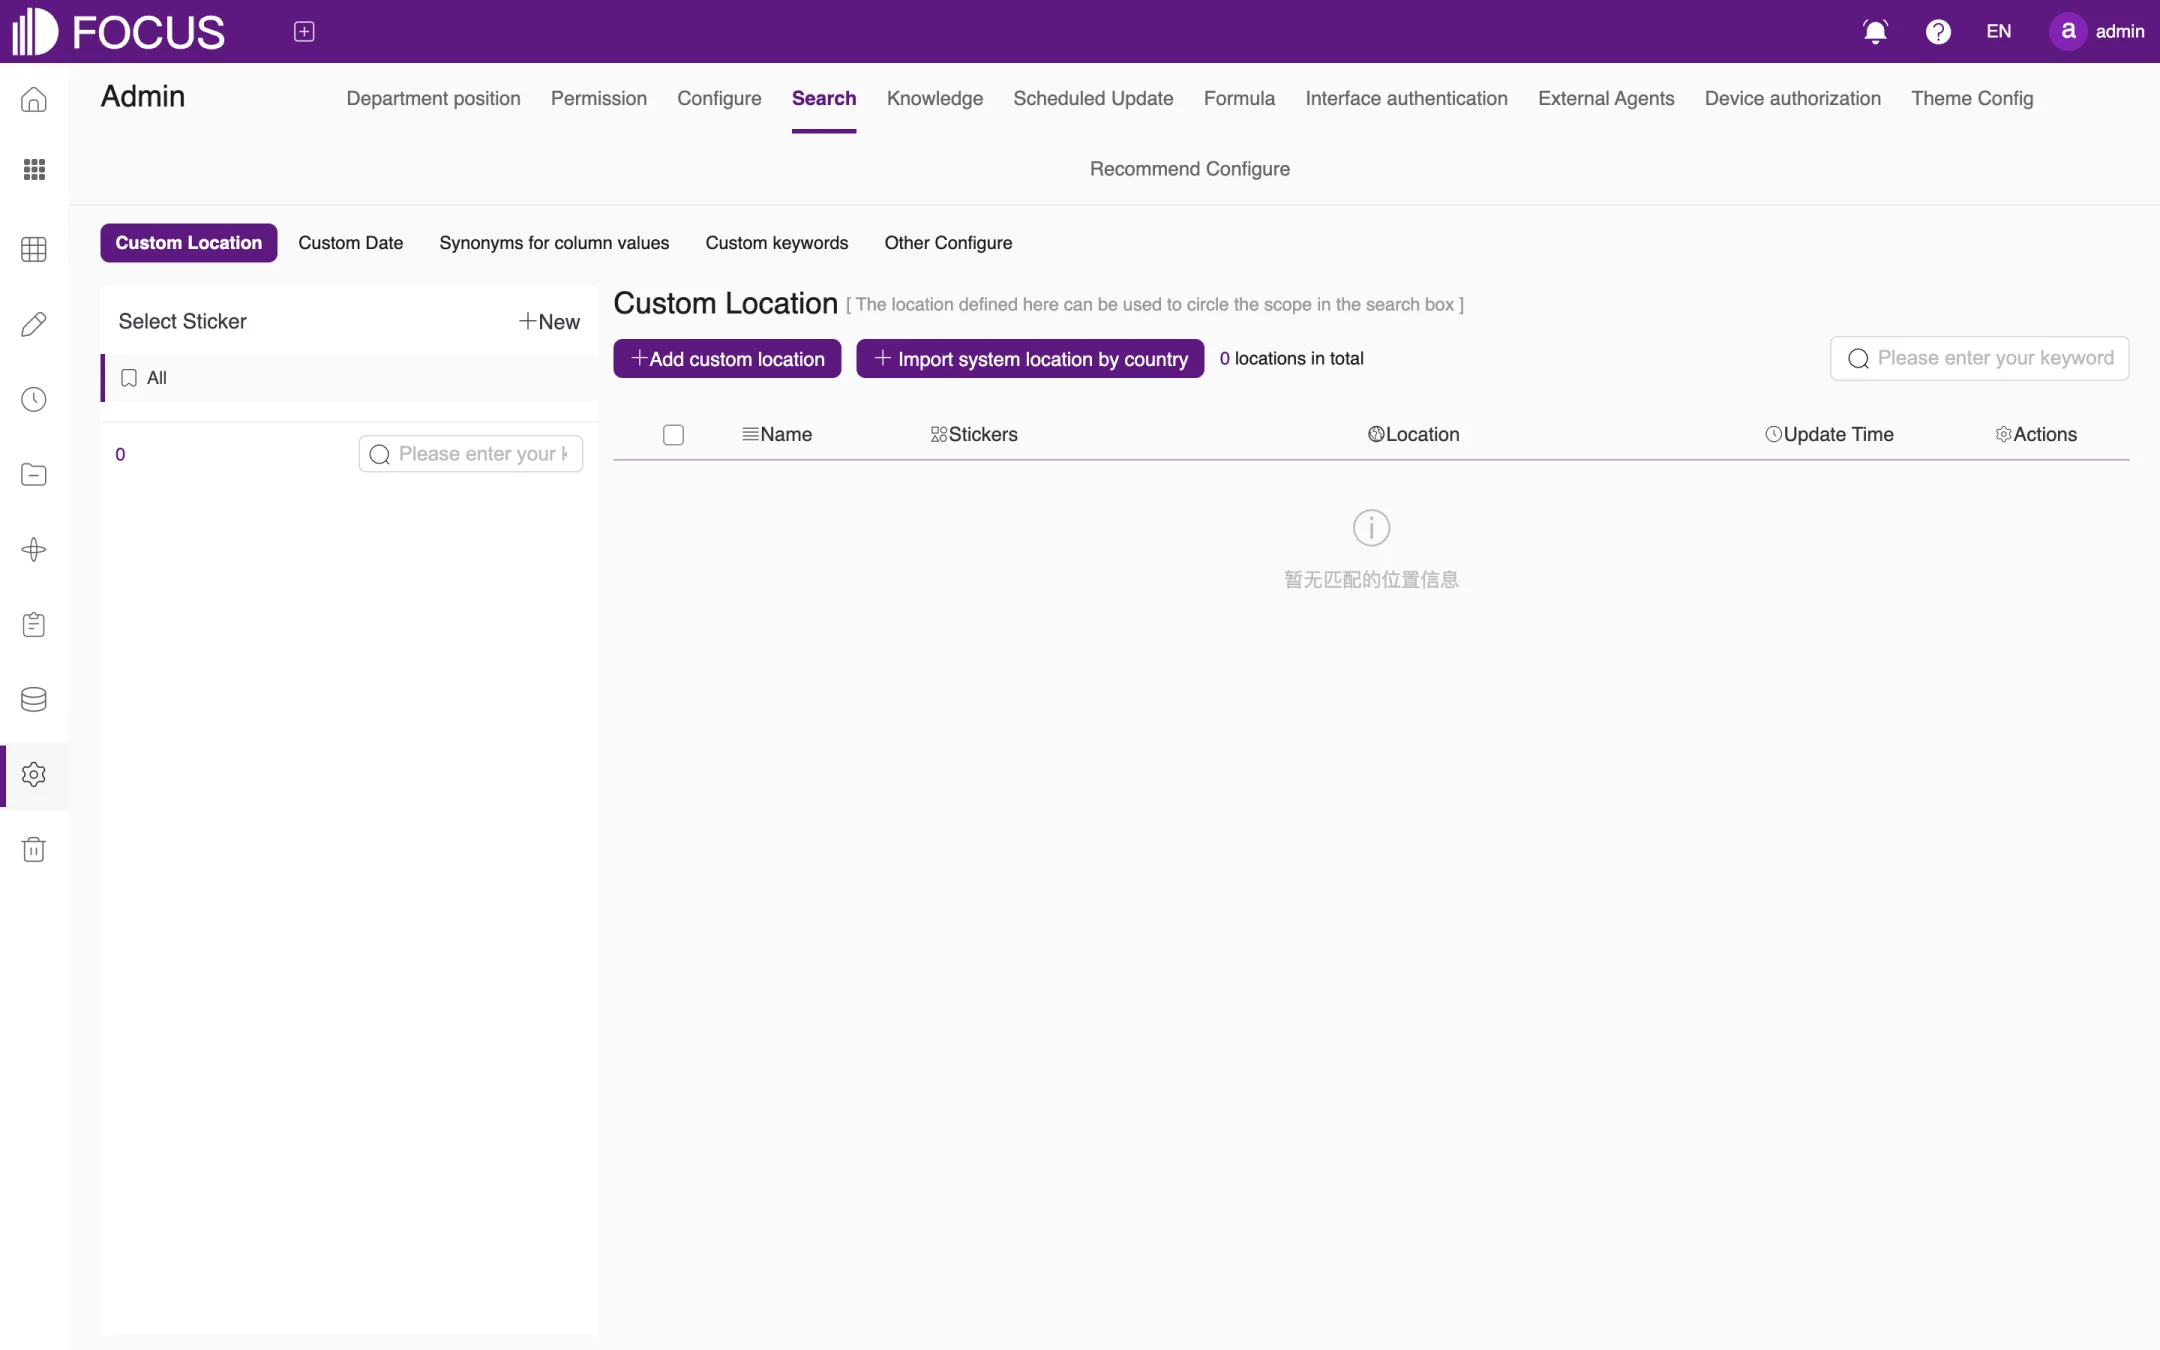
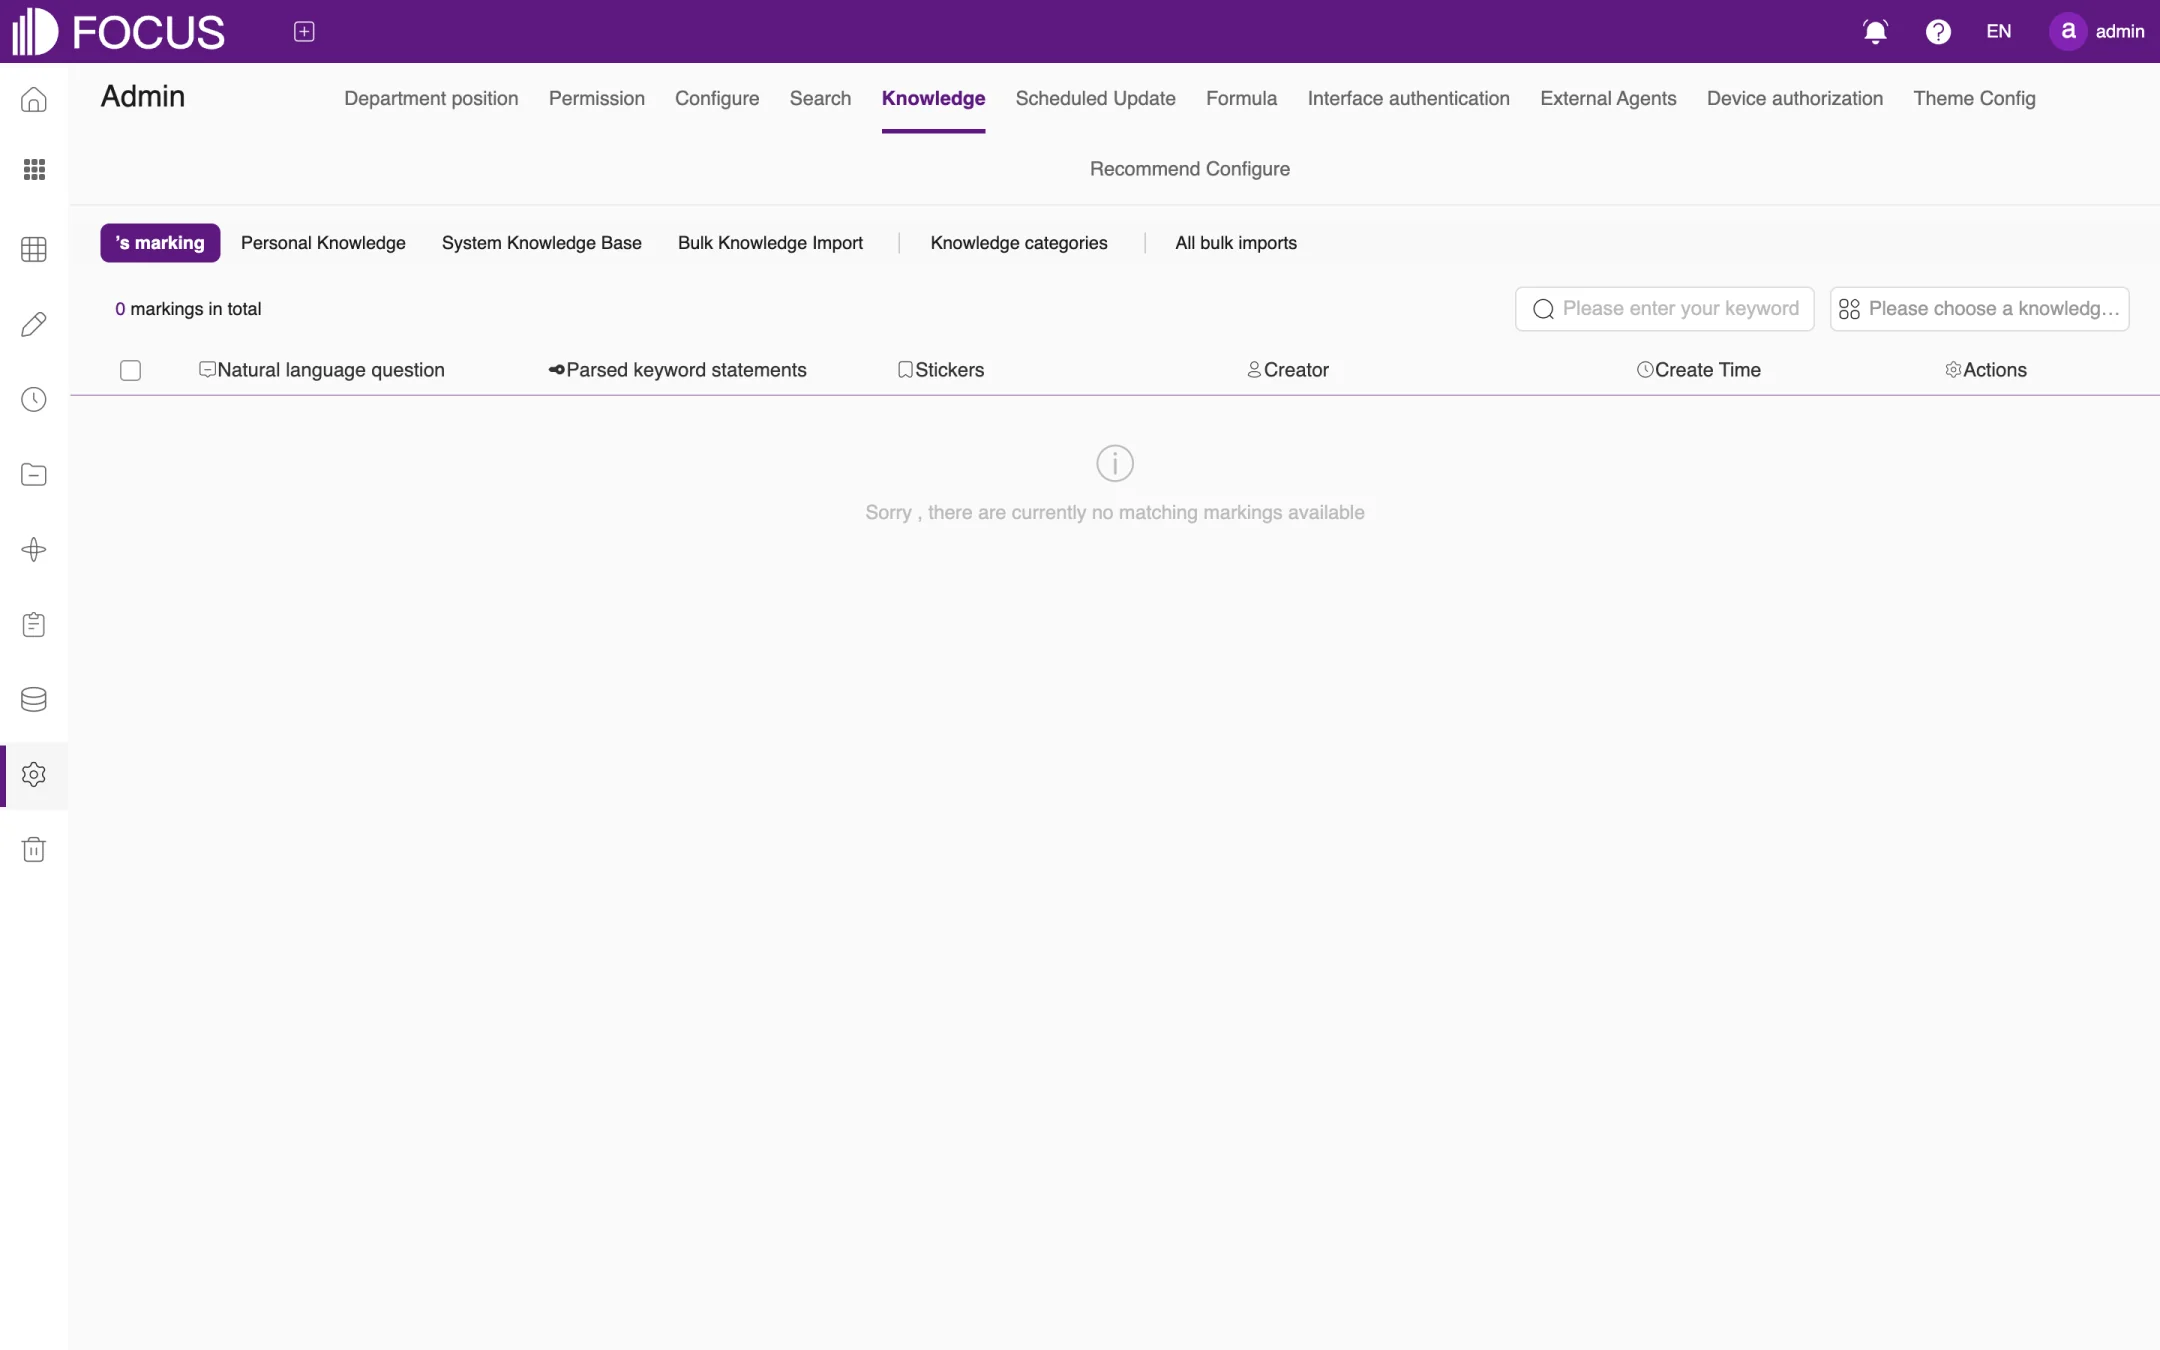
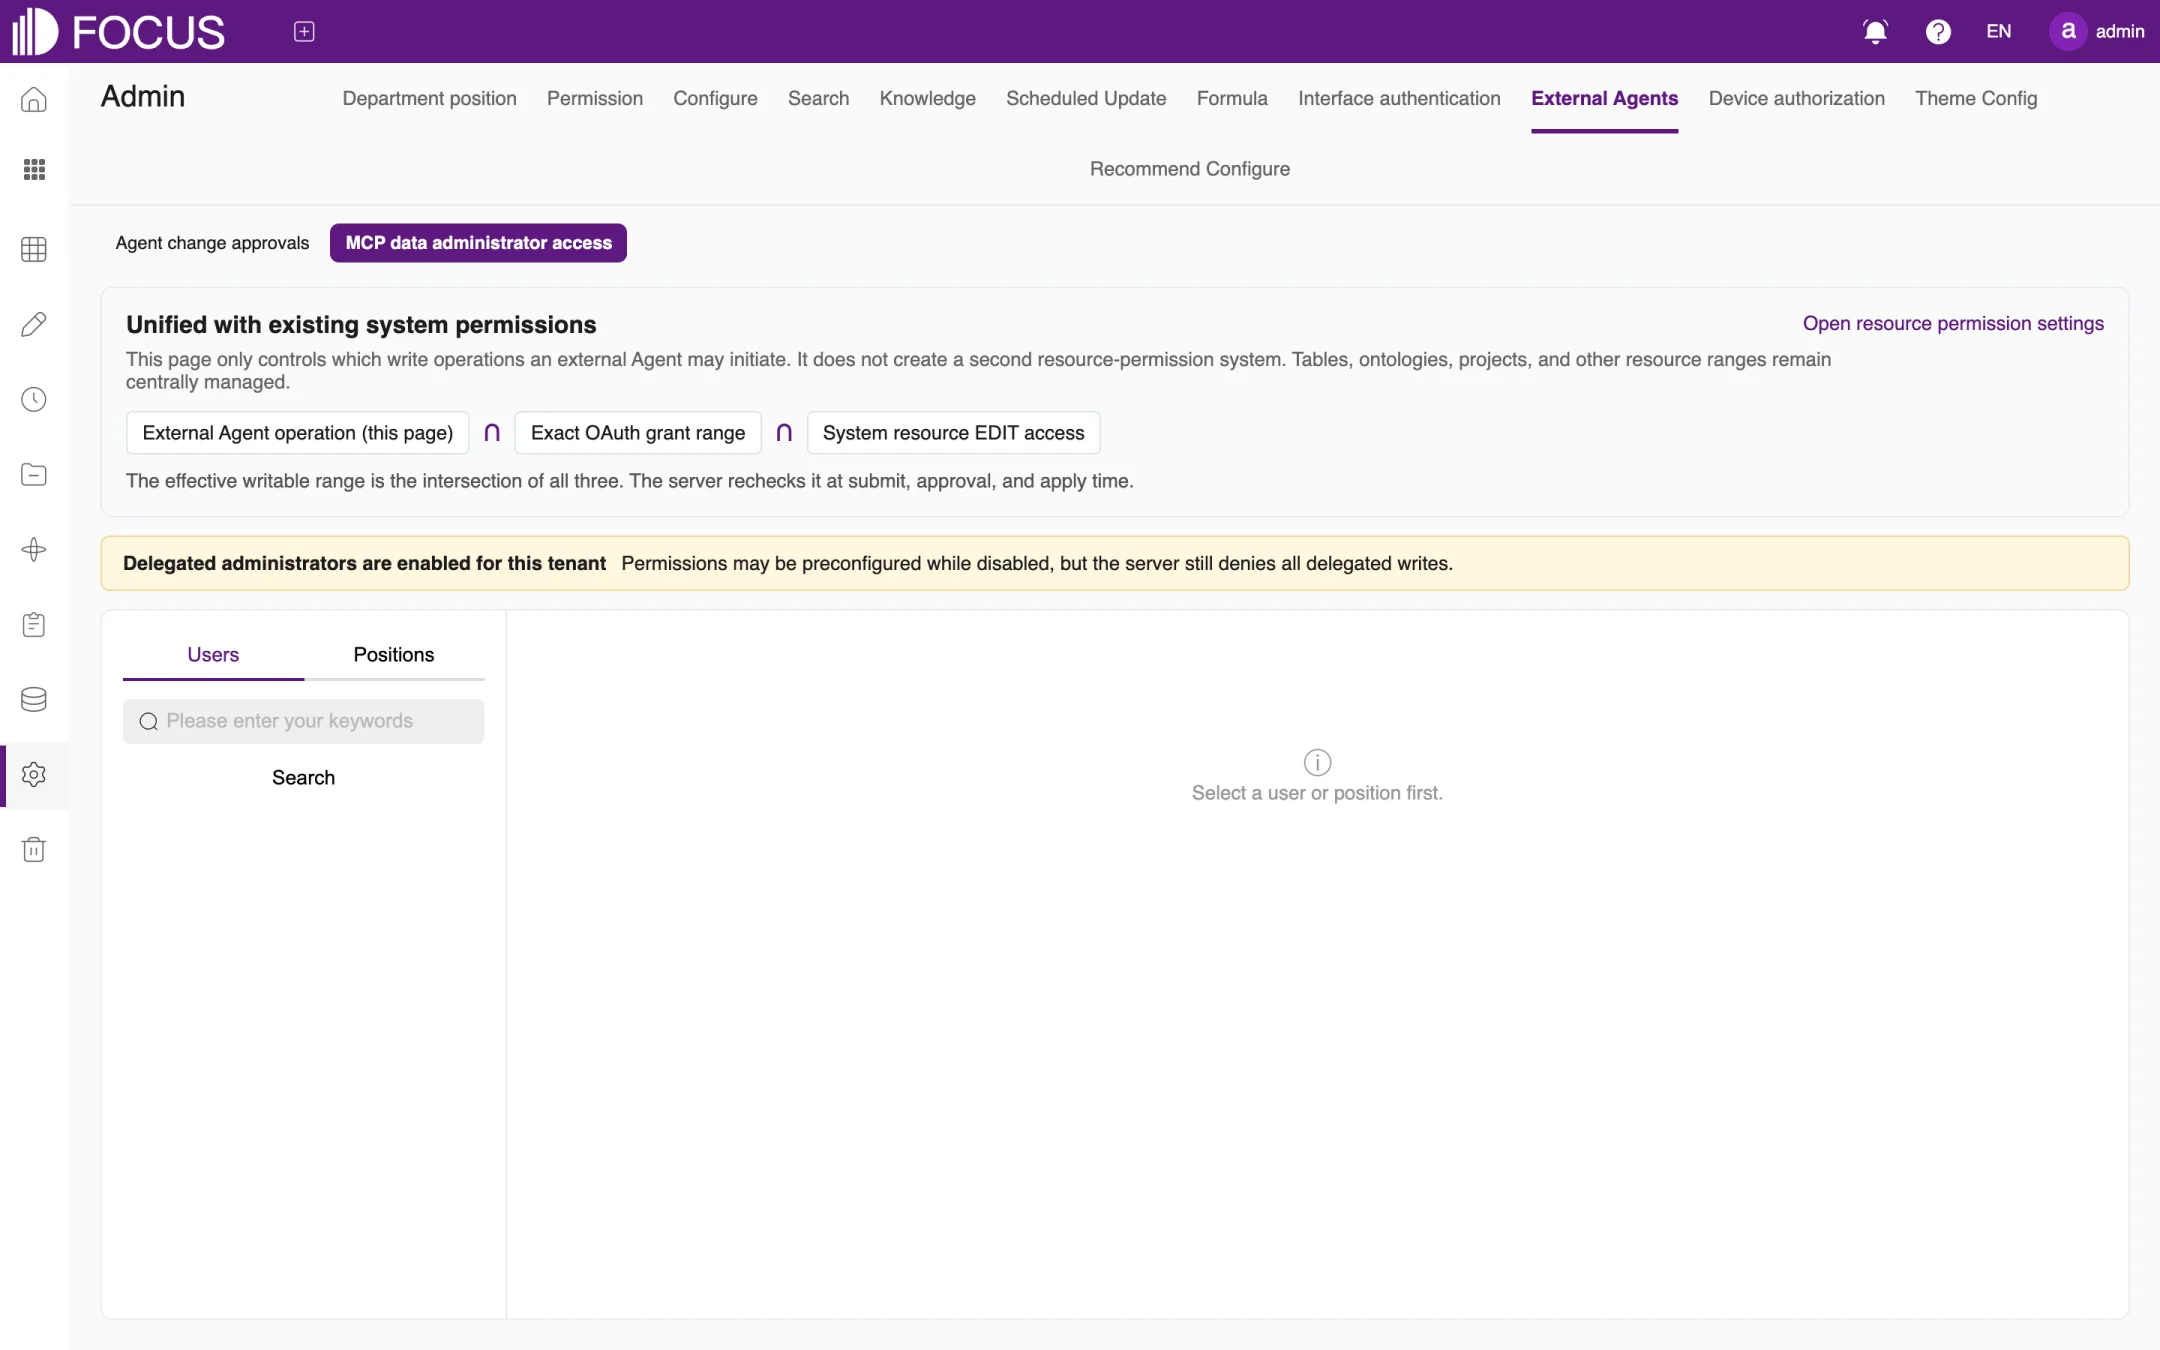
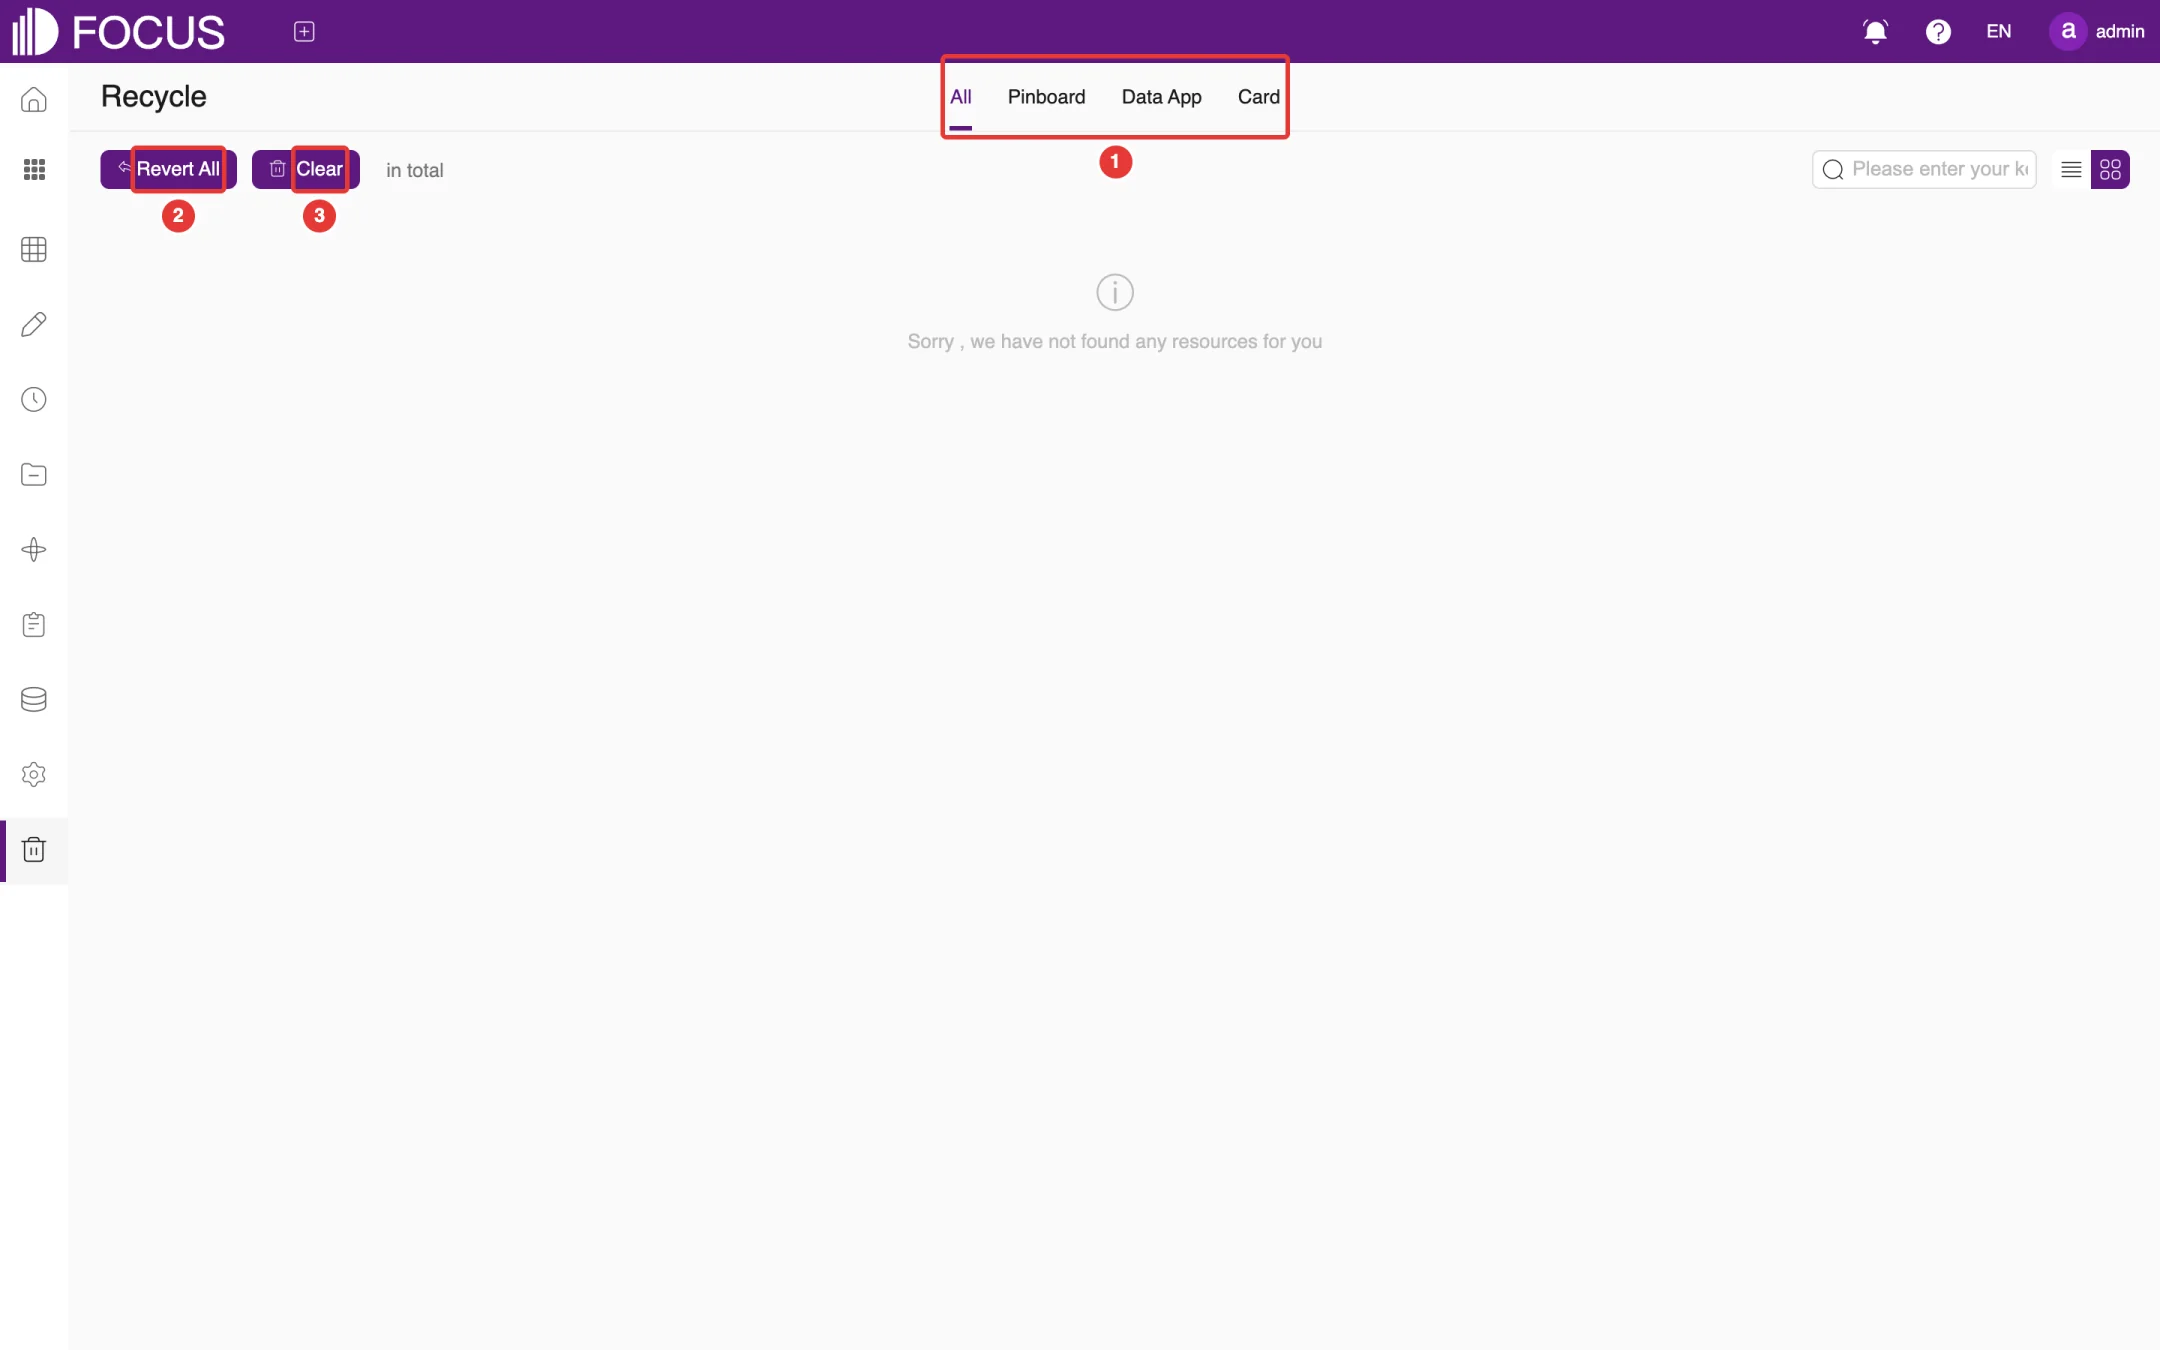
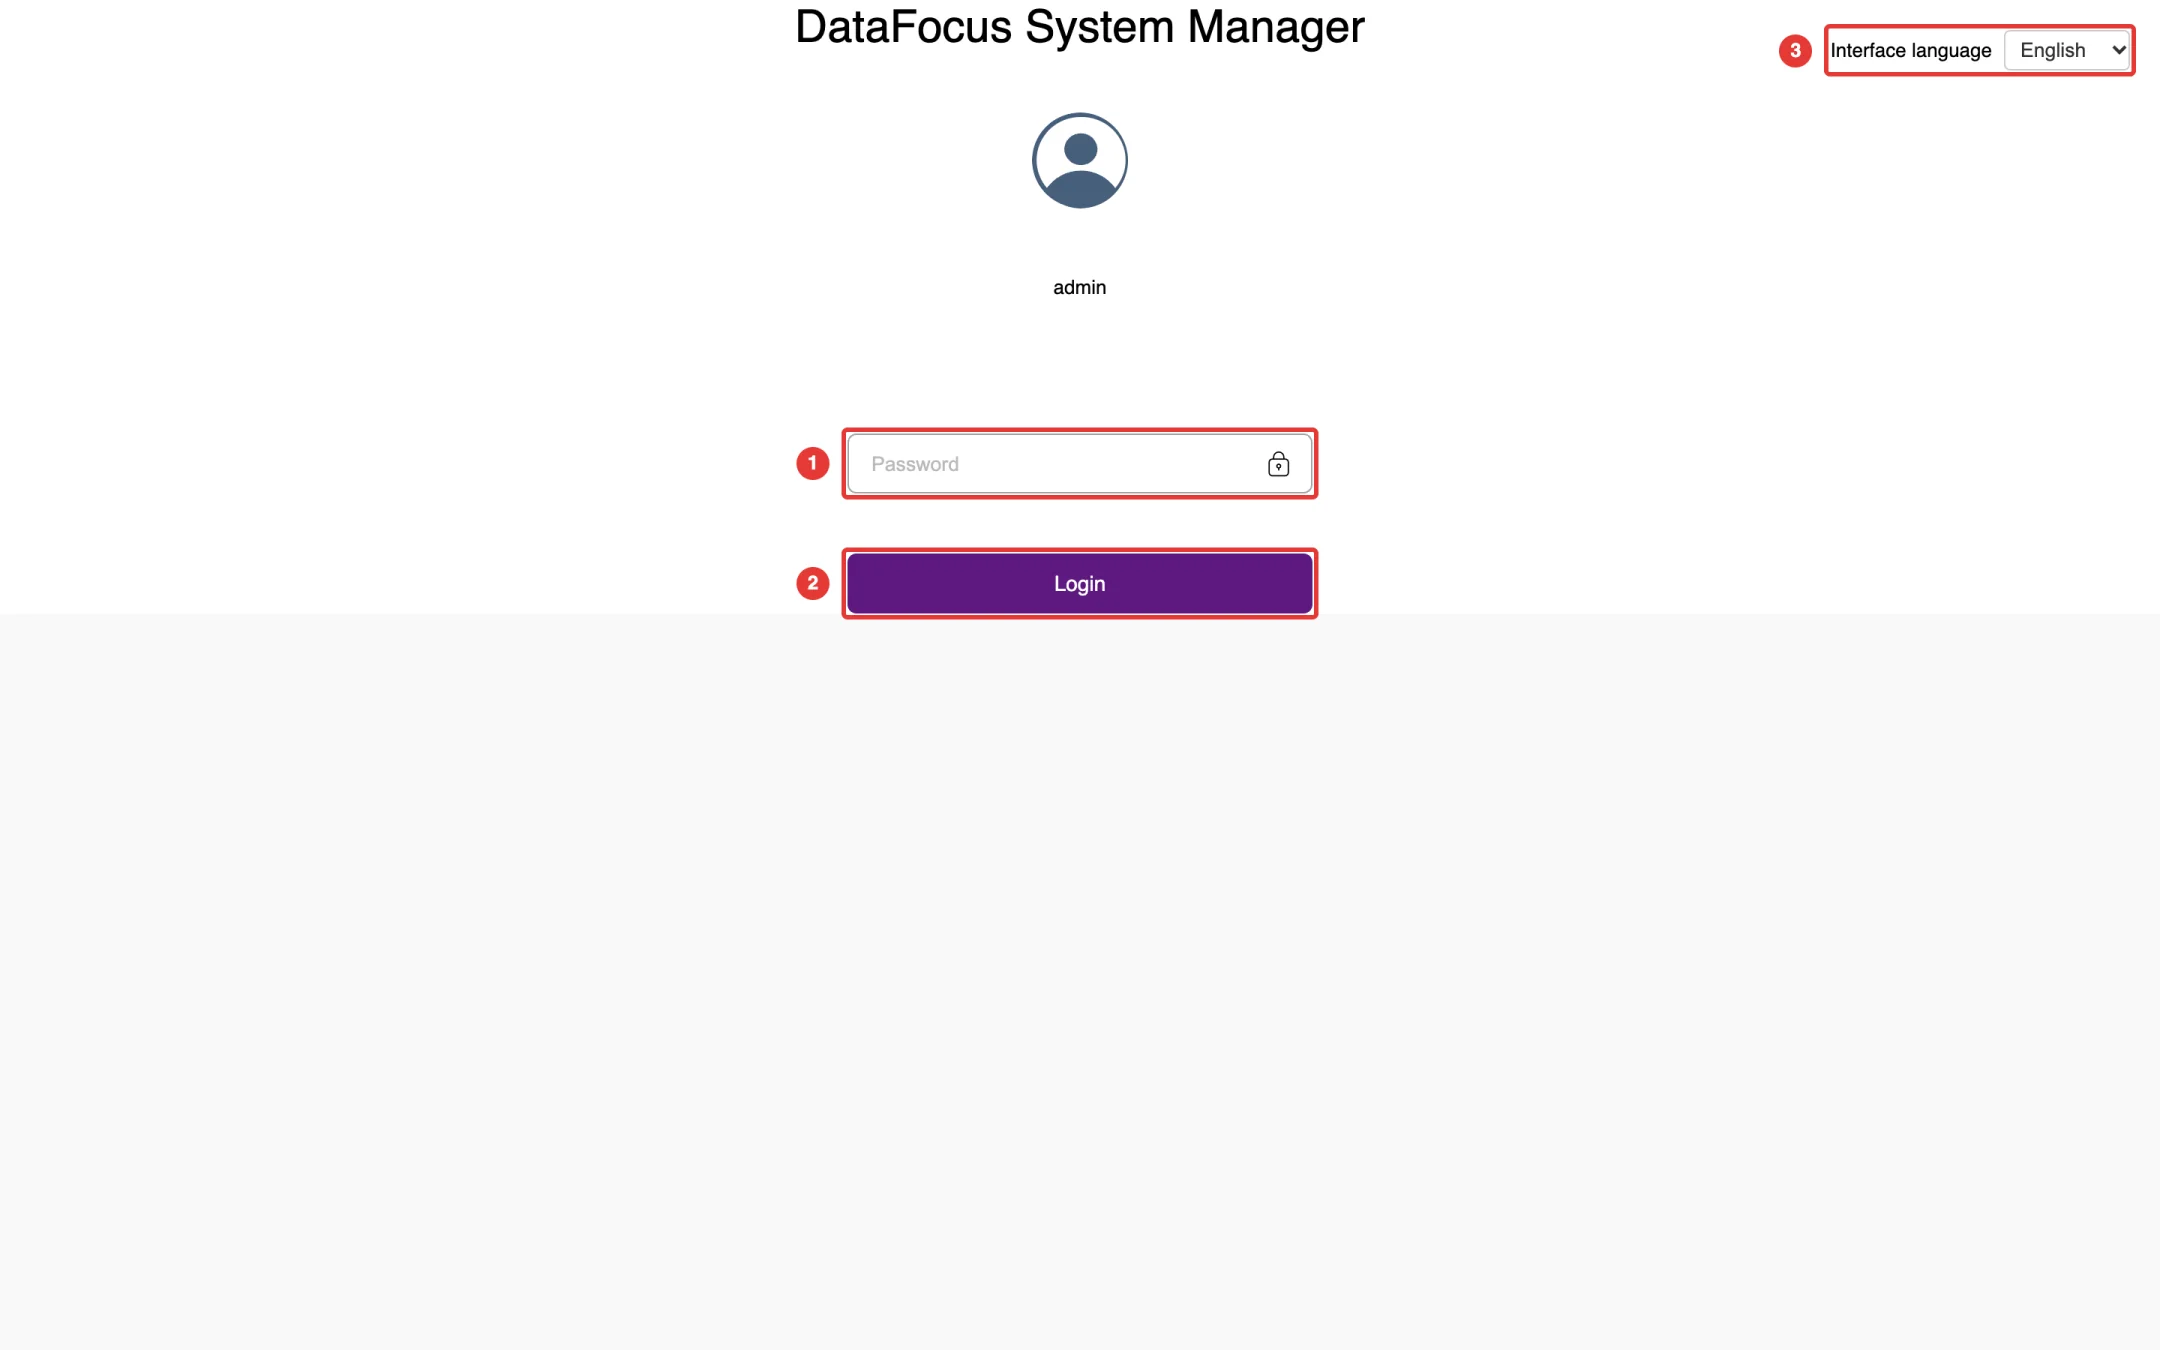
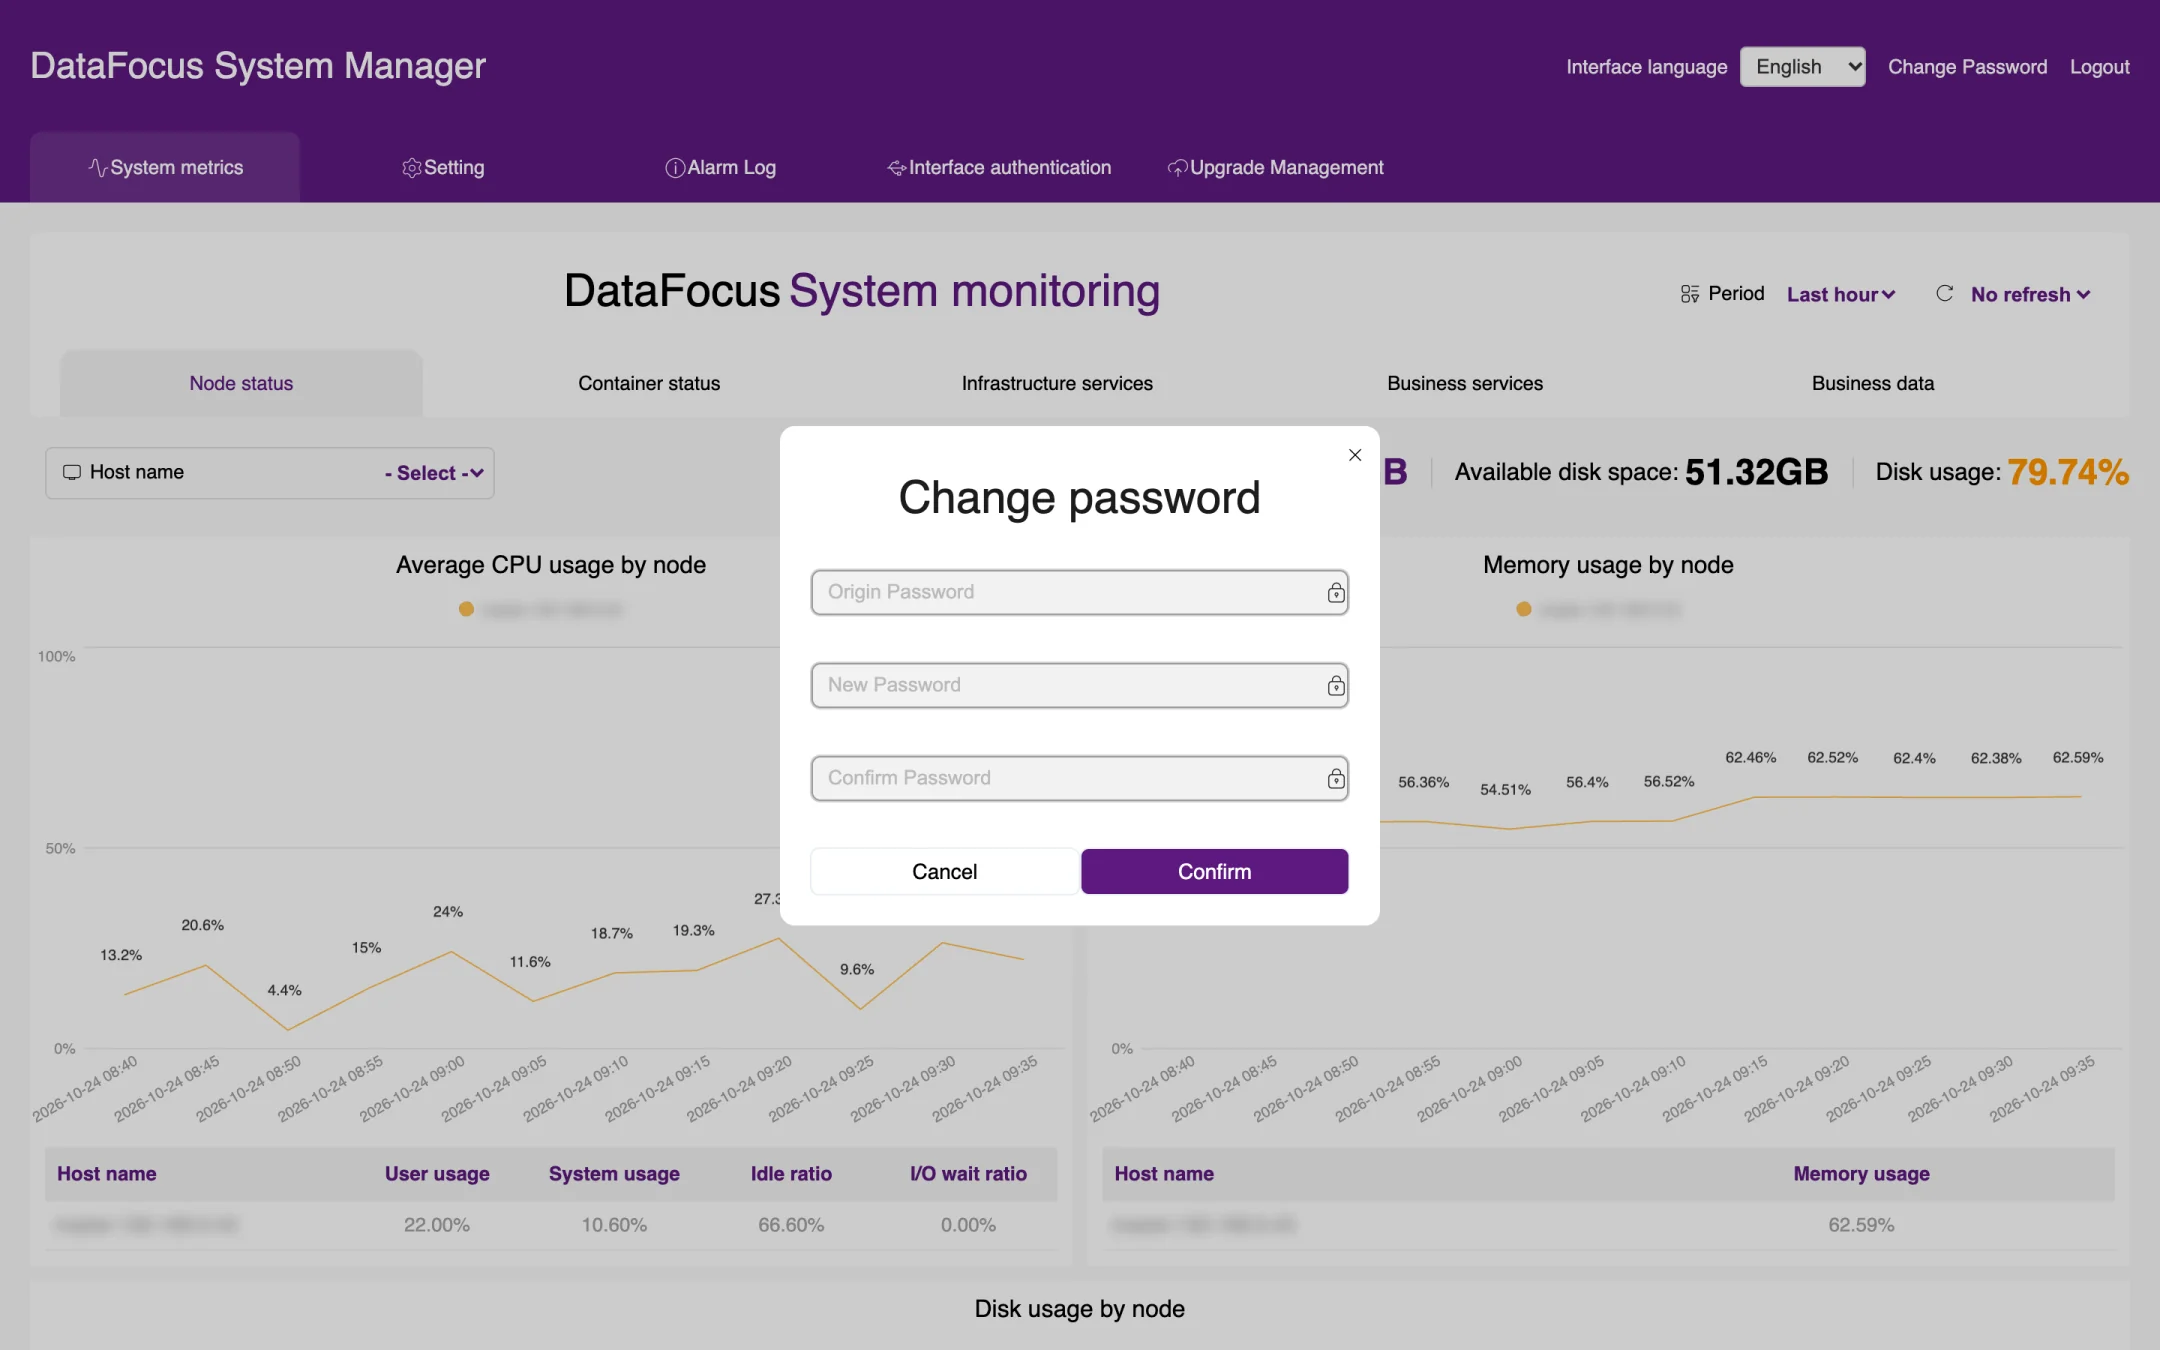
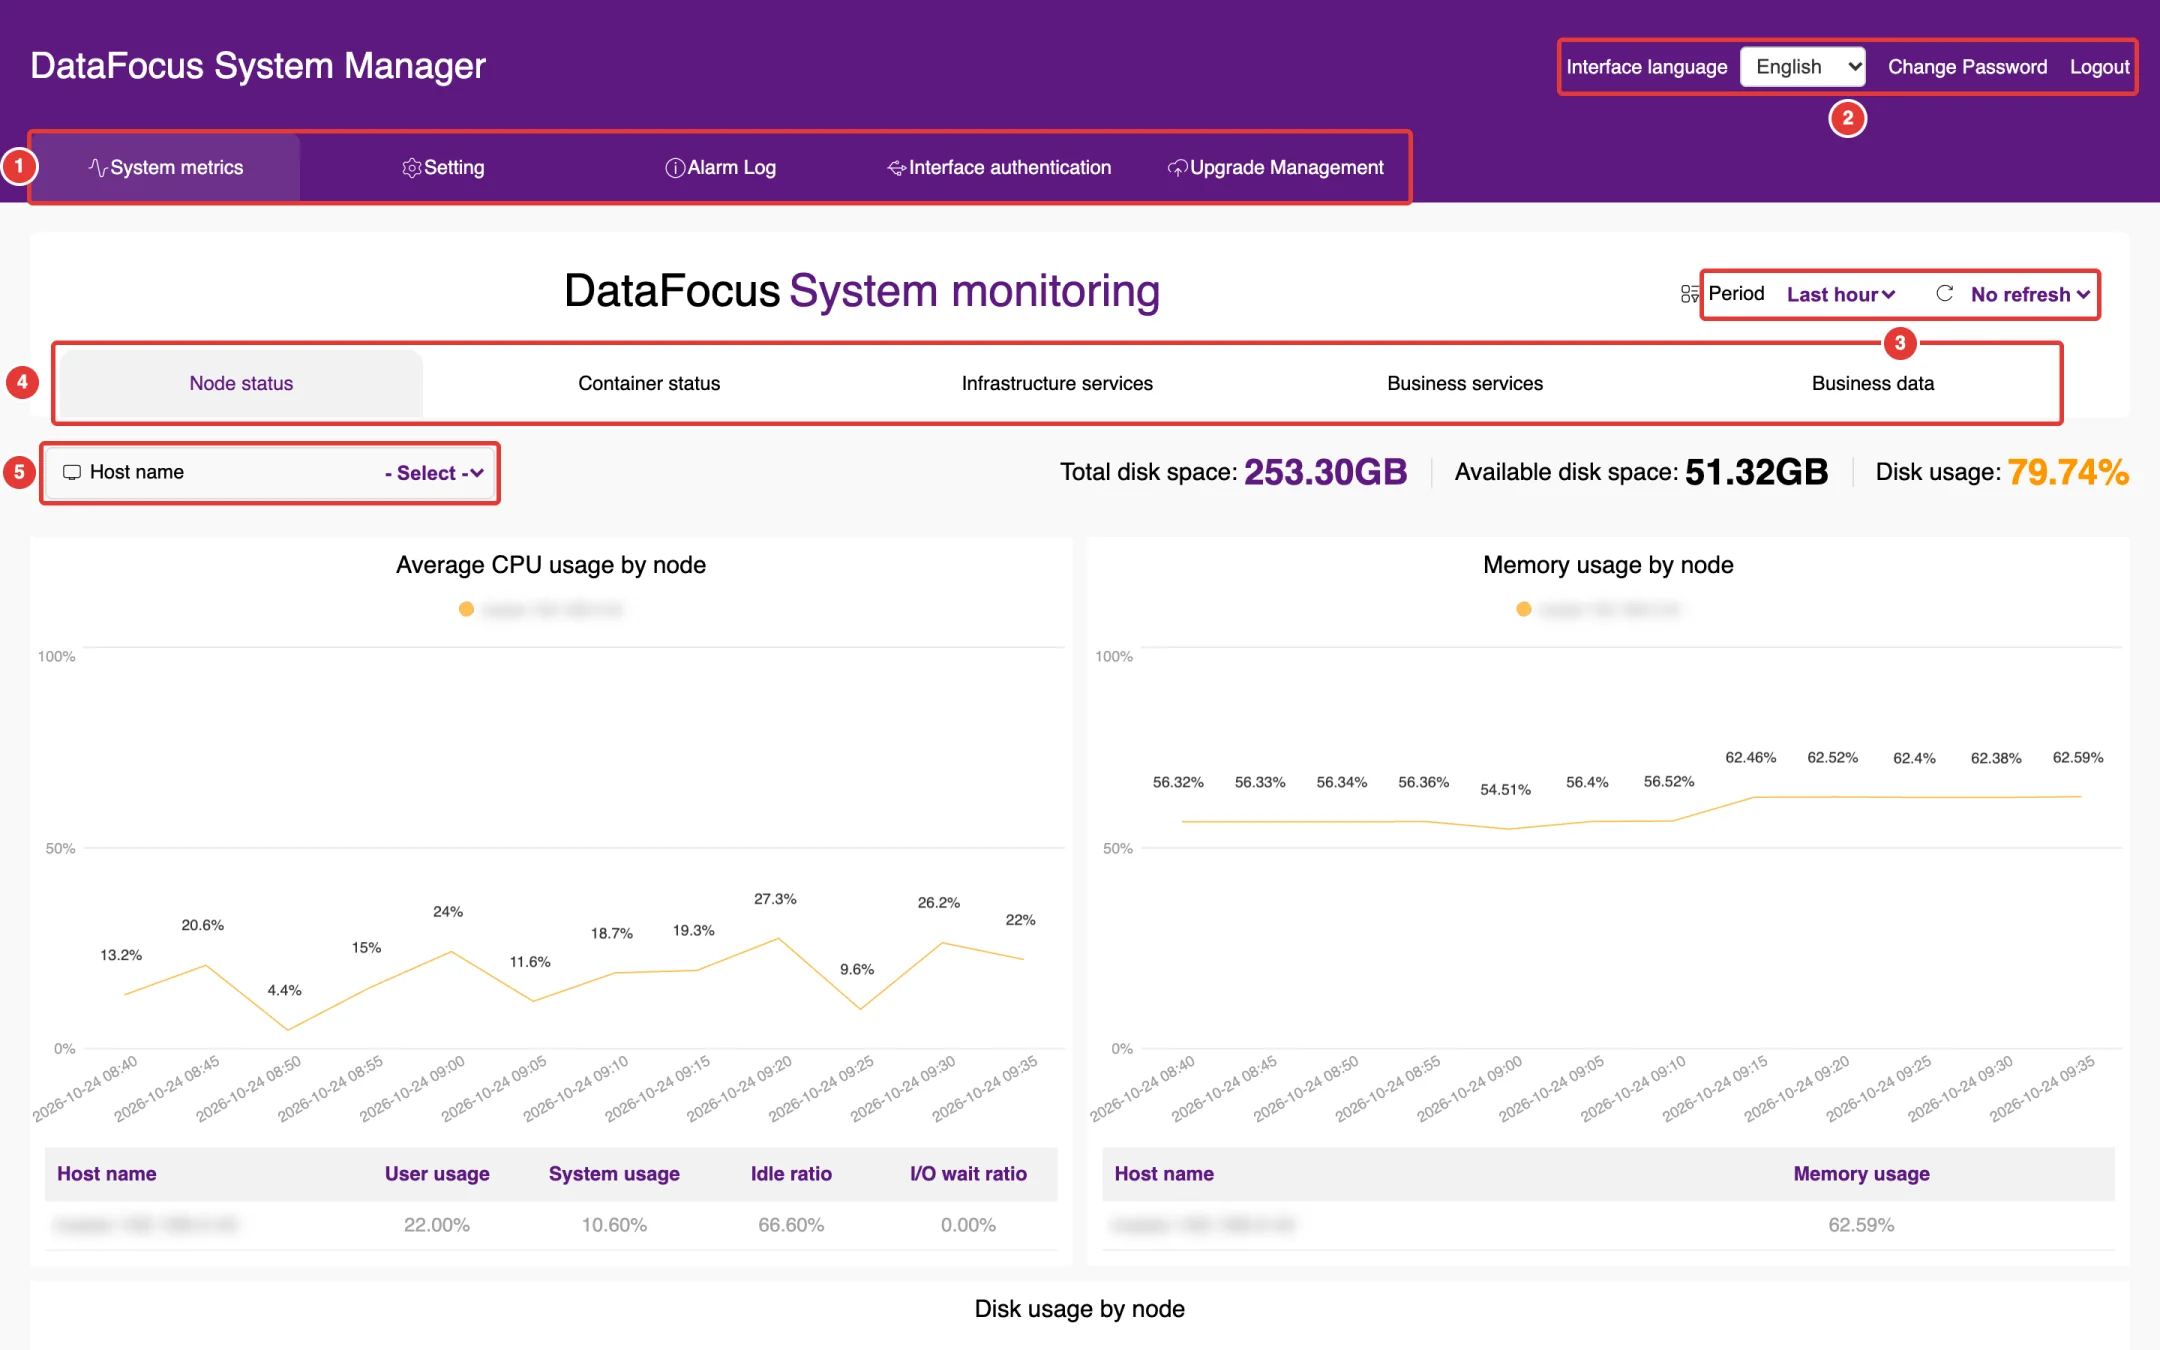
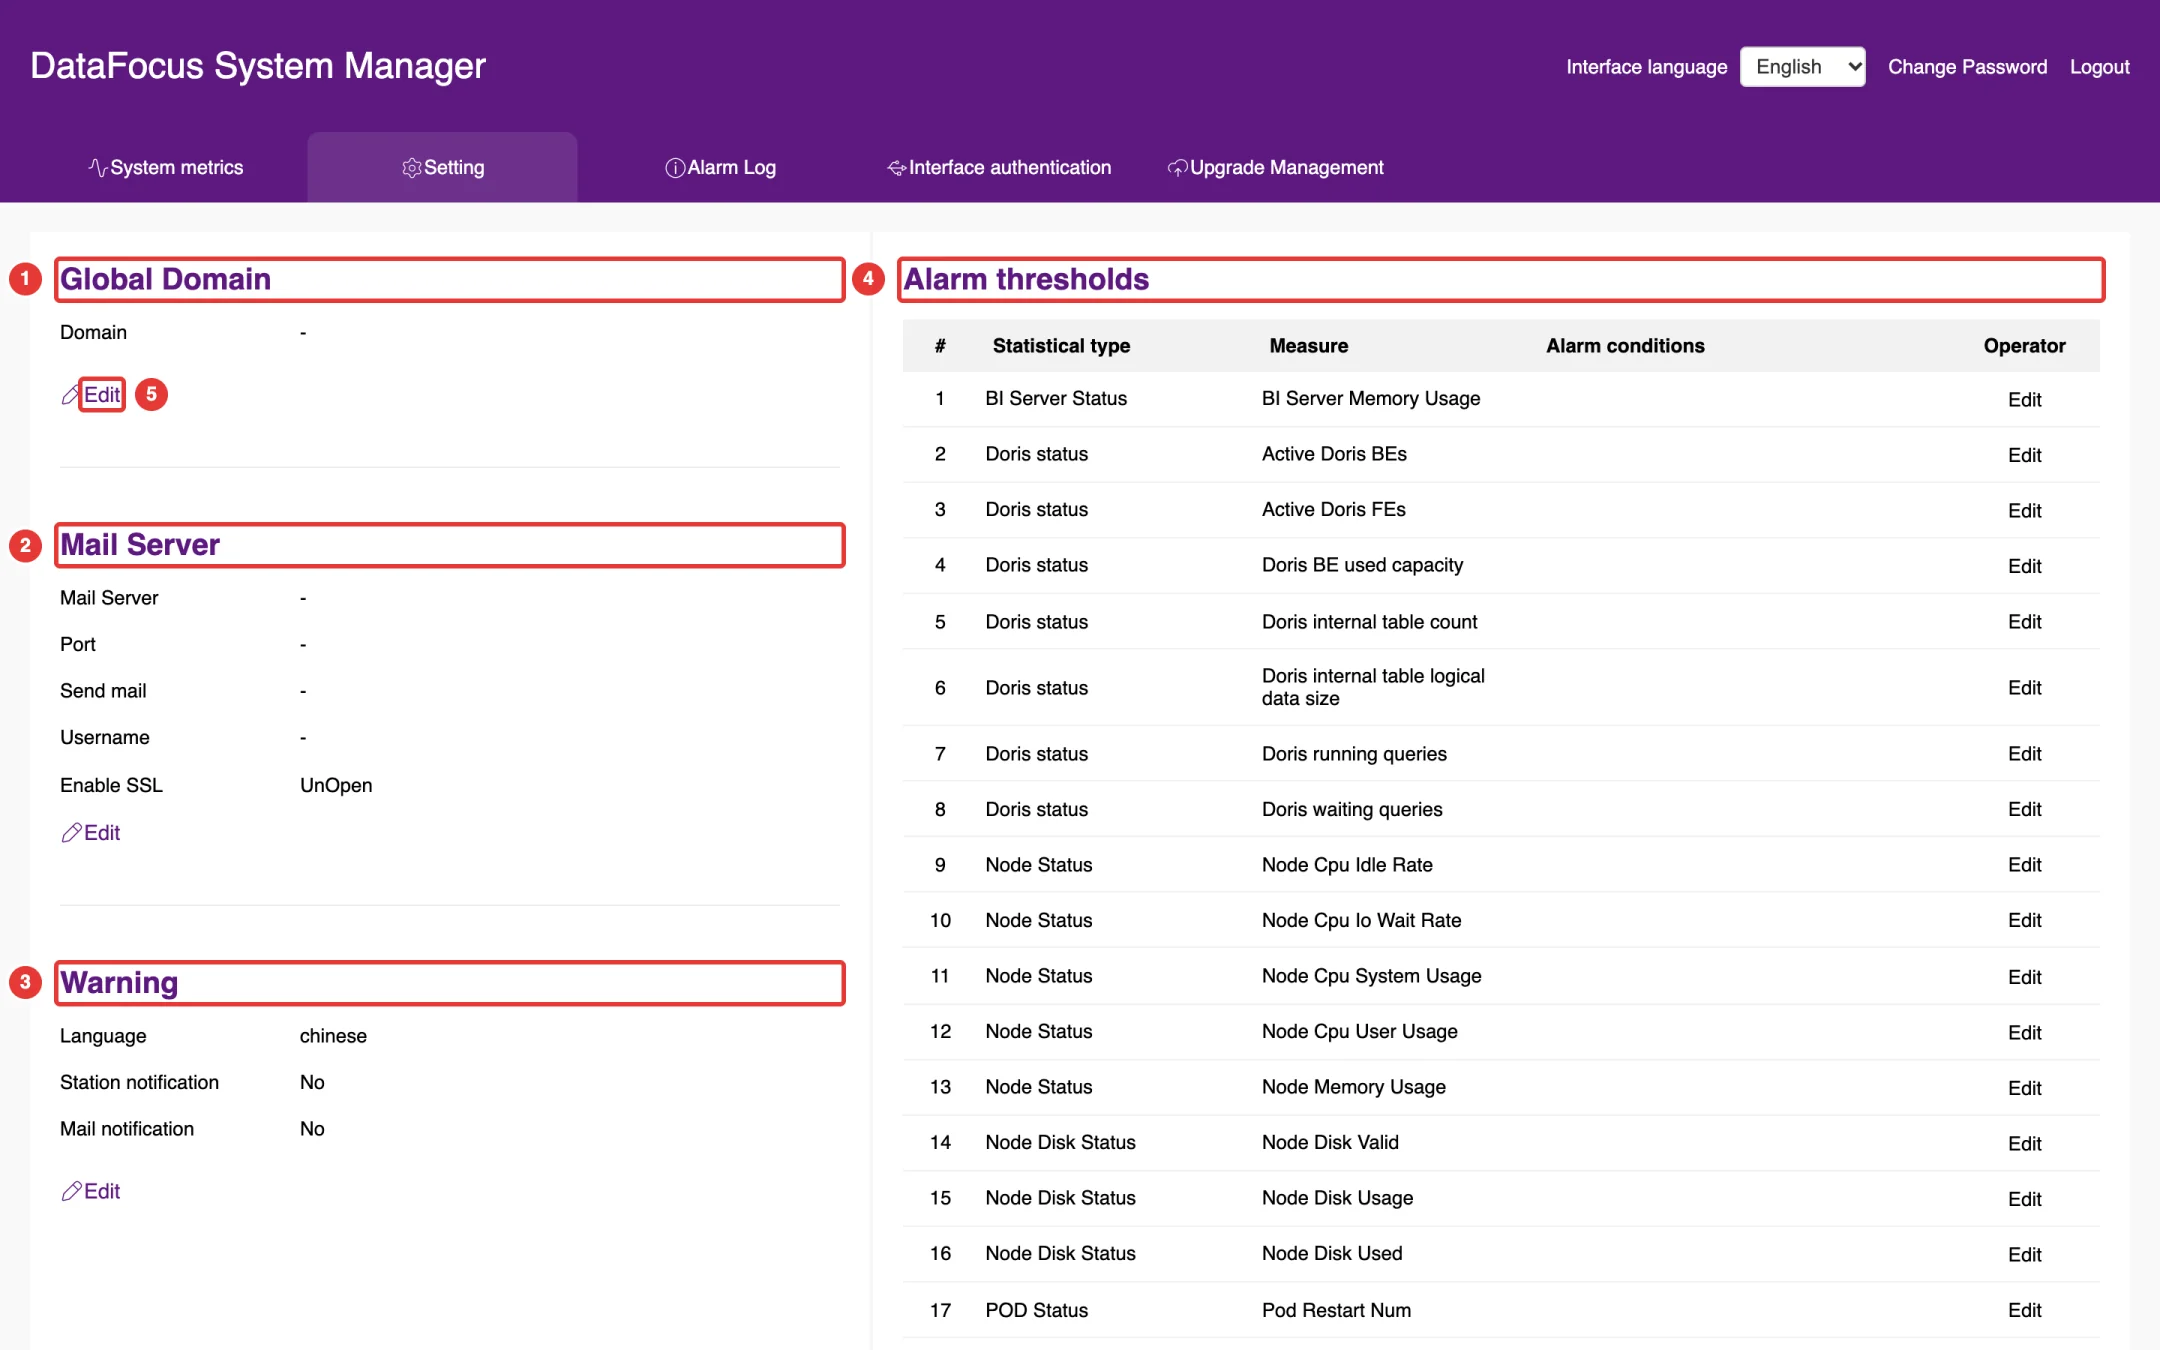
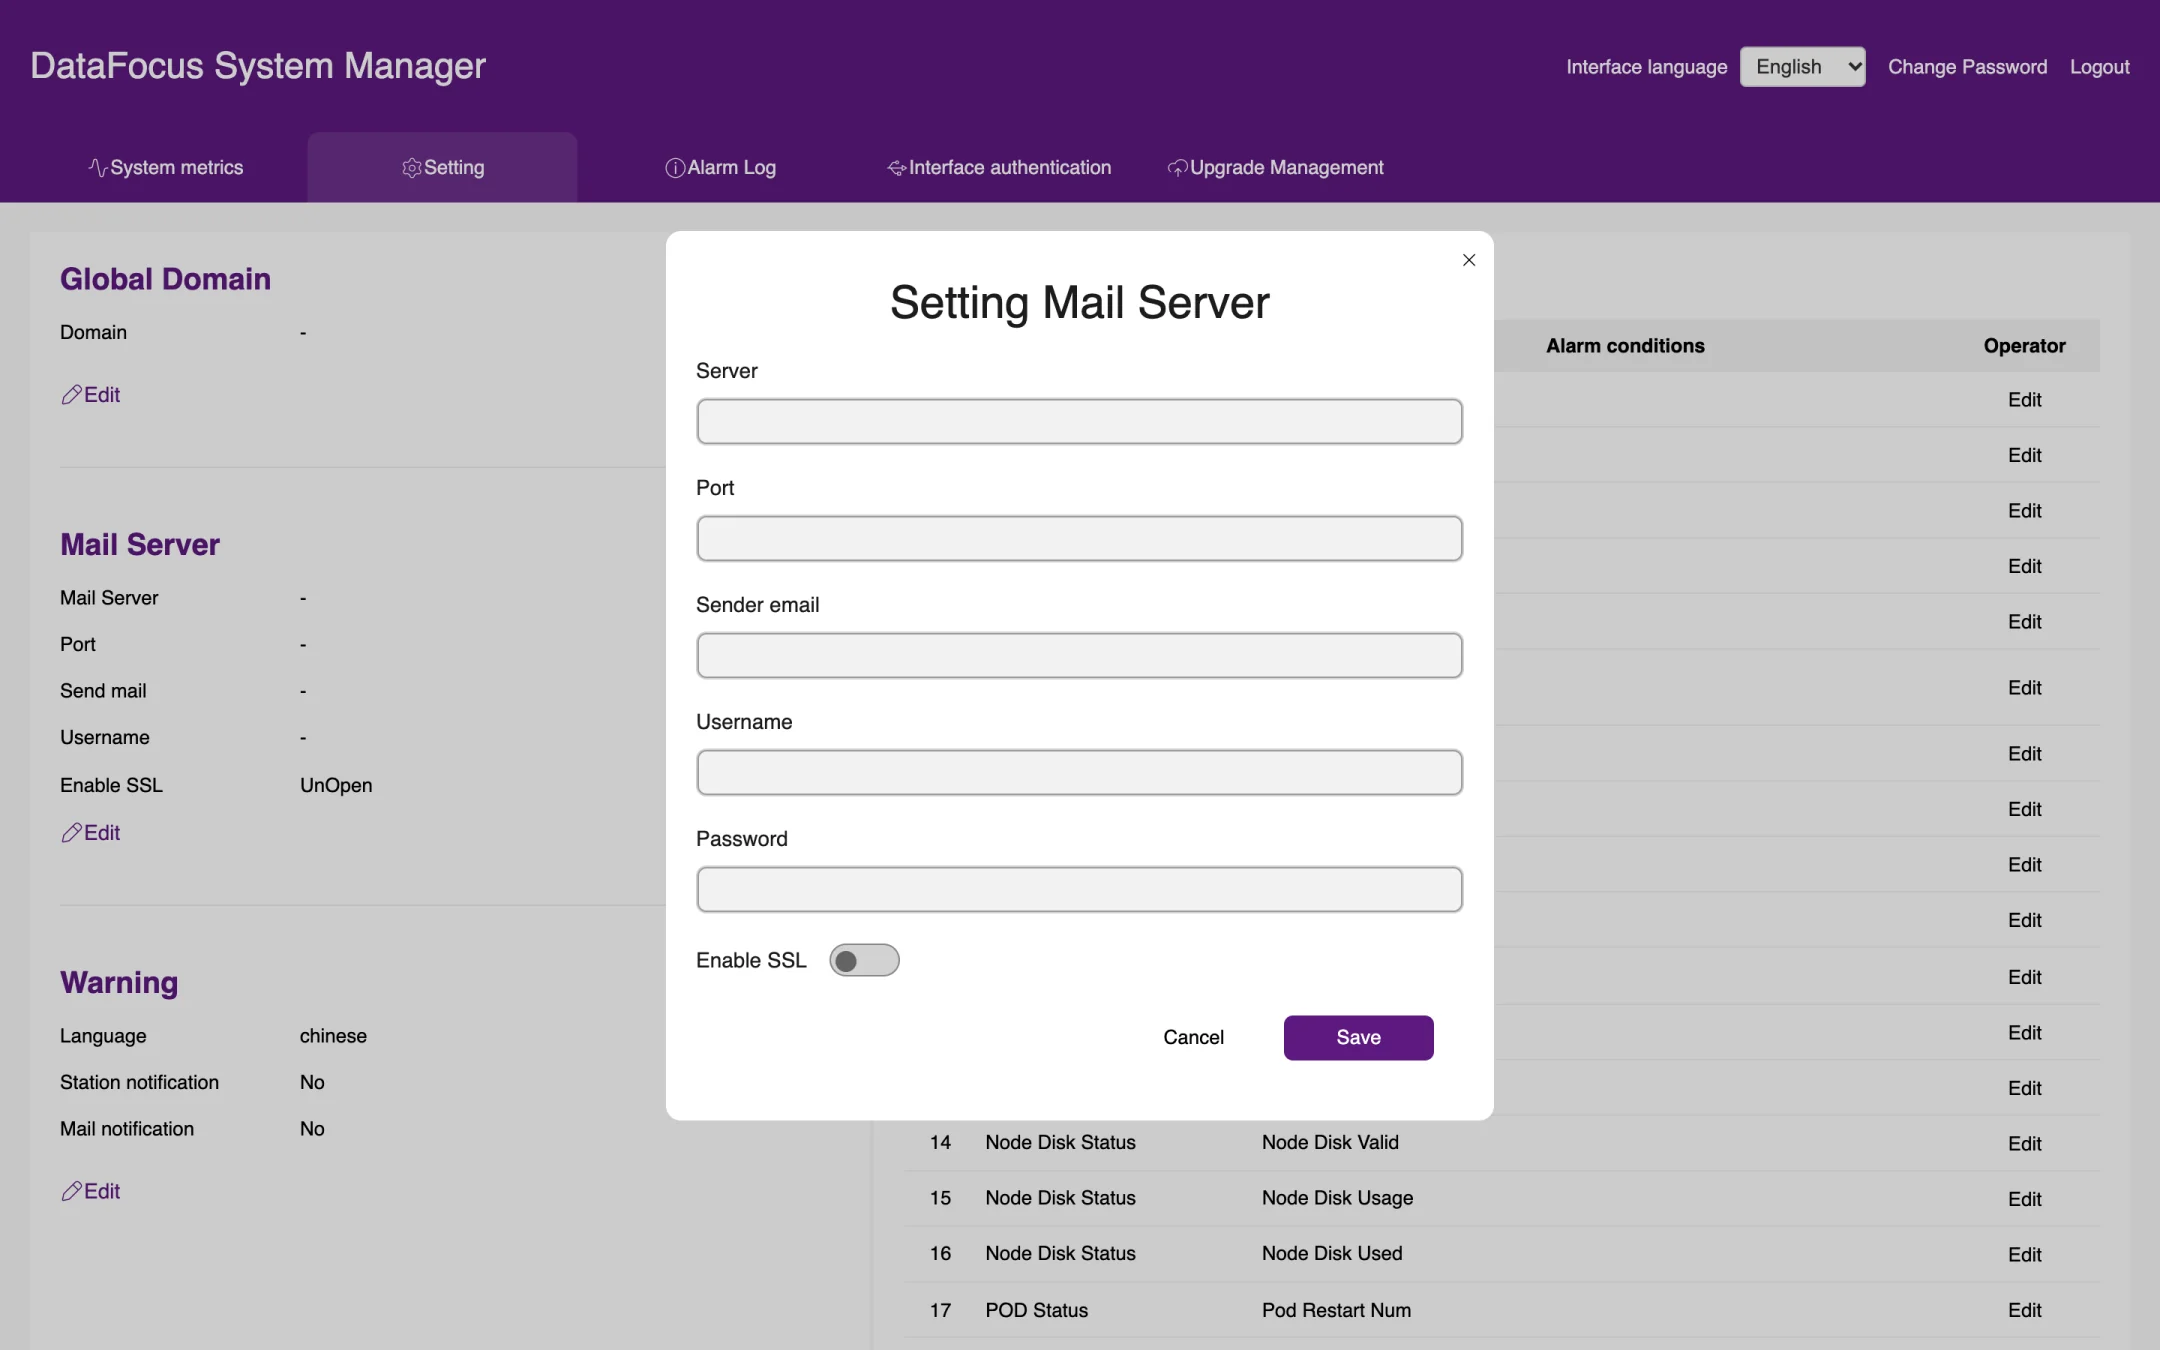
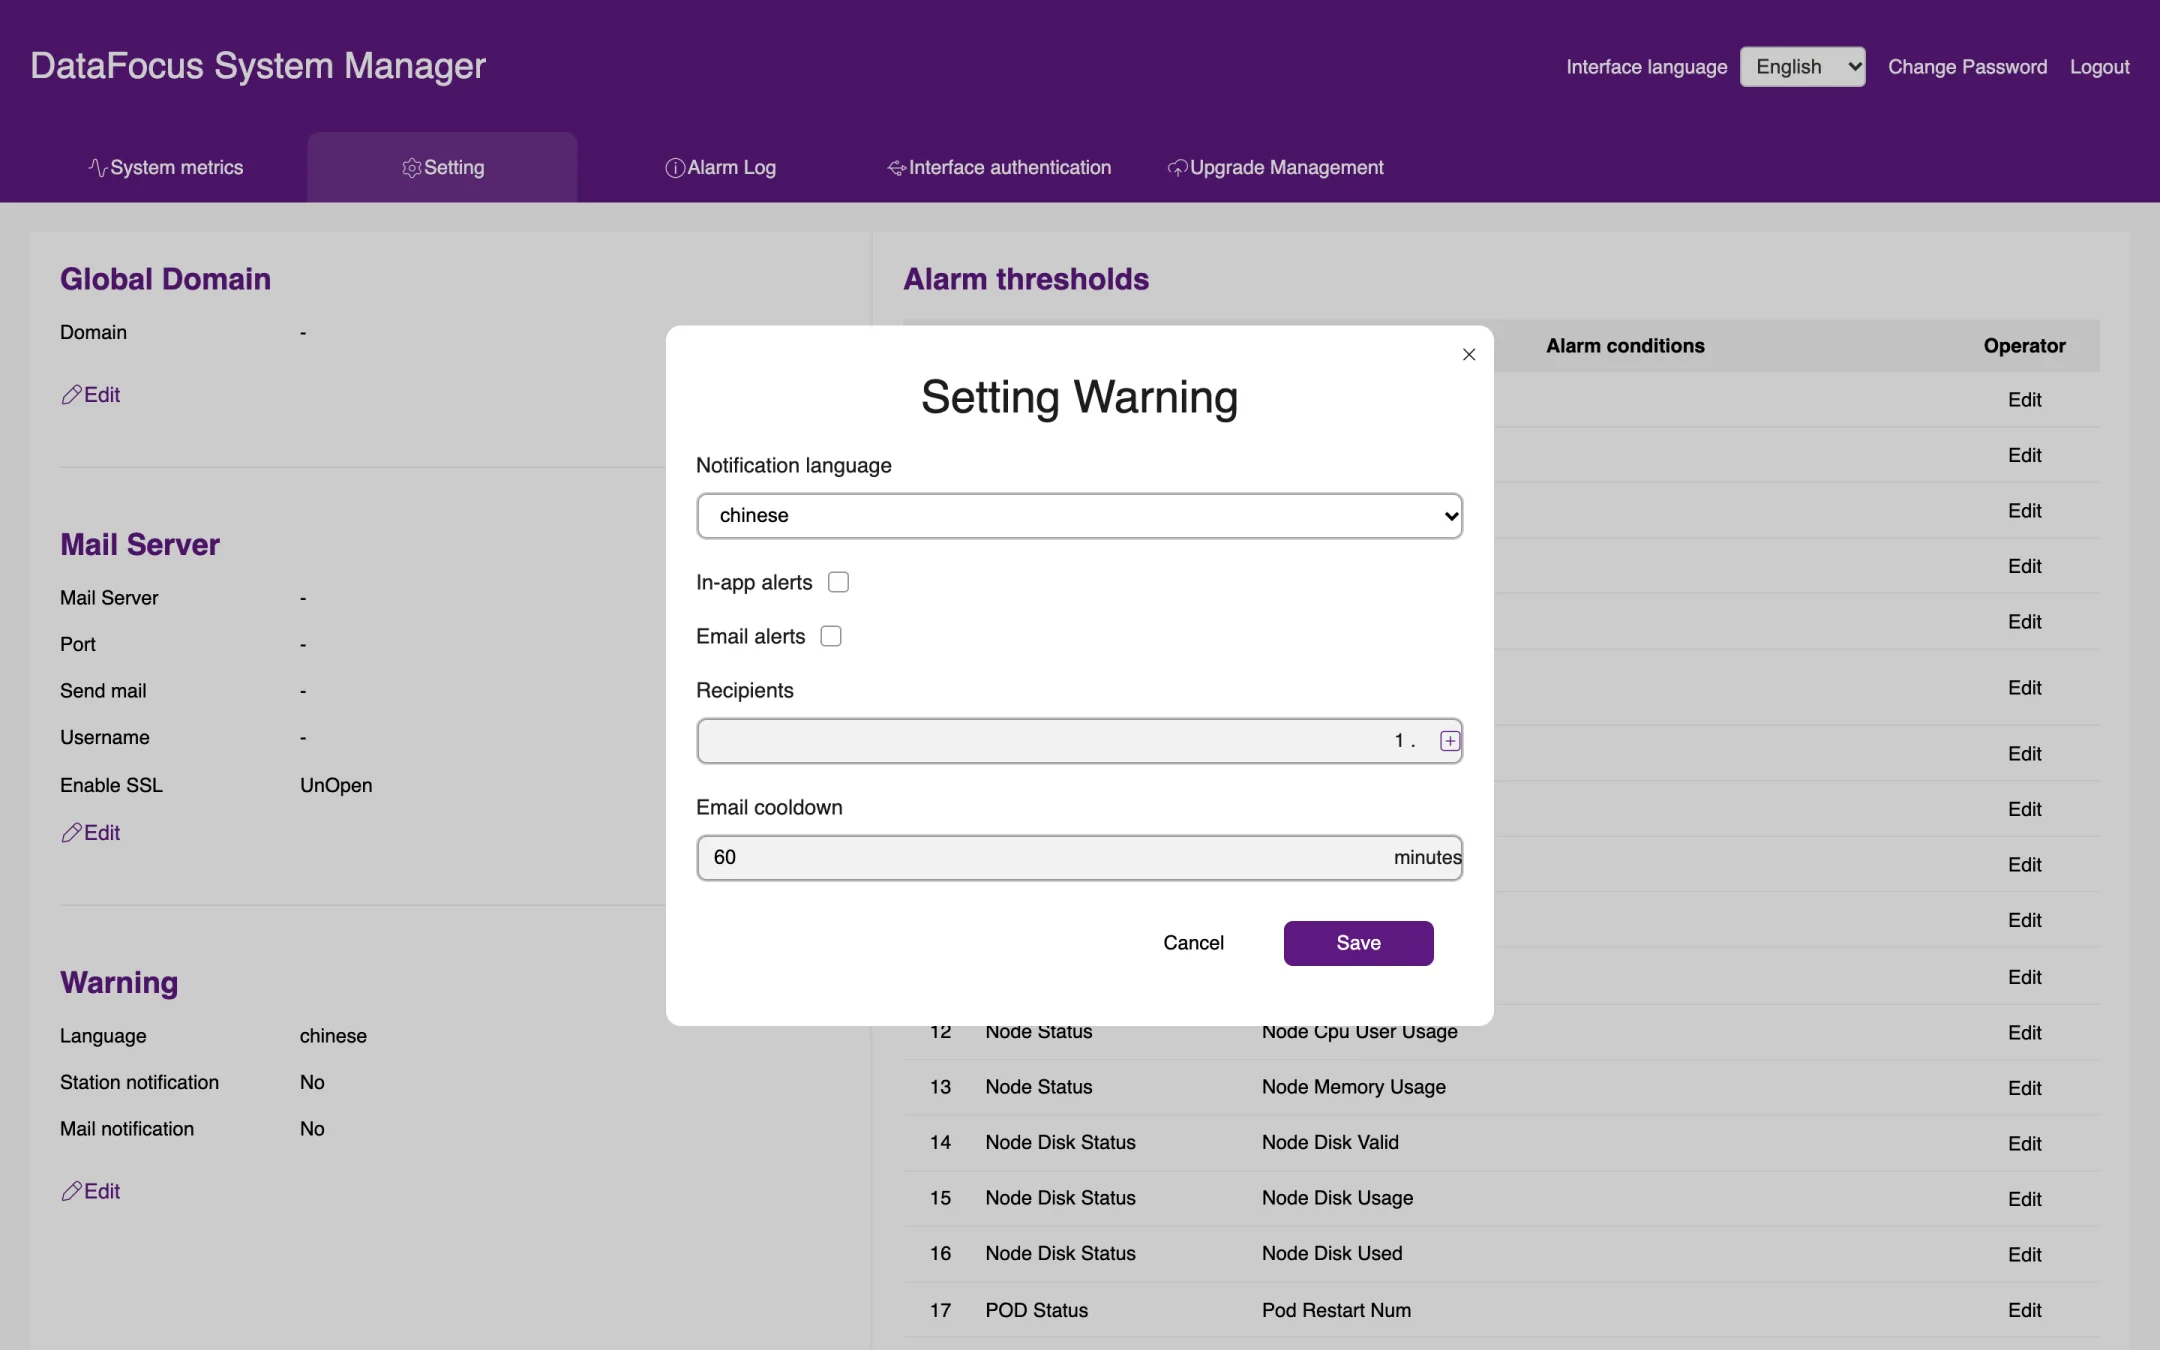
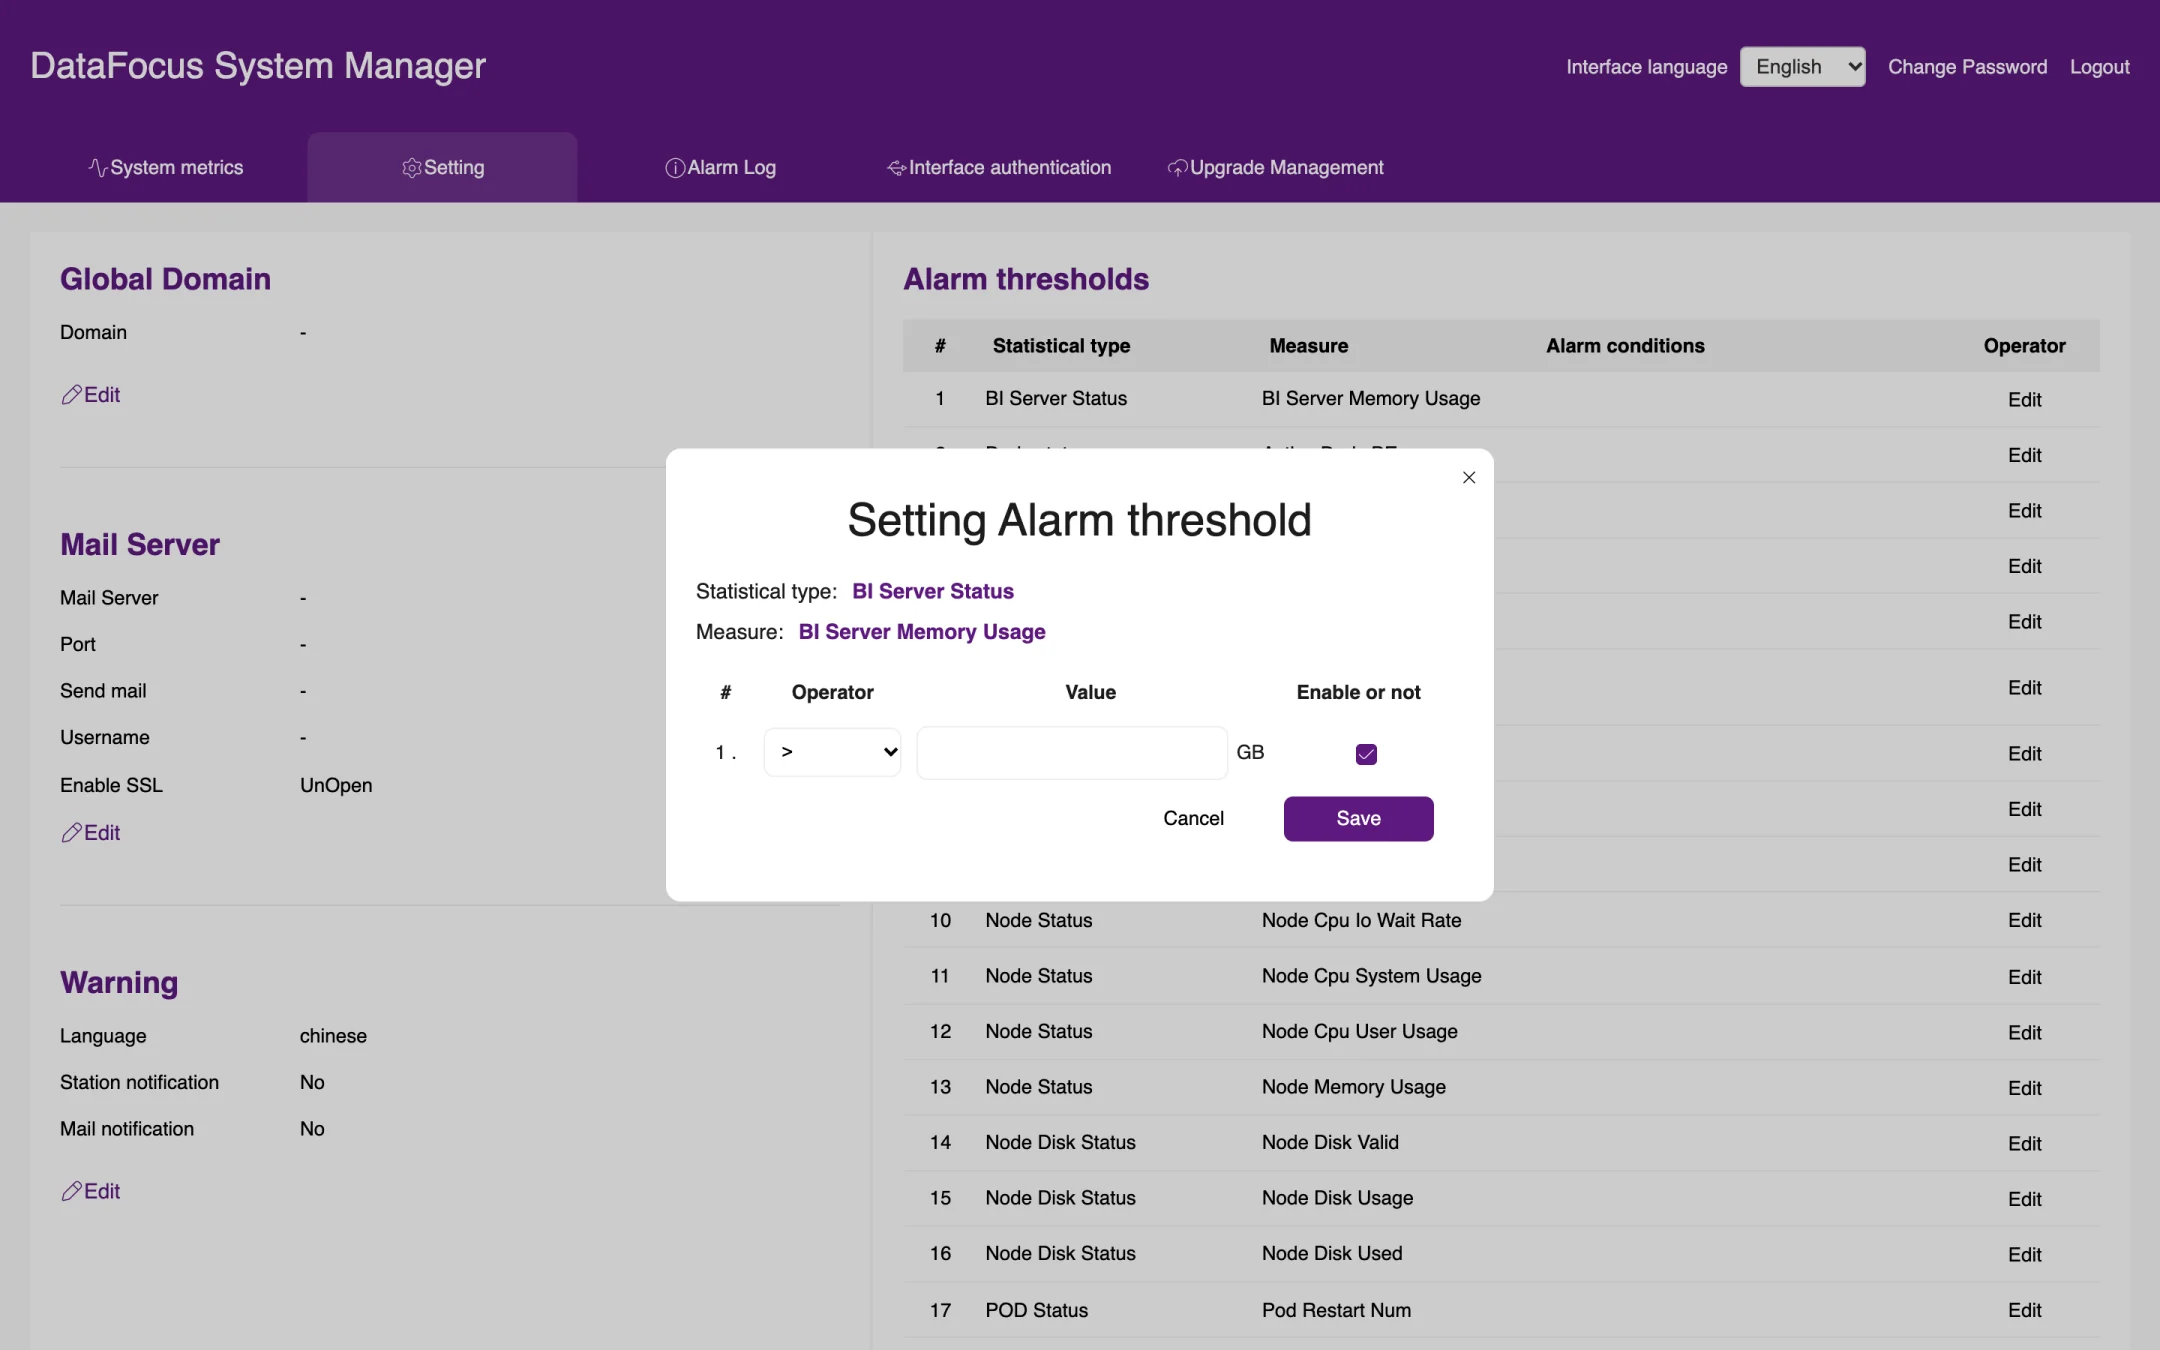
This manual goes through the OT Flash menus one by one and describes each feature and the steps to use it. All screenshots come from the English UI of OT Flash r57. The examples use sample data created for this manual (names starting with Manual_Sample_); some built-in demo content, such as the preset ontologies and demo tables, appears in Chinese. Red boxes and numbered badges mark where to click.
Version
OT Flash r57
Audience
Business users, data maintainers, system administrators, operations administrators
Browser
Latest version of Chrome
UI language
English; the product supports 21 UI languages
Chapter 1Introduction
OT Flash is a data analysis and knowledge platform for business users. You can query data by typing keywords, much as you would in a search engine, and the system draws a chart for you automatically. You can also ask FocusGPT questions in natural language, or talk to an ontology agent that combines your business data and documents to give you an analysis. Results can be saved as answers, combined into pinboards, and sent to the right people on a schedule.
This chapter explains how to log in, introduces the main interface, and shows the basics of the Ontology Workbench on the home page.
1.1Logging in
1.1.1Log in
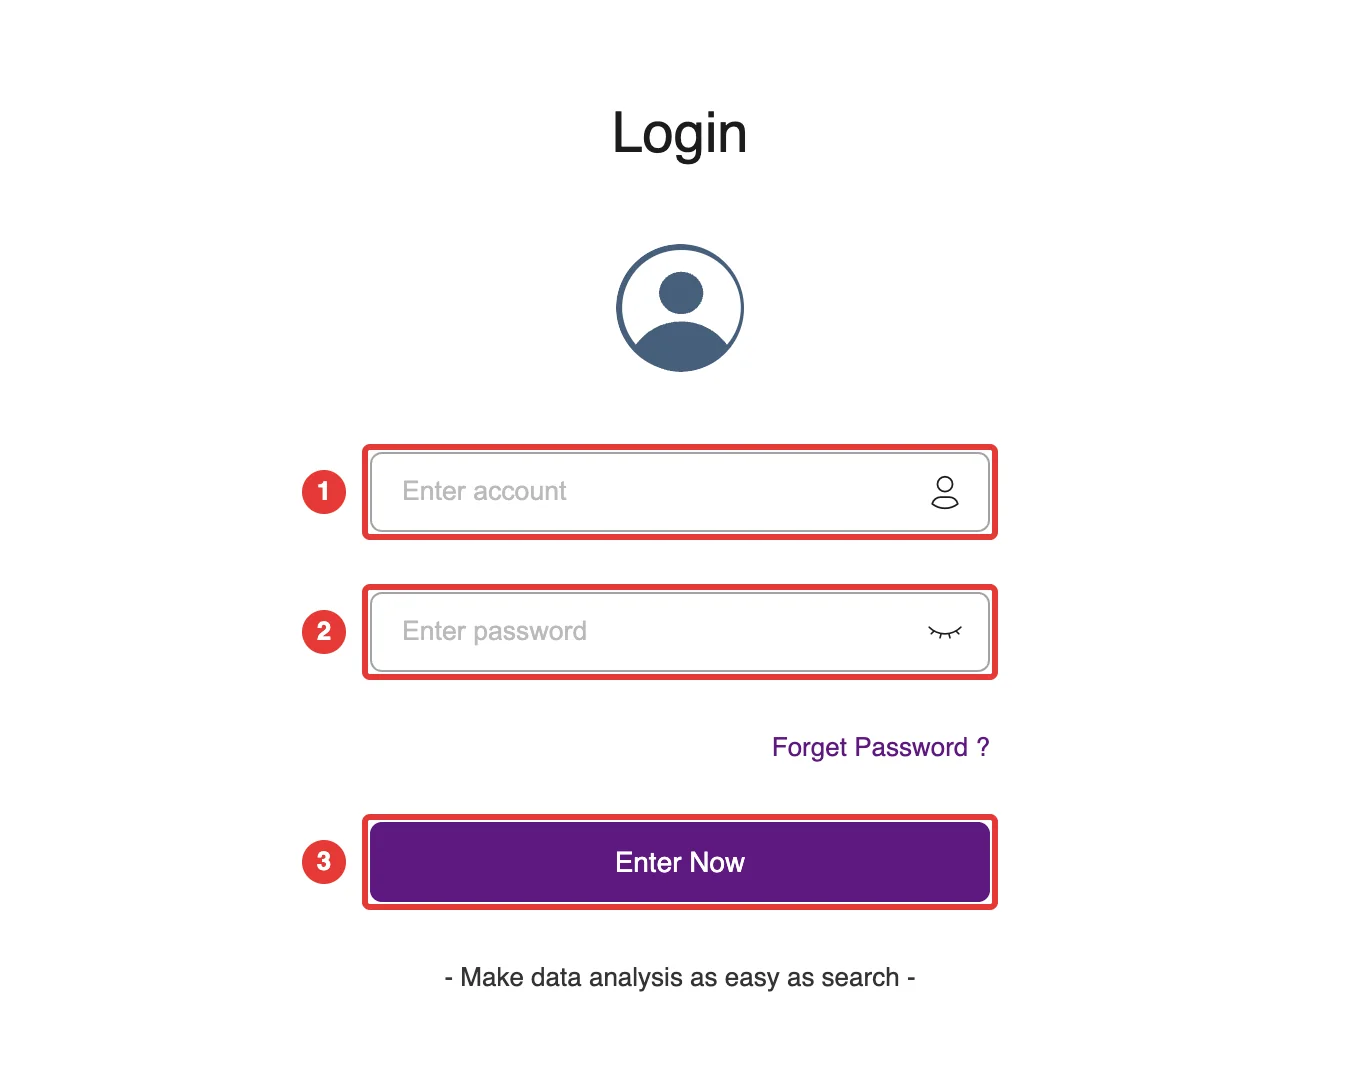
In your browser, open the address provided by your administrator (for example https://<server address>:31600). The login page opens, as shown in Figure 1-1. We recommend Google Chrome.
Enter your account at ① and your password at ②.
Click Enter Now at ③ to open the home page.
Figure 1-1. Login page
Note: The first time the administrator logs in, the system asks for the default password to be changed. You can continue only after the password has been changed.
1.1.2Forgot your password
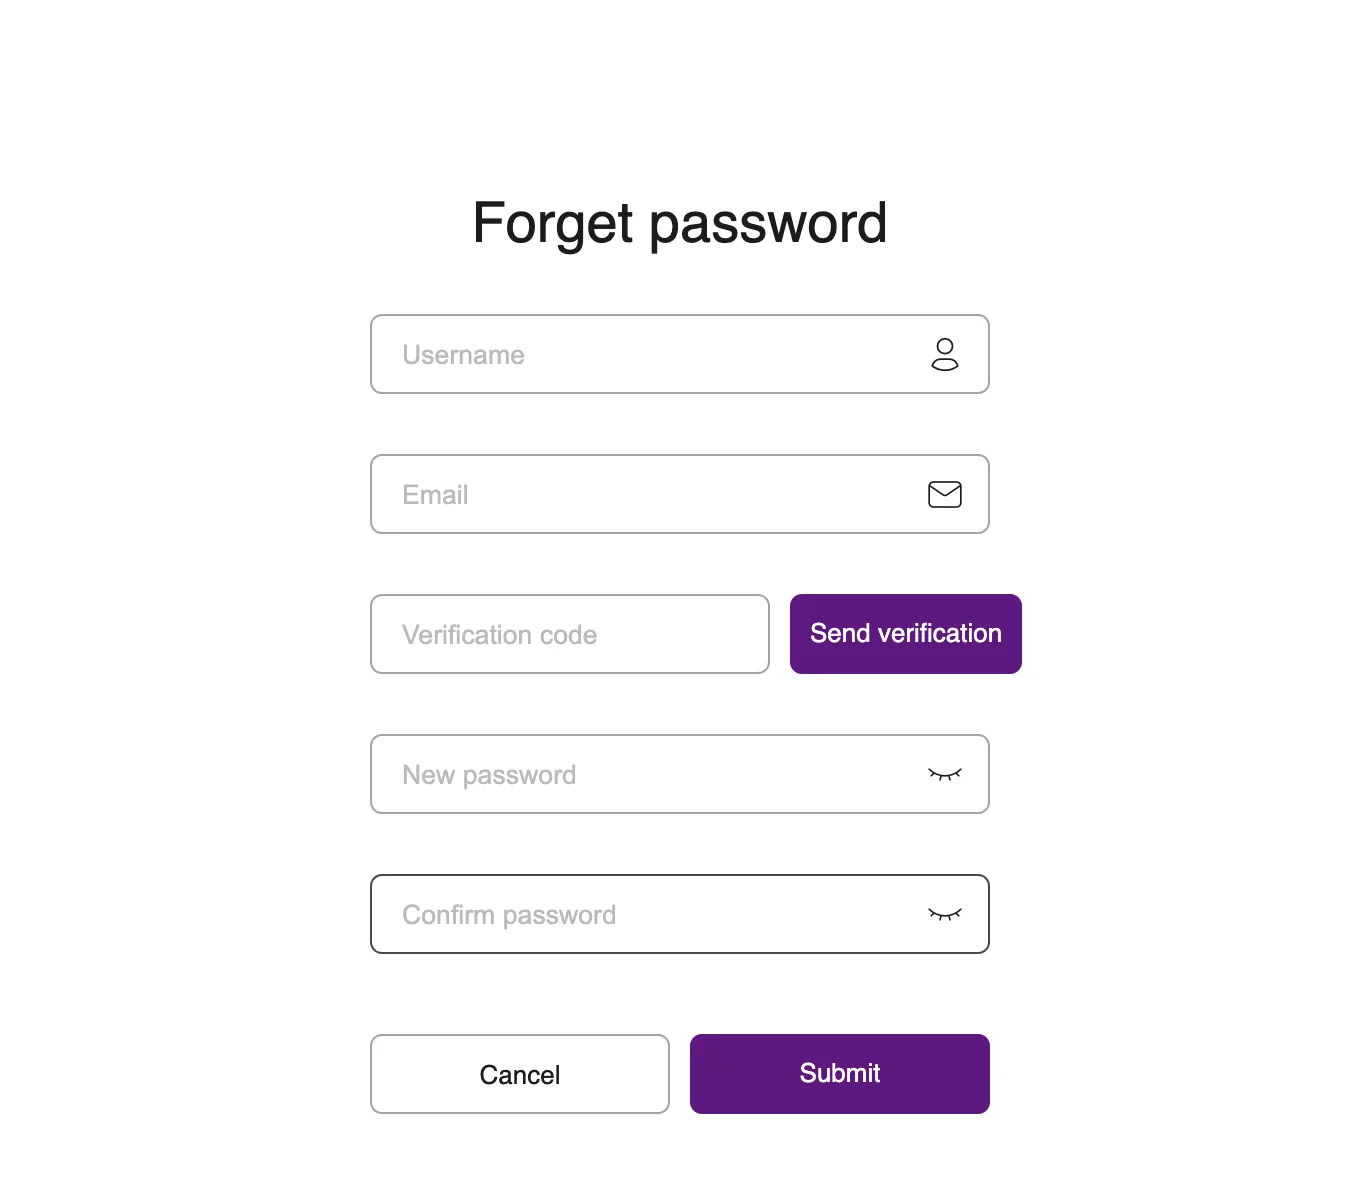
On the login page, click Forget Password ? to open the Forget password page, as shown in Figure 1-2:
Enter your username and the email address bound to your account.
Click Send verification, then check your mailbox for the verification code and enter it.
Enter a new password, and enter it again to confirm.
Click Submit to reset the password. From now on, log in with the new password.
Figure 1-2. Forget password
Note: Password recovery requires a mail server to be configured in the system (see Admin > Configure). If you do not receive a verification code, ask your system administrator to reset your password.
1.1.3Log out
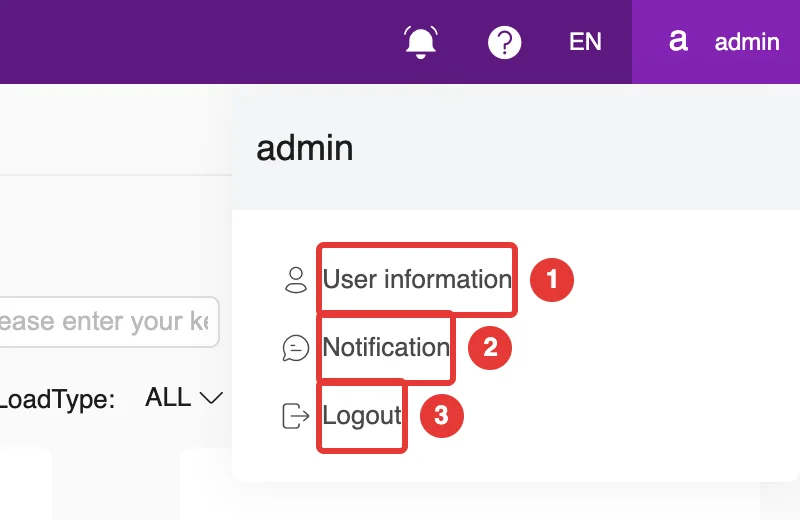
Click your username in the top-right corner of the page and choose Logout from the menu, as shown at ③ in Figure 1-10.
1.2The interface
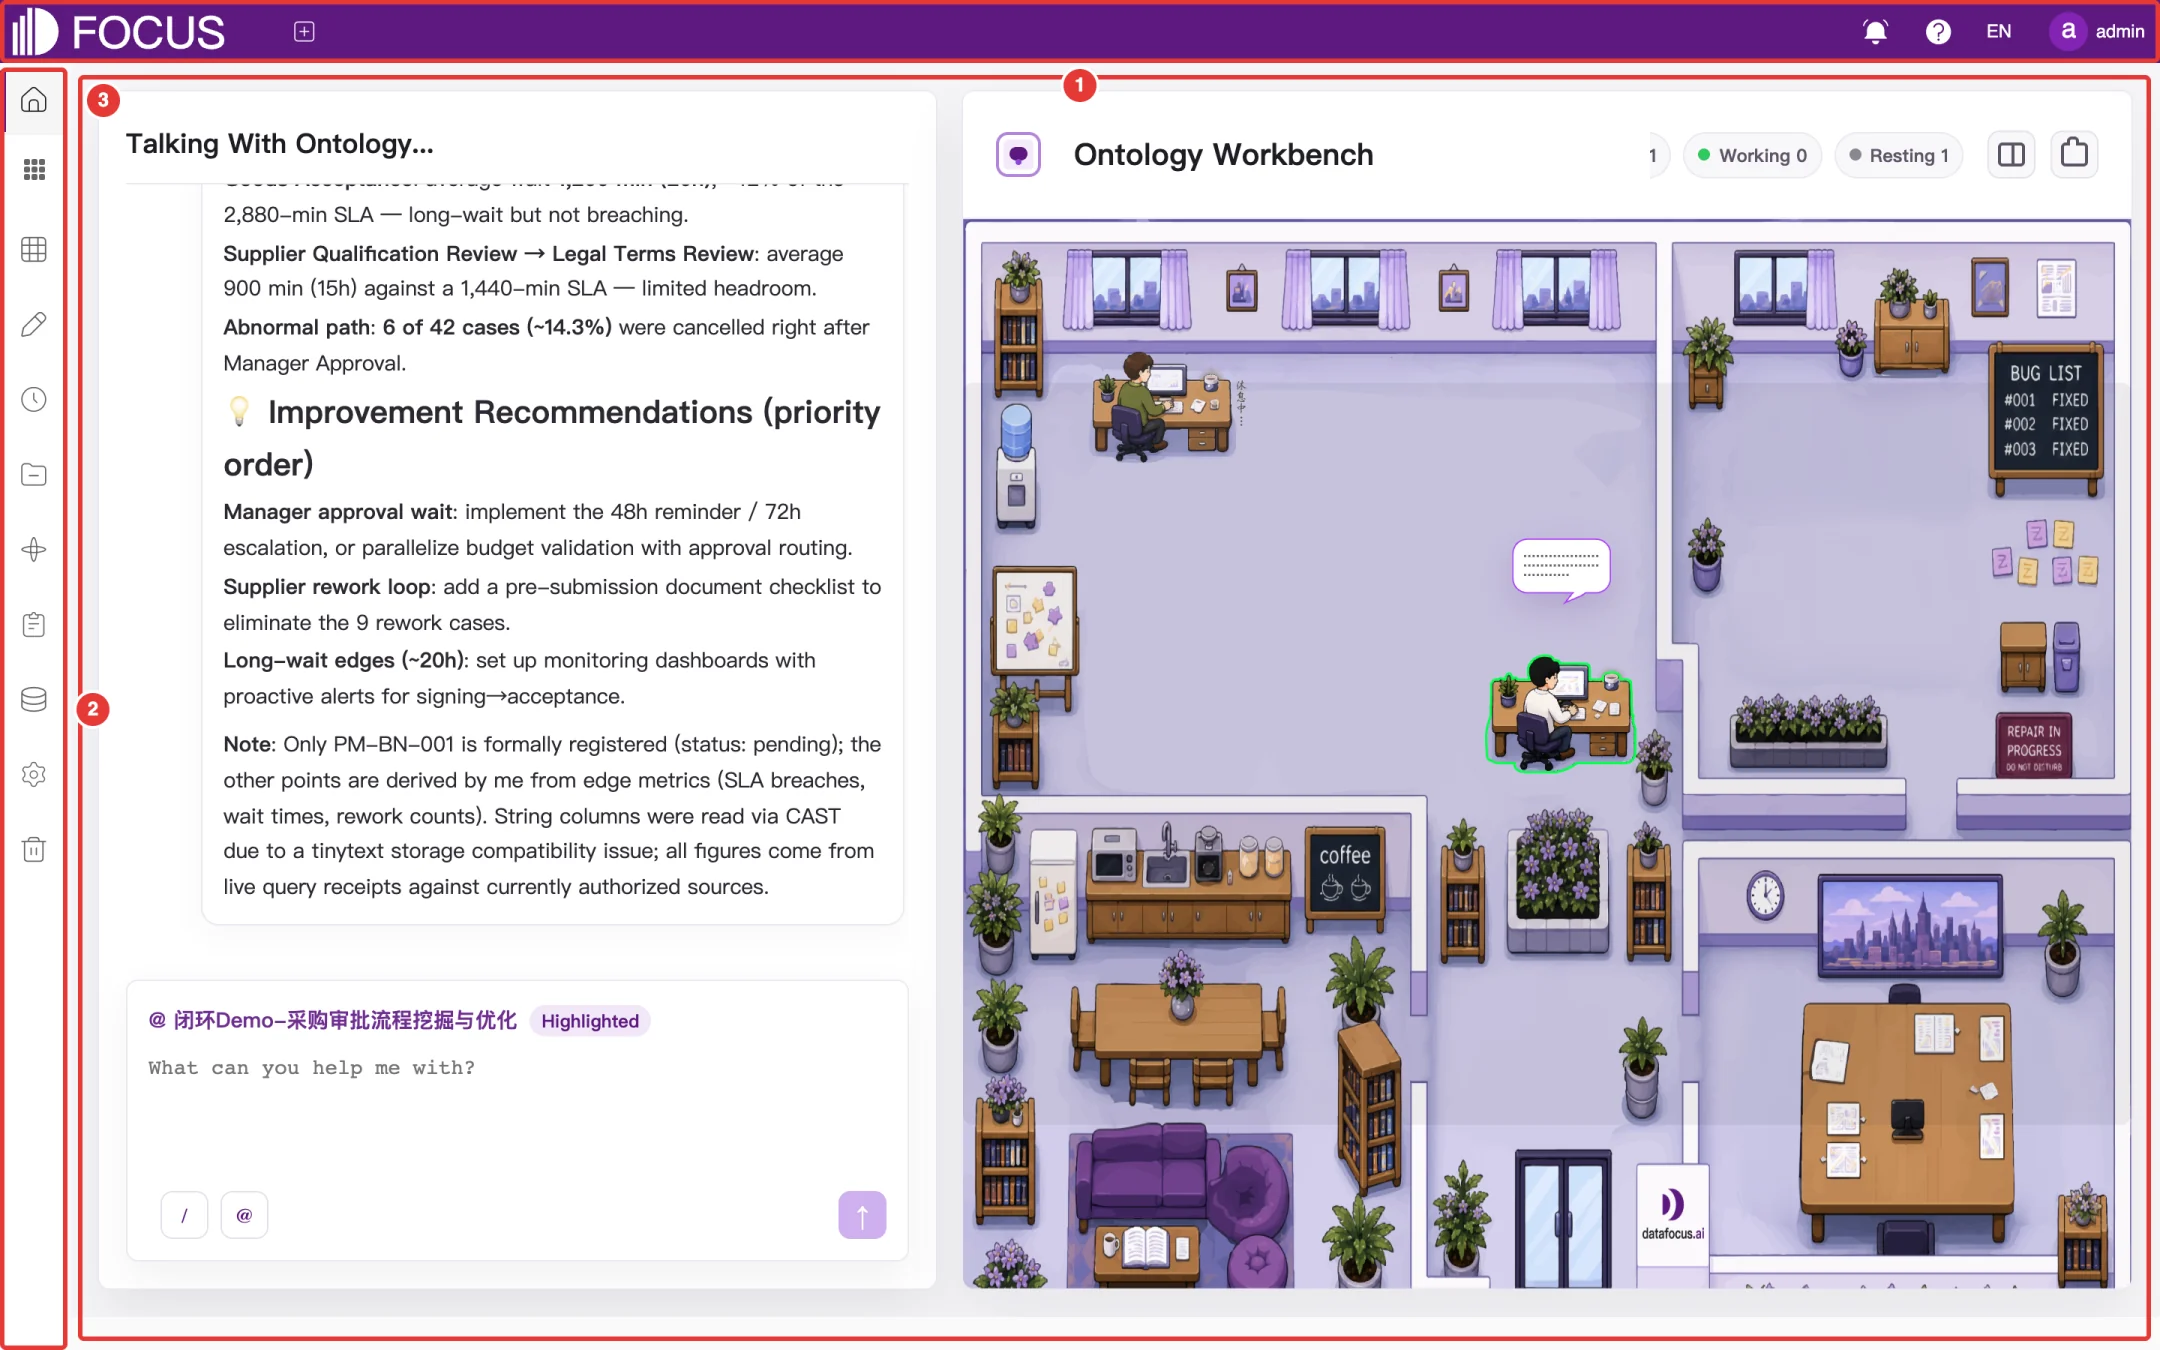
After you log in, the main interface has three areas, as shown in Figure 1-3:
① Top navigation bar: the product logo and the Navigator List button on the left; messages, help, language and the current user on the right.
② Left menu bar: entry points to all modules.
③ Workspace: shows the content of the current module.
Figure 1-3. Main interface layout
1.2.1Left menu bar
The left menu bar shows icons only; point to an icon to see the menu name. The menus are:
Menu
What it is for
See
Home
The Ontology Workbench, where you can talk to an ontology agent directly
Section 1.3
BI Workspace
Contains four submenus: Data Search, Smart Q&A, Answer History and Dashboards
Chapters 2–5
Tables
Import and maintain tables, datasets, formulas and external data sources
Chapter 6
Data Entry
Create data entry forms, then collect and manage the entered data
Chapter 7
Schedule Send
Send answers, pinboards and other content to WeCom, DingTalk or Feishu on a schedule
Chapter 8
Resource
Organize answers, pinboards, data apps and tables by project
Chapter 9
Ontology
Create ontologies and manage their agents, graphs, documents, indicators and control panels
Chapter 10
Logs
View the system's operation logs
Chapter 11
Data
View the data asset catalog and asset panorama, and manage data service APIs
Chapter 12
Admin
Users, roles, permissions and system settings
Chapter 13
Recycle
Restore or permanently delete pinboards, data apps and cards you have deleted
Chapter 14
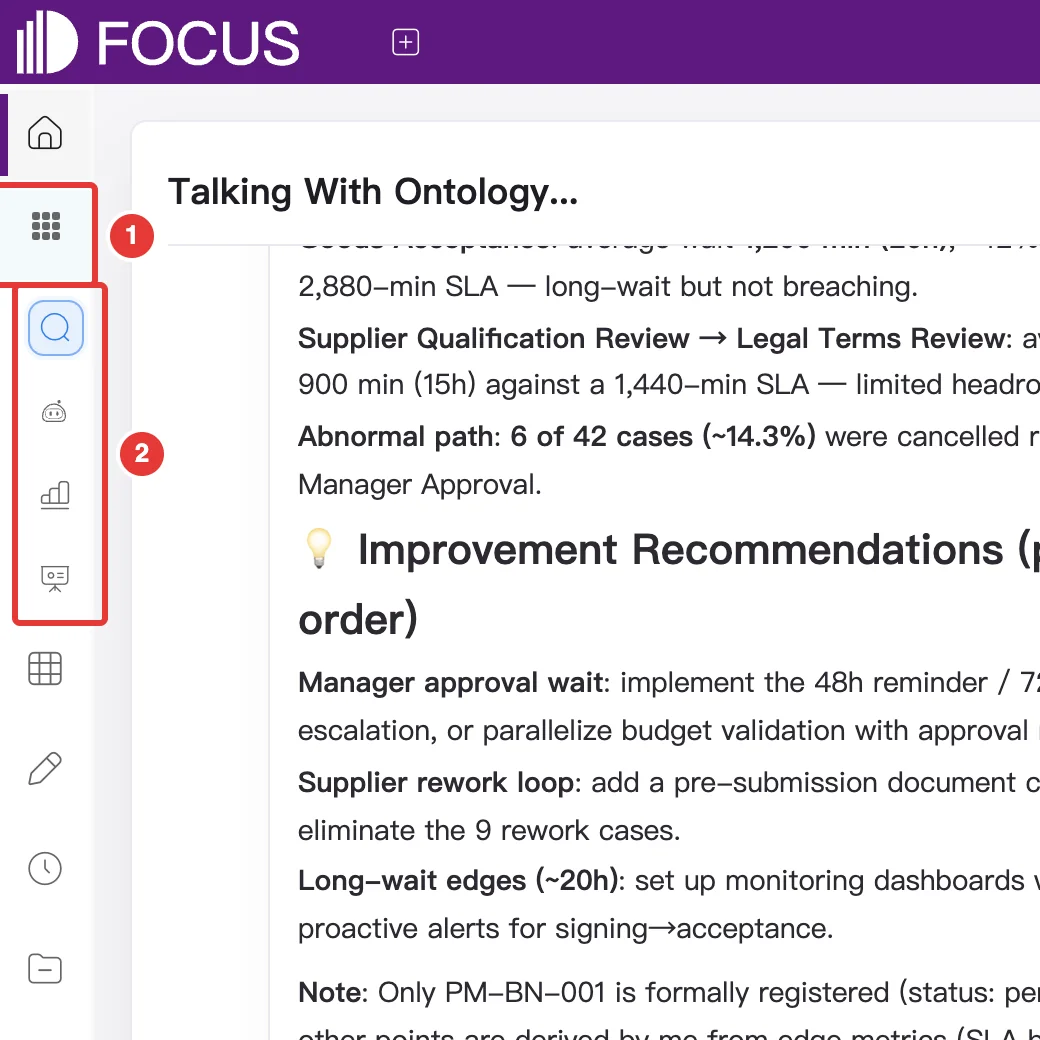
BI Workspace is a menu group. Click its icon at ① to expand it and show the four submenus at ②: from top to bottom, Data Search, Smart Q&A, Answer History and Dashboards, as shown in Figure 1-4. Click the icon again to collapse the group.
Figure 1-4. BI Workspace submenus
Note: The menus you see depend on the roles and permissions your administrator has assigned to your account. The screenshots in this manual were taken with a system administrator account.
1.2.2Top navigation bar
The buttons on the top navigation bar are shown in Figure 1-5:
Figure 1-5. Top navigation bar
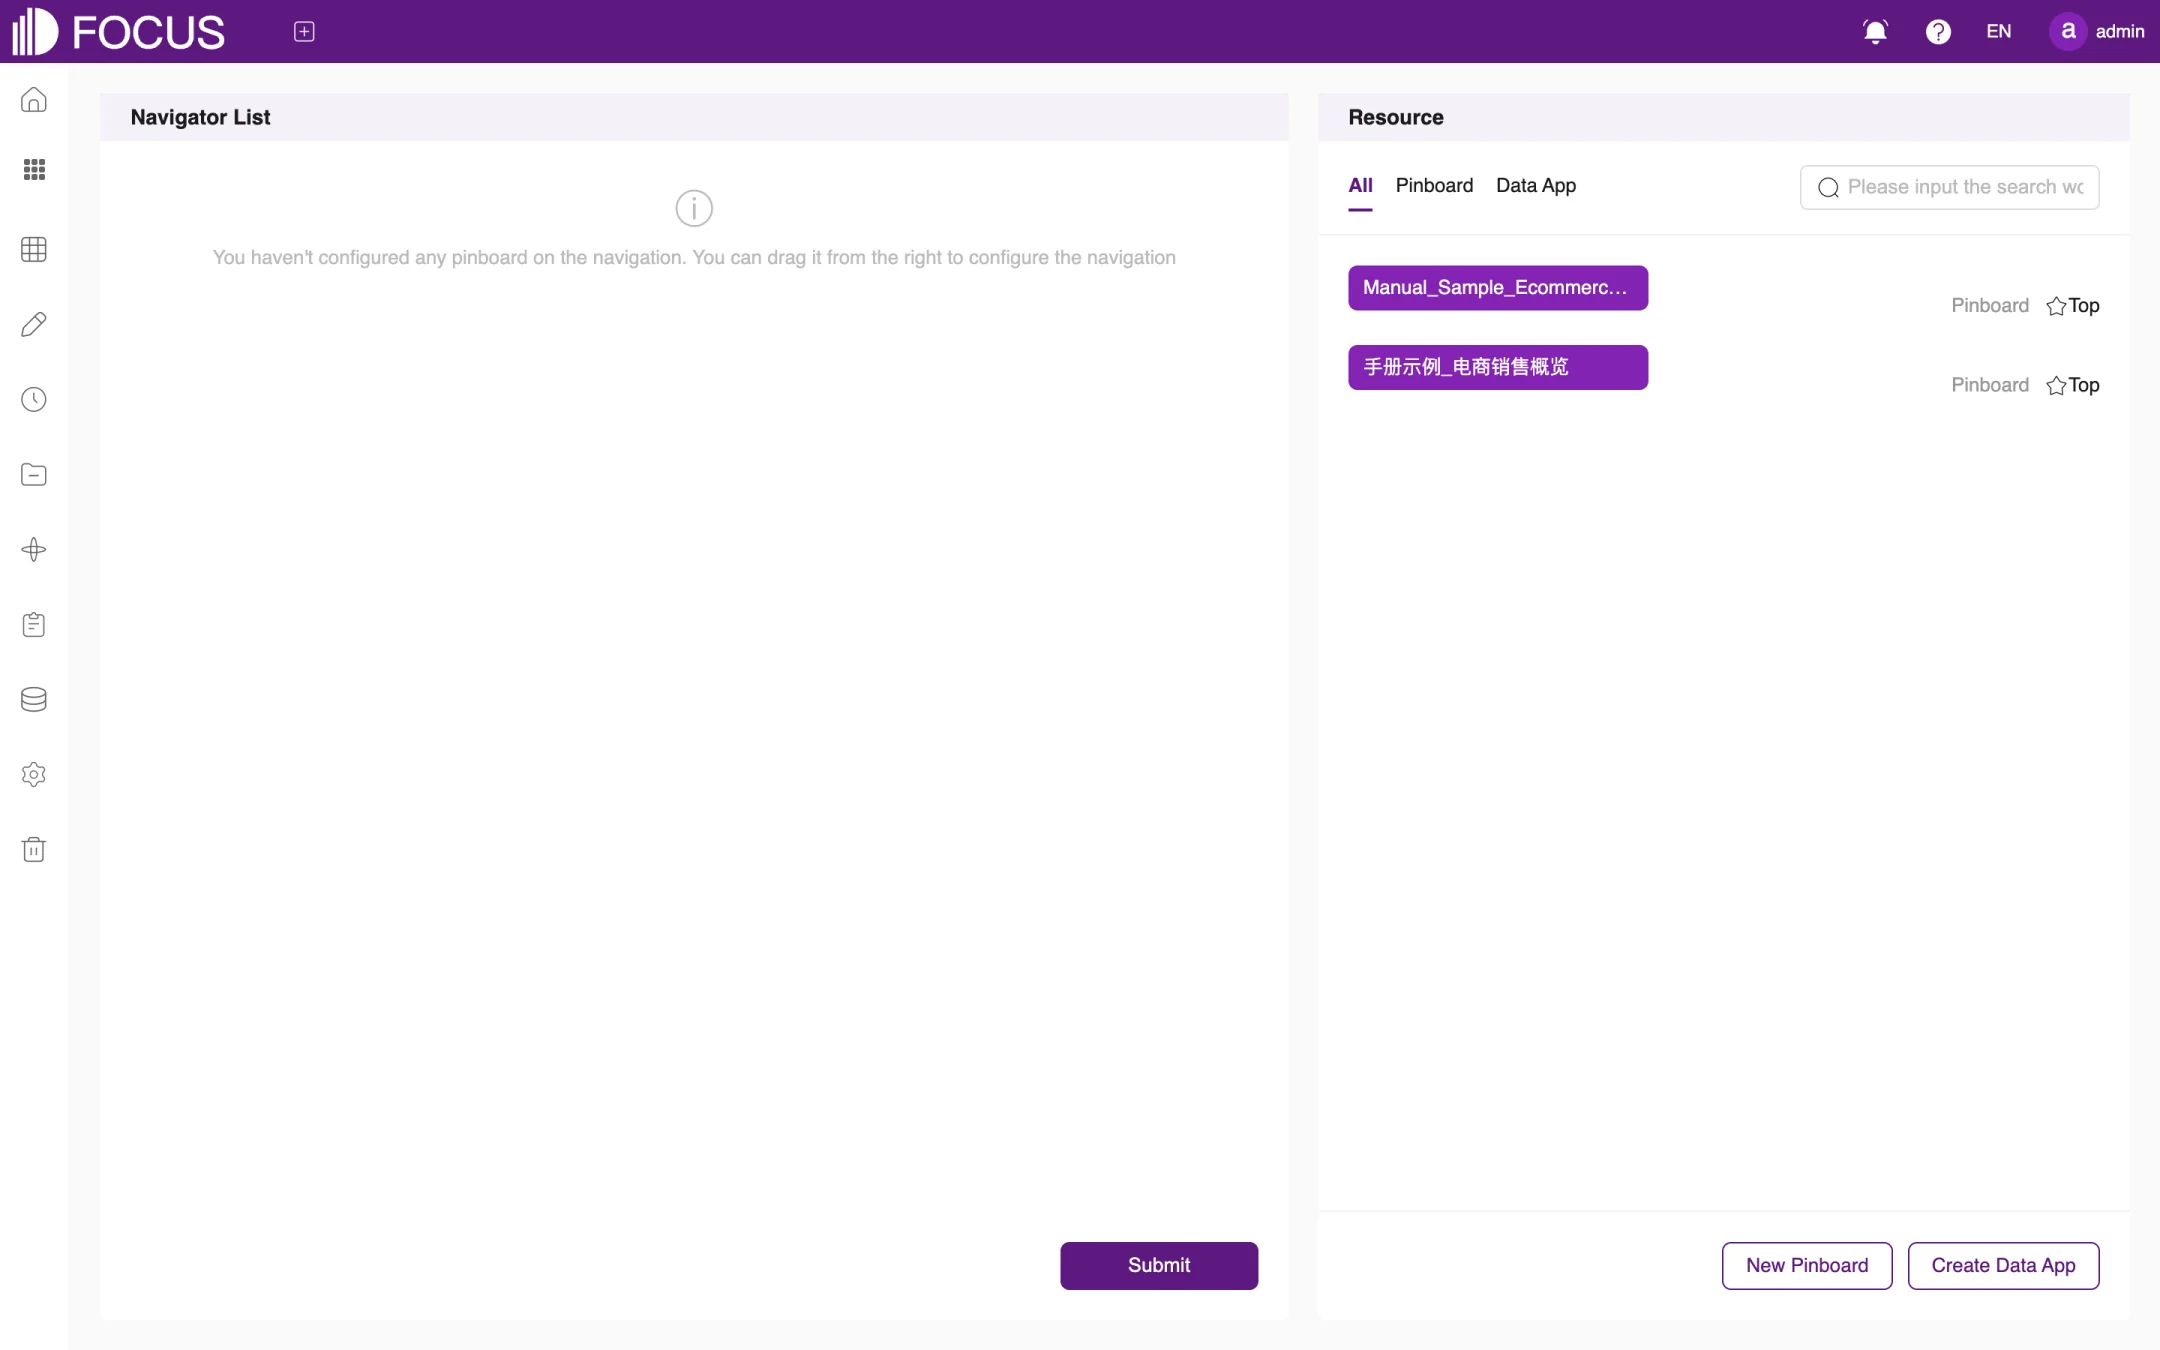
① Navigator List: sets which pinboards and data apps appear in the navigation. Click it to open the Navigator List page, as shown in Figure 1-6. The left side lists the items already in the navigation, and the right side (Resource) lists the available pinboards and data apps. Drag the ones you want to the left, then click Submit.
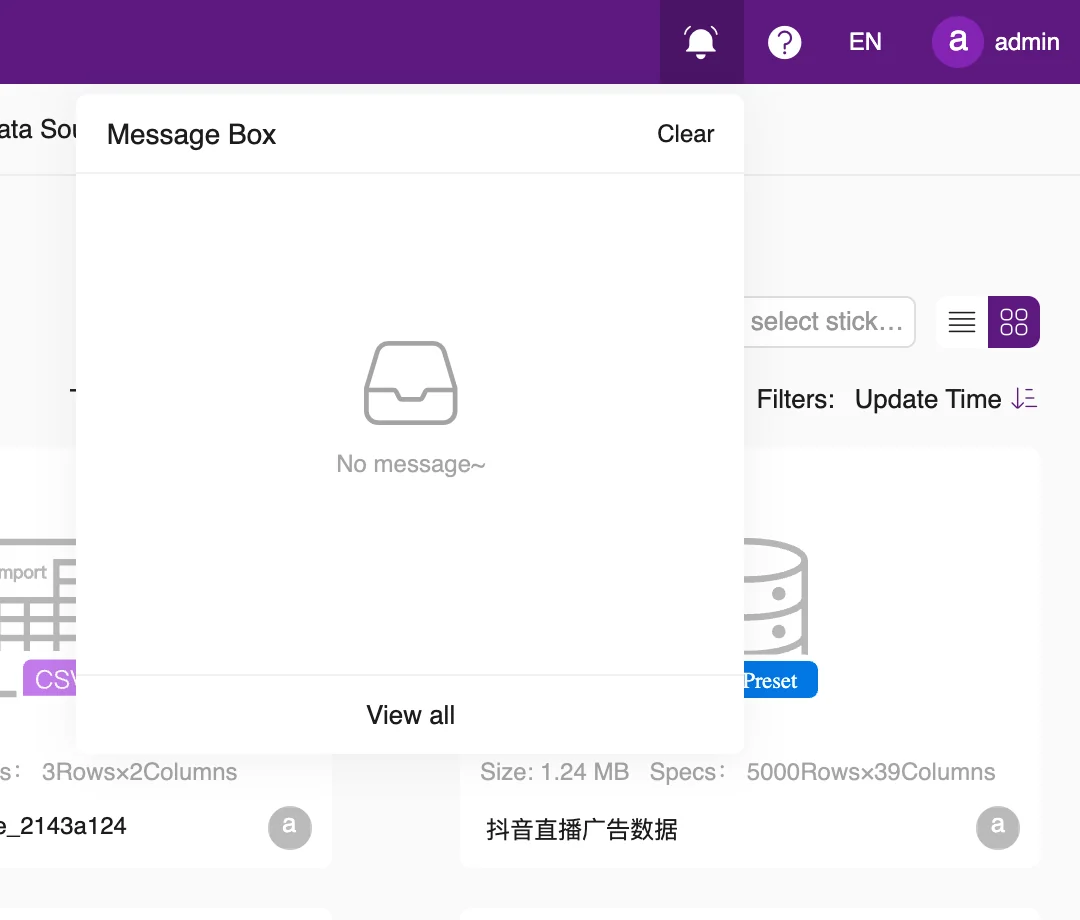
② Message Box: shows recent system messages, as shown in Figure 1-7. Click Clear to clear the messages, or View all to open the notification page.
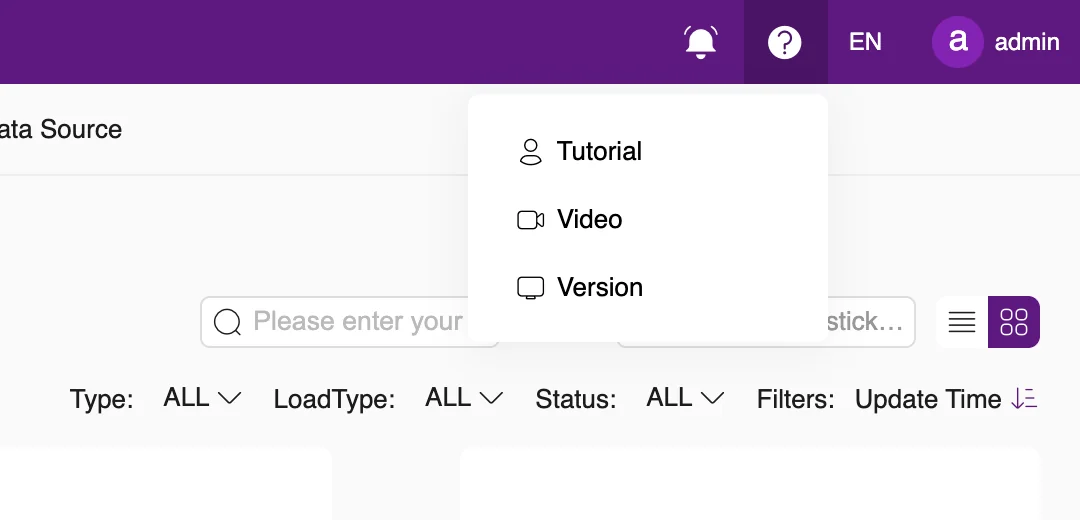
③ Help: links to the user manual (Tutorial) and to tutorial videos (Video), plus the Version information, as shown in Figure 1-8.
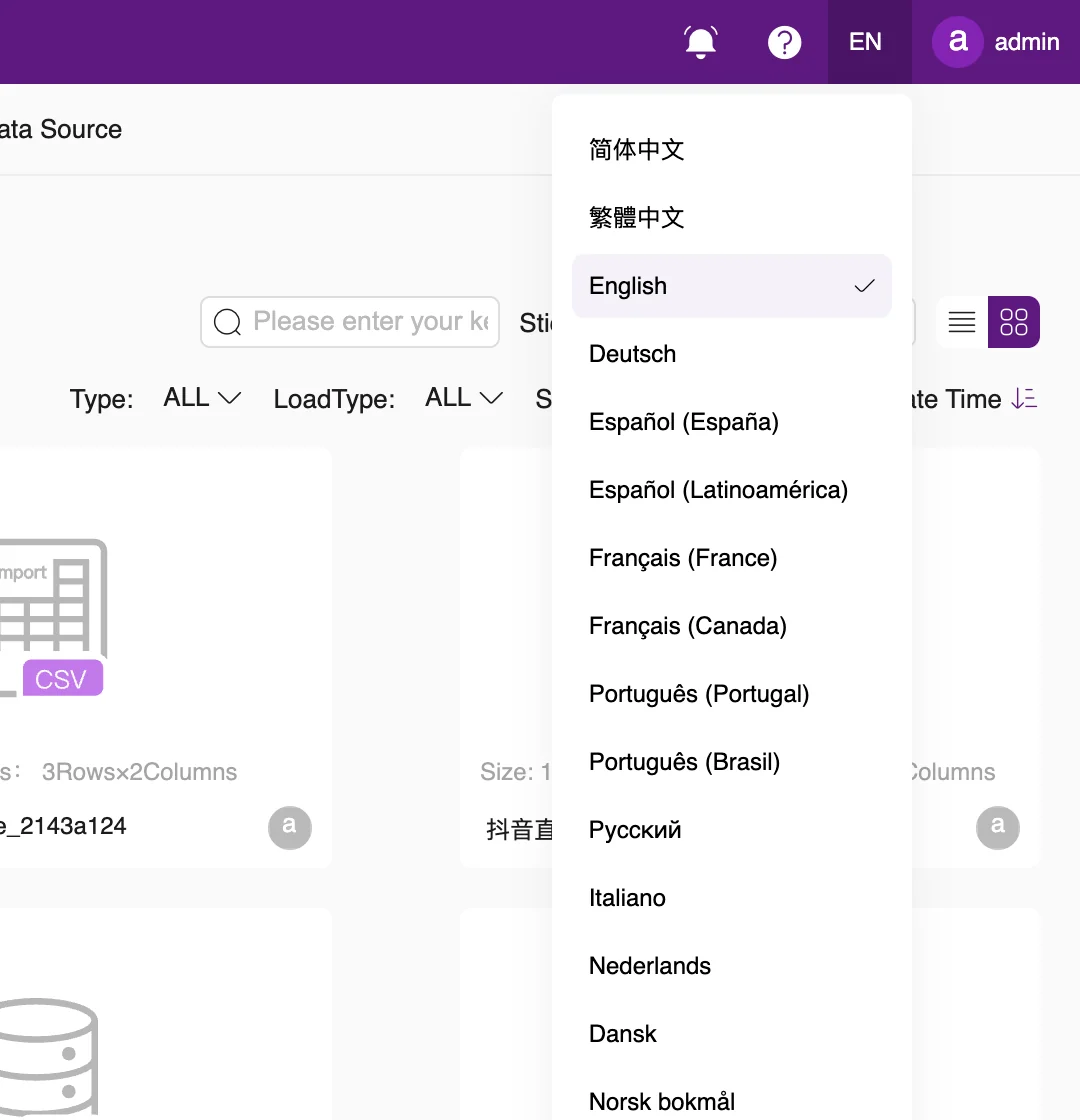
④ Language: selects the interface language, as shown in Figure 1-9. The product supports 21 interface languages, including Simplified Chinese, Traditional Chinese, English, Japanese and Korean.
⑤ Current user: click your username to open the user menu, as shown in Figure 1-10. It contains ① User information, ② Notification and ③ Logout.
Figure 1-6. Navigator ListFigure 1-7. Message BoxFigure 1-8. Help menuFigure 1-9. Language selectionFigure 1-10. User menu
1.2.3User information
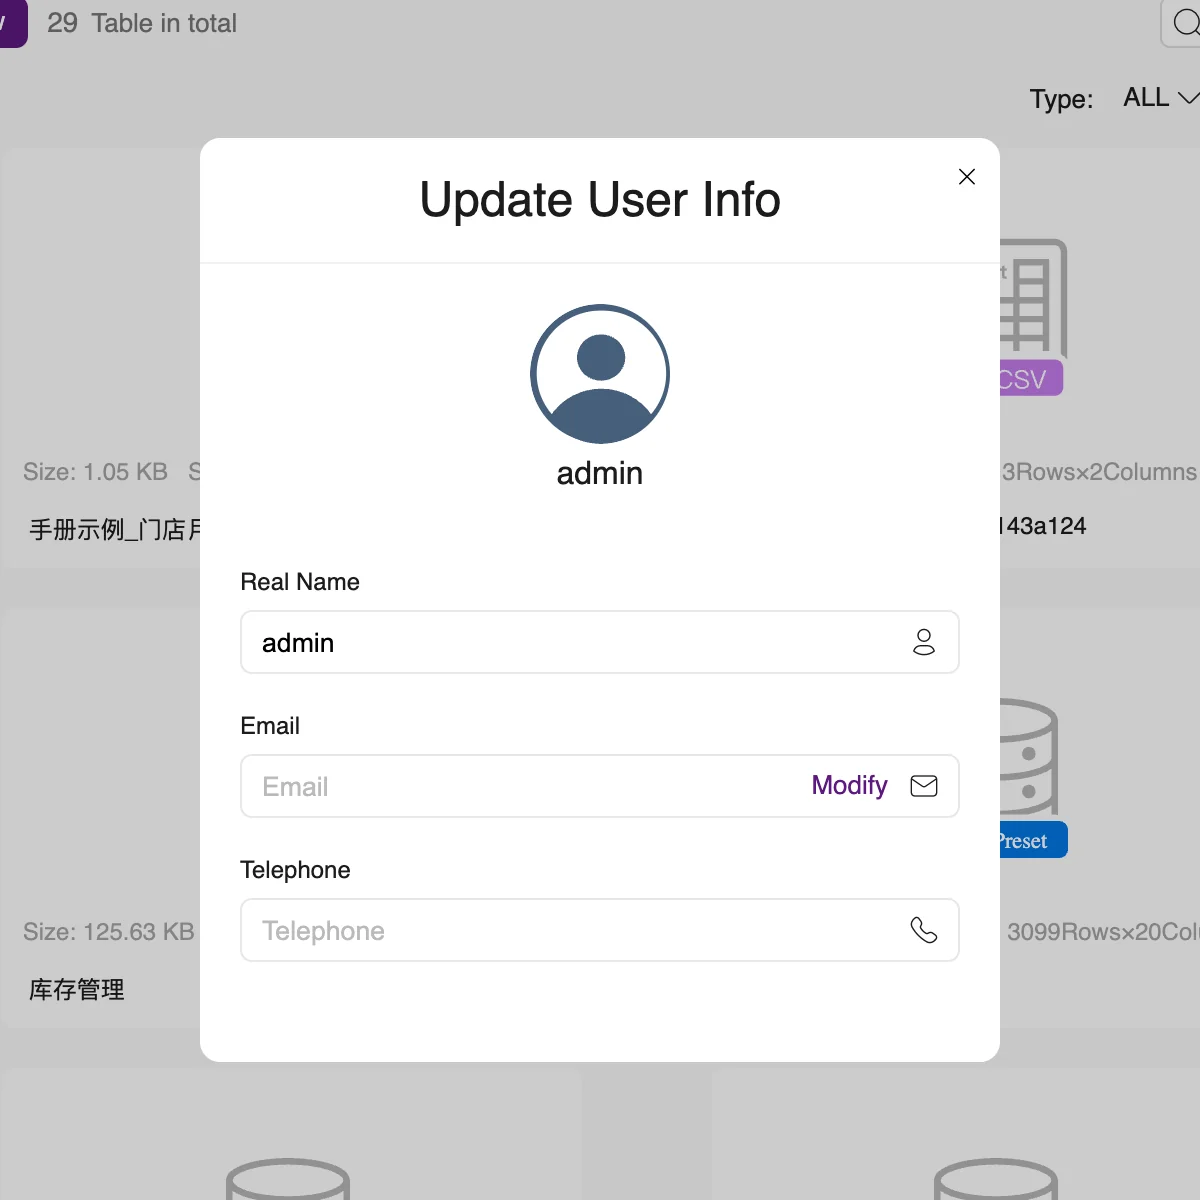
In the user menu, click User information to open the Update User Info dialog, as shown in Figure 1-11. Here you can:
upload a new avatar using the change link below your avatar;
change your Real Name;
click Modify in the Email field to change your email address;
enter your Telephone number.
Figure 1-11. Update User Info
1.2.4Notifications
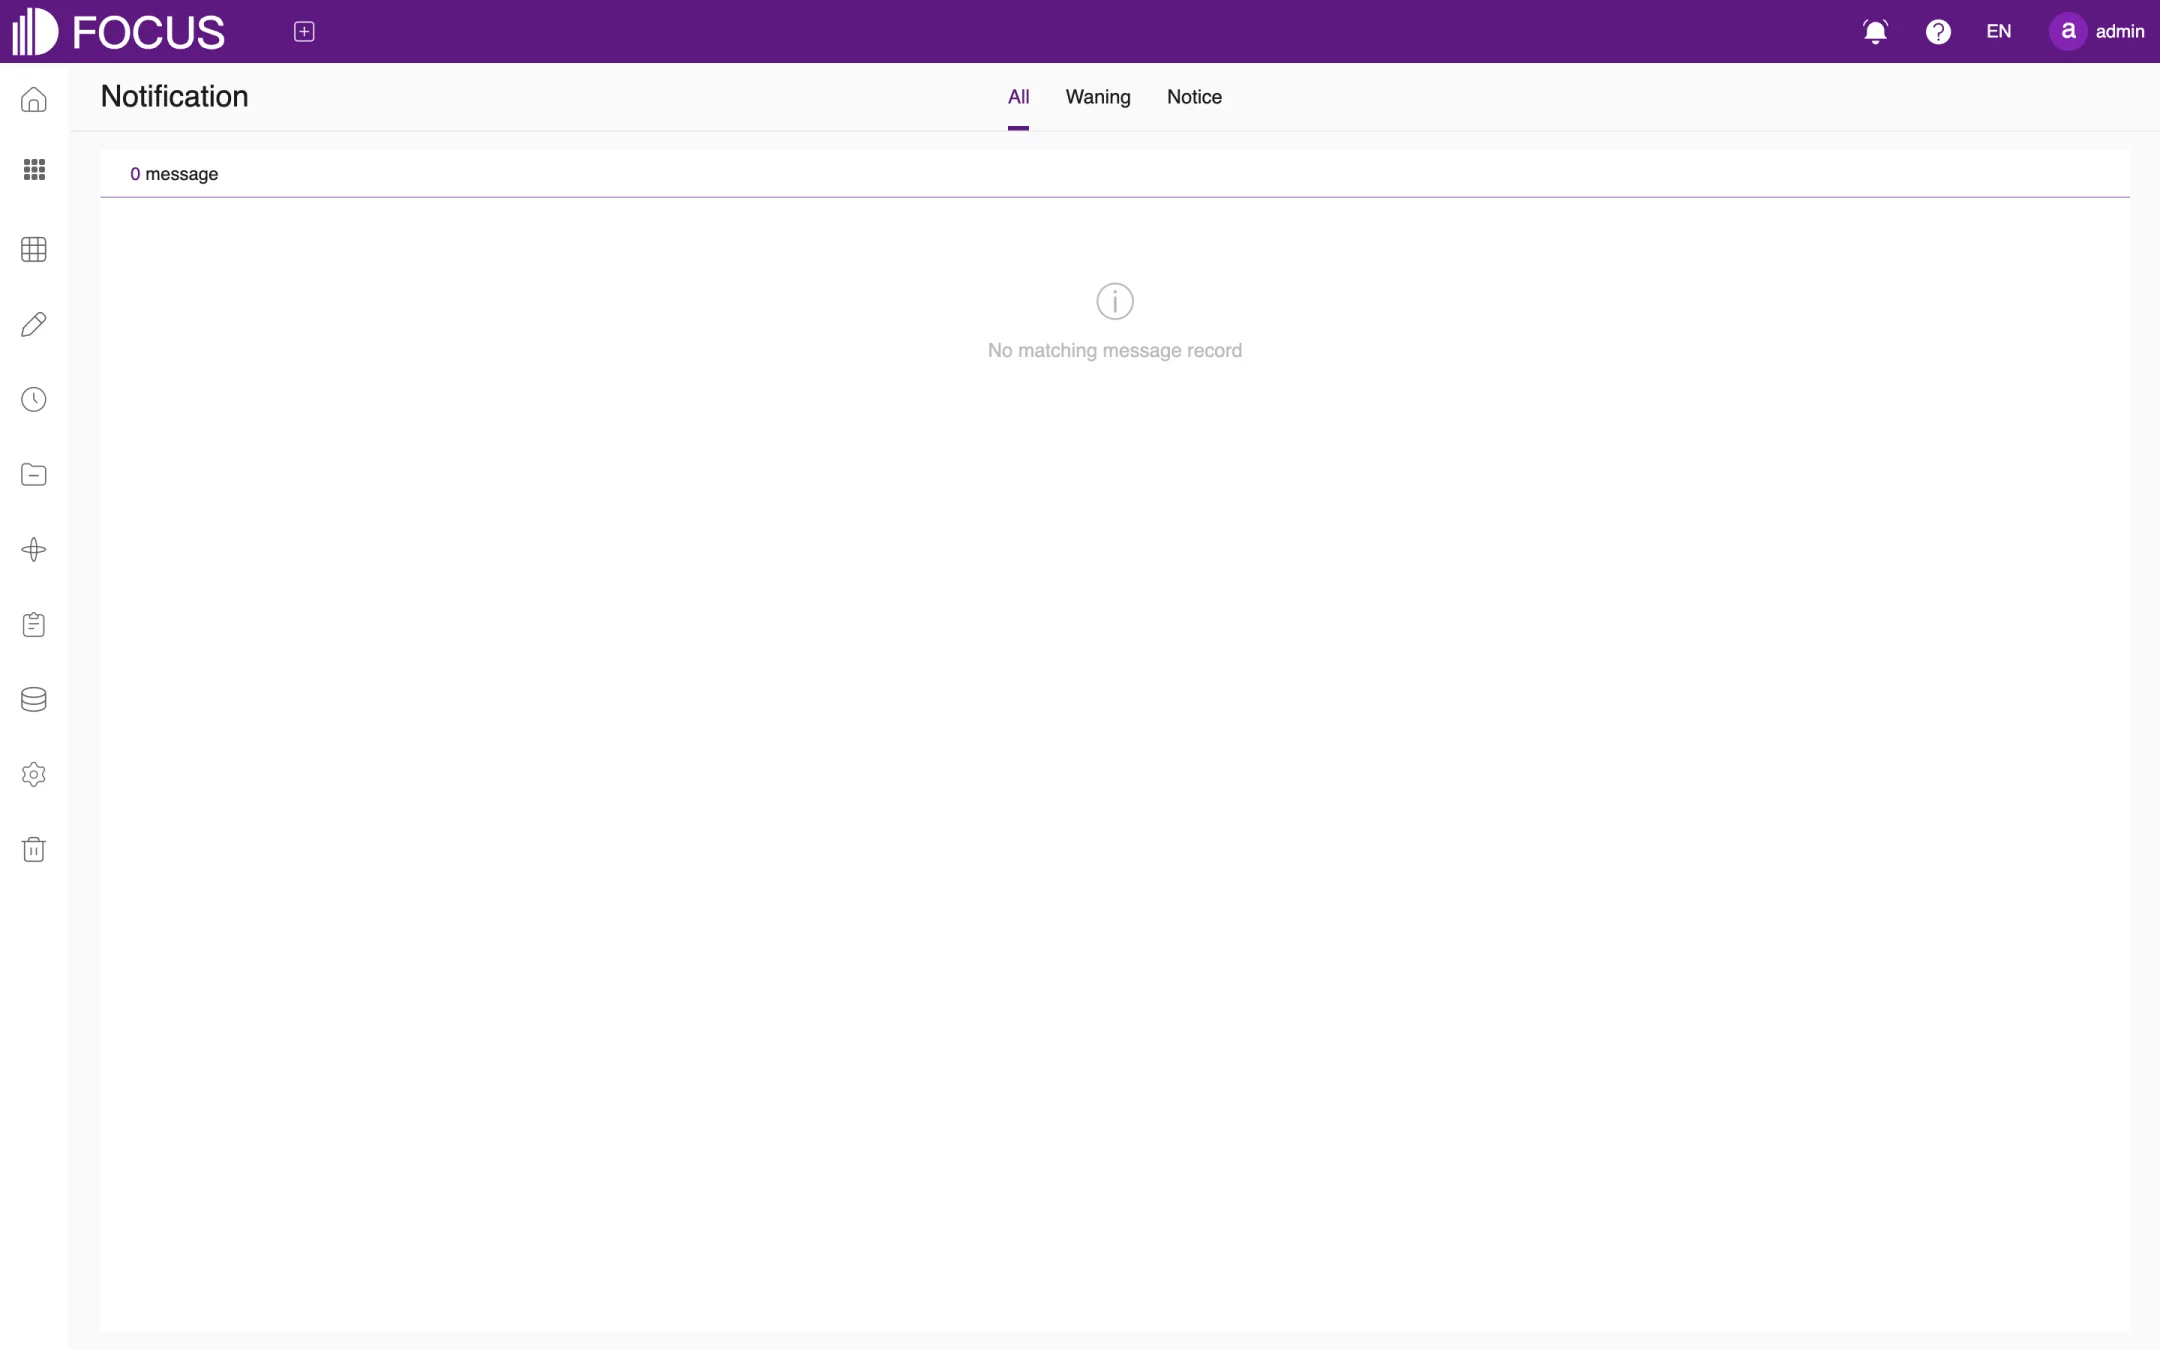
In the user menu, click Notification, or click View all in the Message Box, to open the Notification page, as shown in Figure 1-12. Use the All, Waning (warnings) and Notice tabs at the top to filter messages by type.
Figure 1-12. Notification page
1.3Home
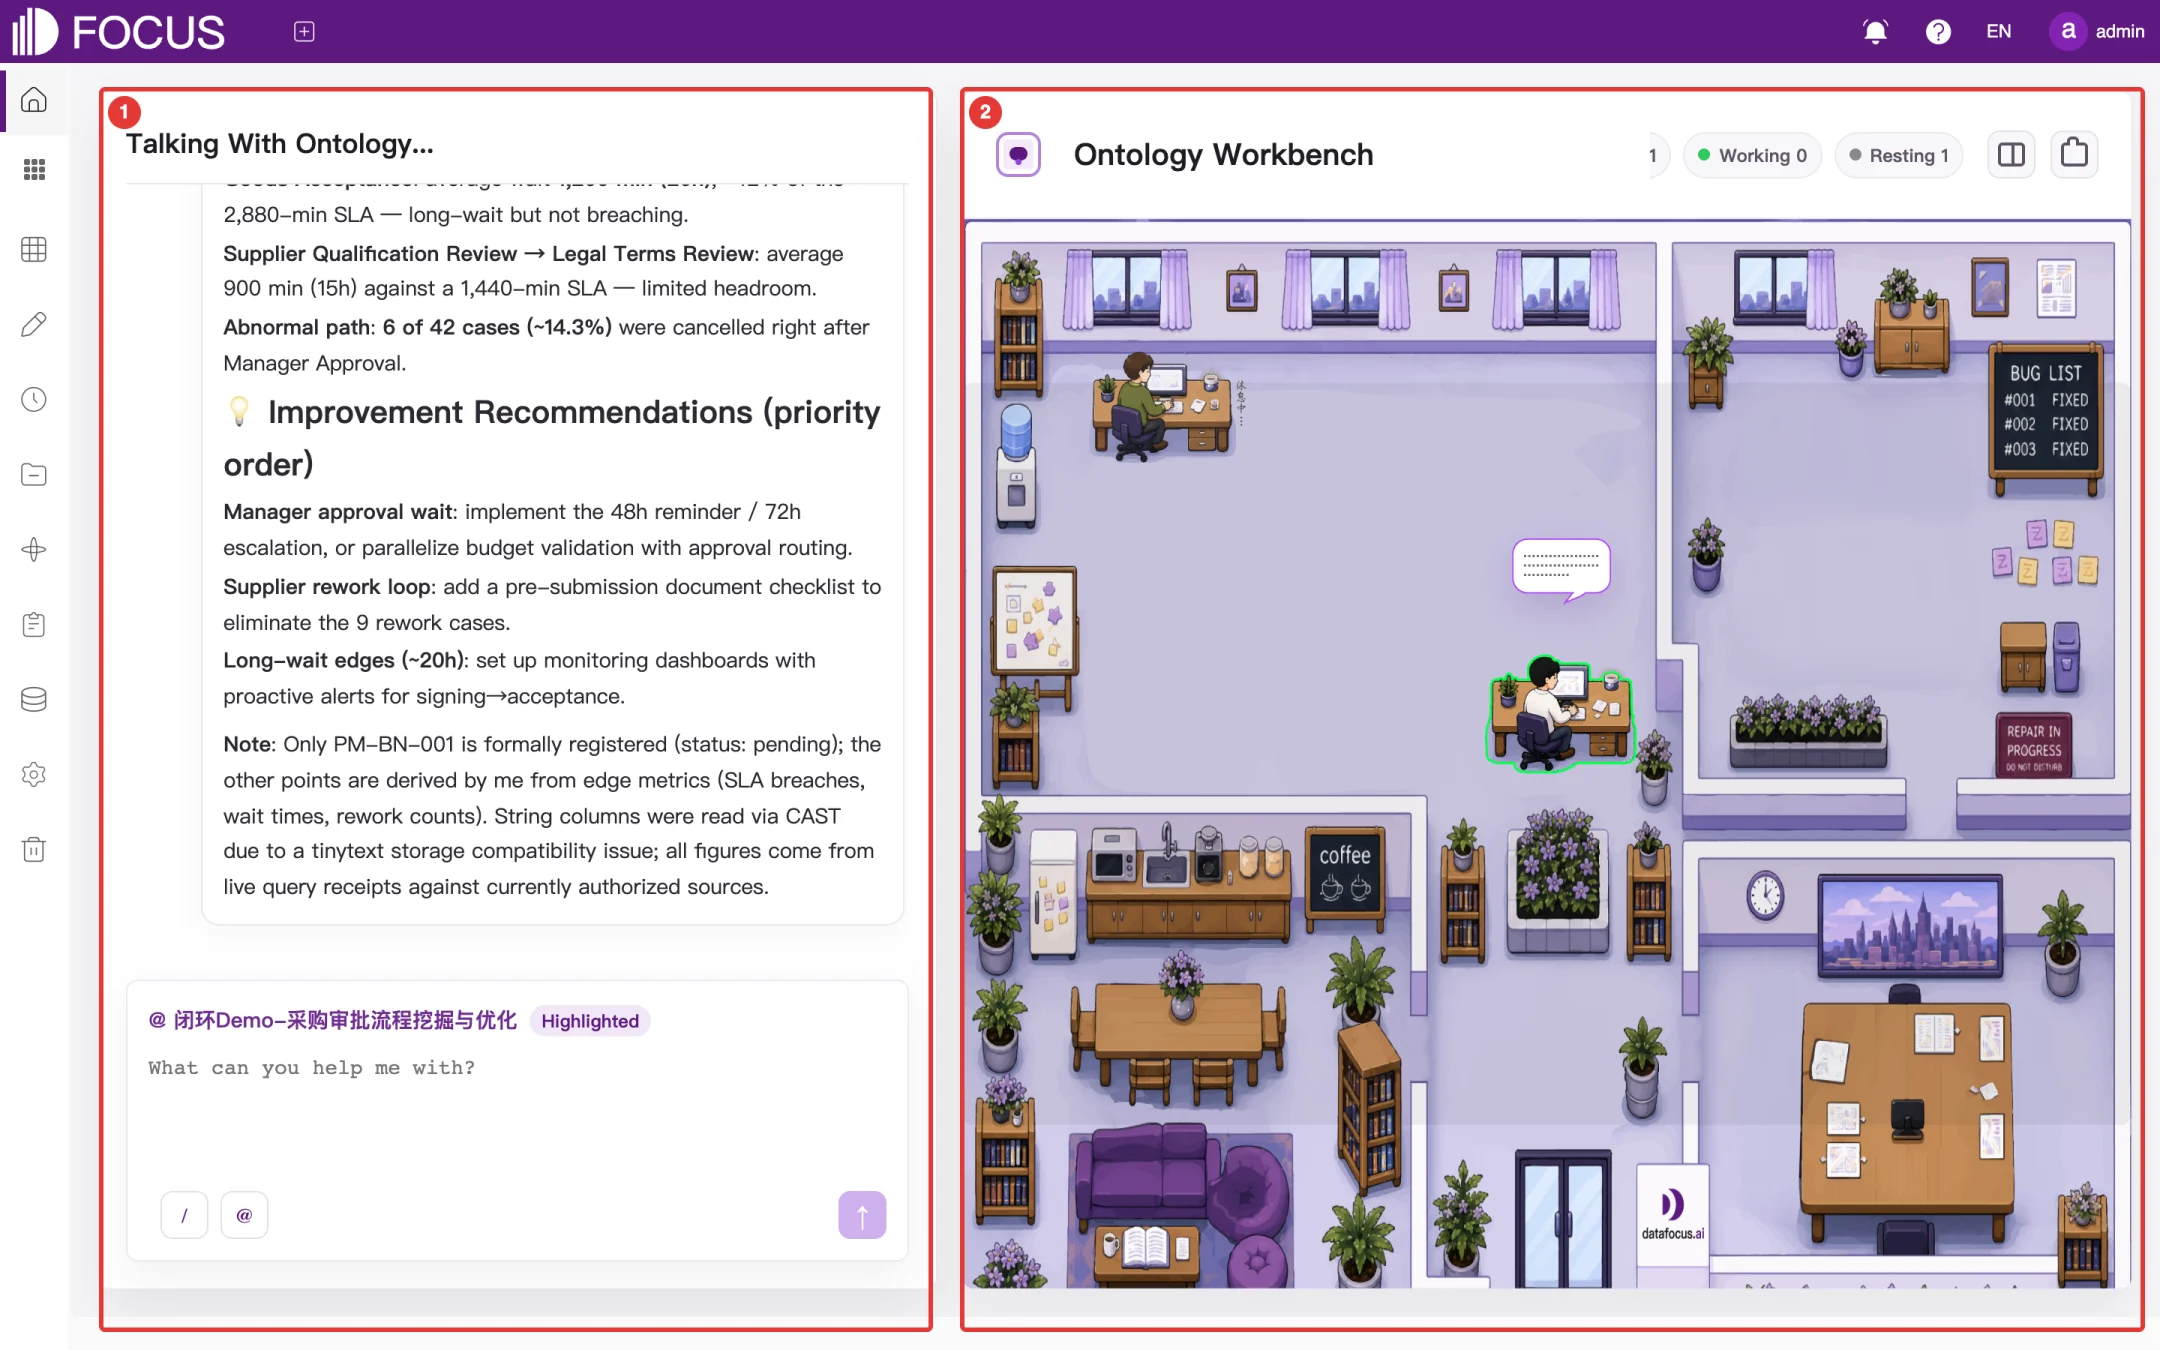
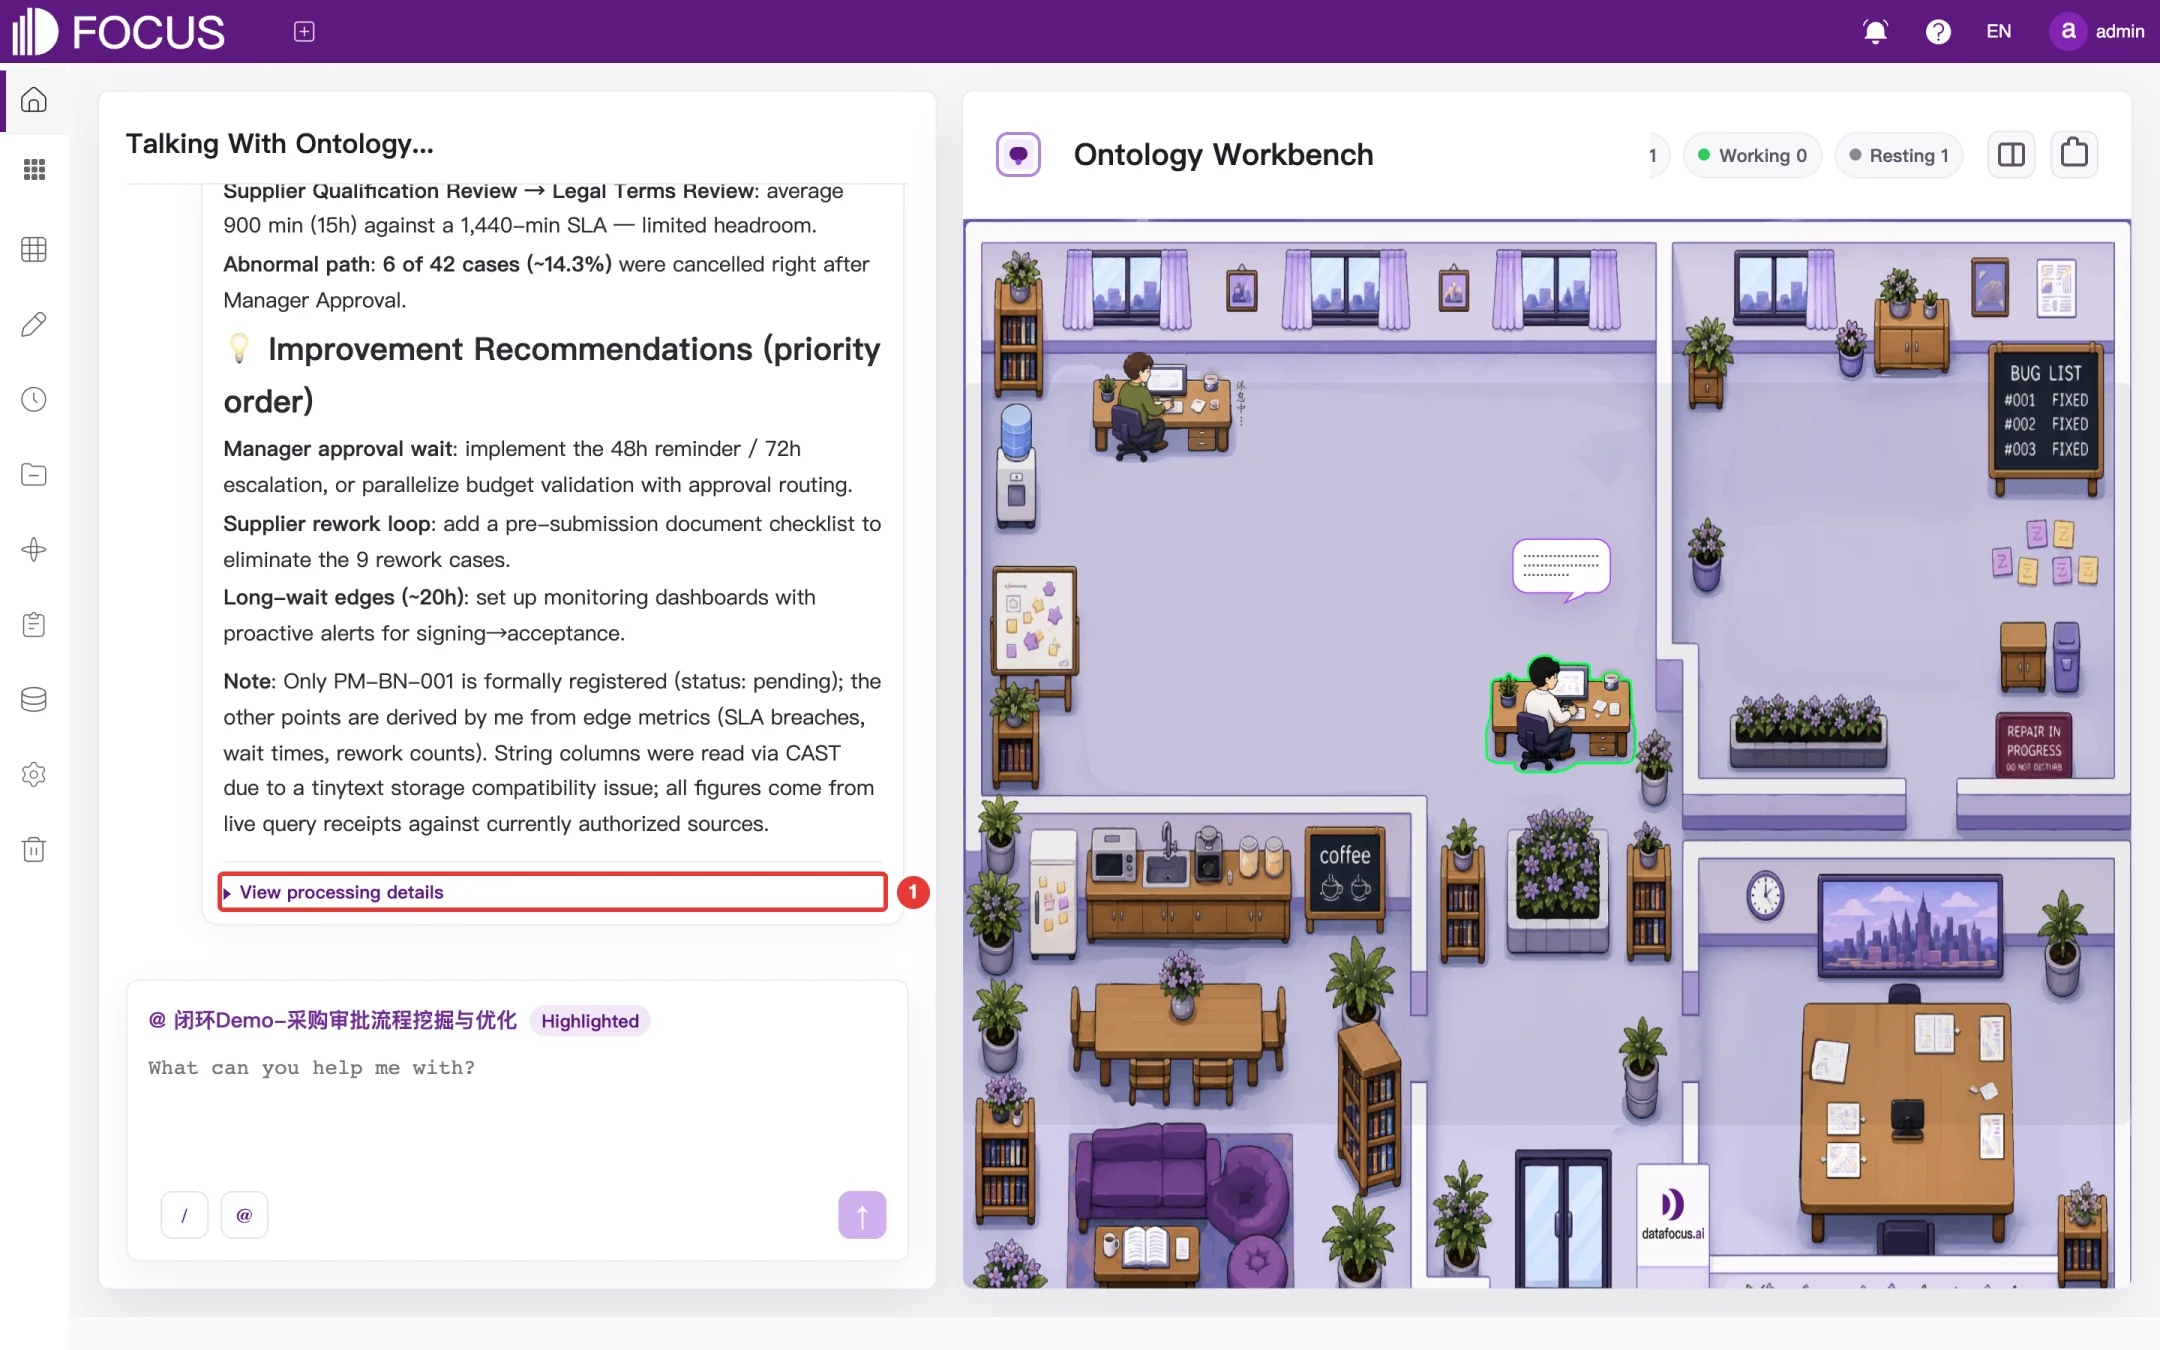
Click the Home icon in the left menu bar to open the Ontology Workbench, as shown in Figure 1-13. The page has two parts:
① Talking With Ontology: ask questions to the agent of the current ontology. The "@ ontology name" tag above the input box shows which ontology you are talking to.
② Ontology Workbench: shows the status of each ontology agent as an office scene. The counts at the top show how many agents are highlighted, Working and Resting. Of the two icons in the top-right corner, the knowledge base icon opens the Ontology Graph of the current ontology, and the folder icon opens its Document Center.
Figure 1-13. Ontology Workbench on the home page
Note: The ontology in these figures is the built-in demo ontology 闭环Demo-采购审批流程挖掘与优化 (closed-loop demo – purchase approval process mining and optimization). The system's built-in demo data, such as this ontology and the preset demo tables, appear in Chinese even in the English interface.
1.3.1Talking with an ontology
Type a question in the input box on the left, for example What are the bottlenecks in the current purchase approval process?.
Press Enter or click the send button in the bottom-right corner of the input box.
The agent shows its processing steps and then gives its answer. Data cited in the answer comes from the tables and documents bound to the ontology.
Click View processing details below the answer (① in Figure 1-14) to see which data the agent queried and which tools it called.
Figure 1-14. Answer from the ontology agent
Note: Ontology agents can be used only after an administrator has configured a large language model service in the system. An answer usually takes tens of seconds; the more complex the question, the longer it takes. For creating and maintaining ontologies, see Chapter 10.
Chapter 2Data Search
Data Search is the most frequently used feature of OT Flash. After you choose a table, type column names and keywords in the search box, and the system calculates the result immediately and picks a suitable chart. For example, typing Sales by Region gives a chart of total sales for each region. You can switch the chart type and adjust its settings, save the result as an answer, or add it to a pinboard.
In the left menu bar, expand BI Workspace and click Data Search to open this page.
2.1Choosing a table
Before you search, choose the data source.
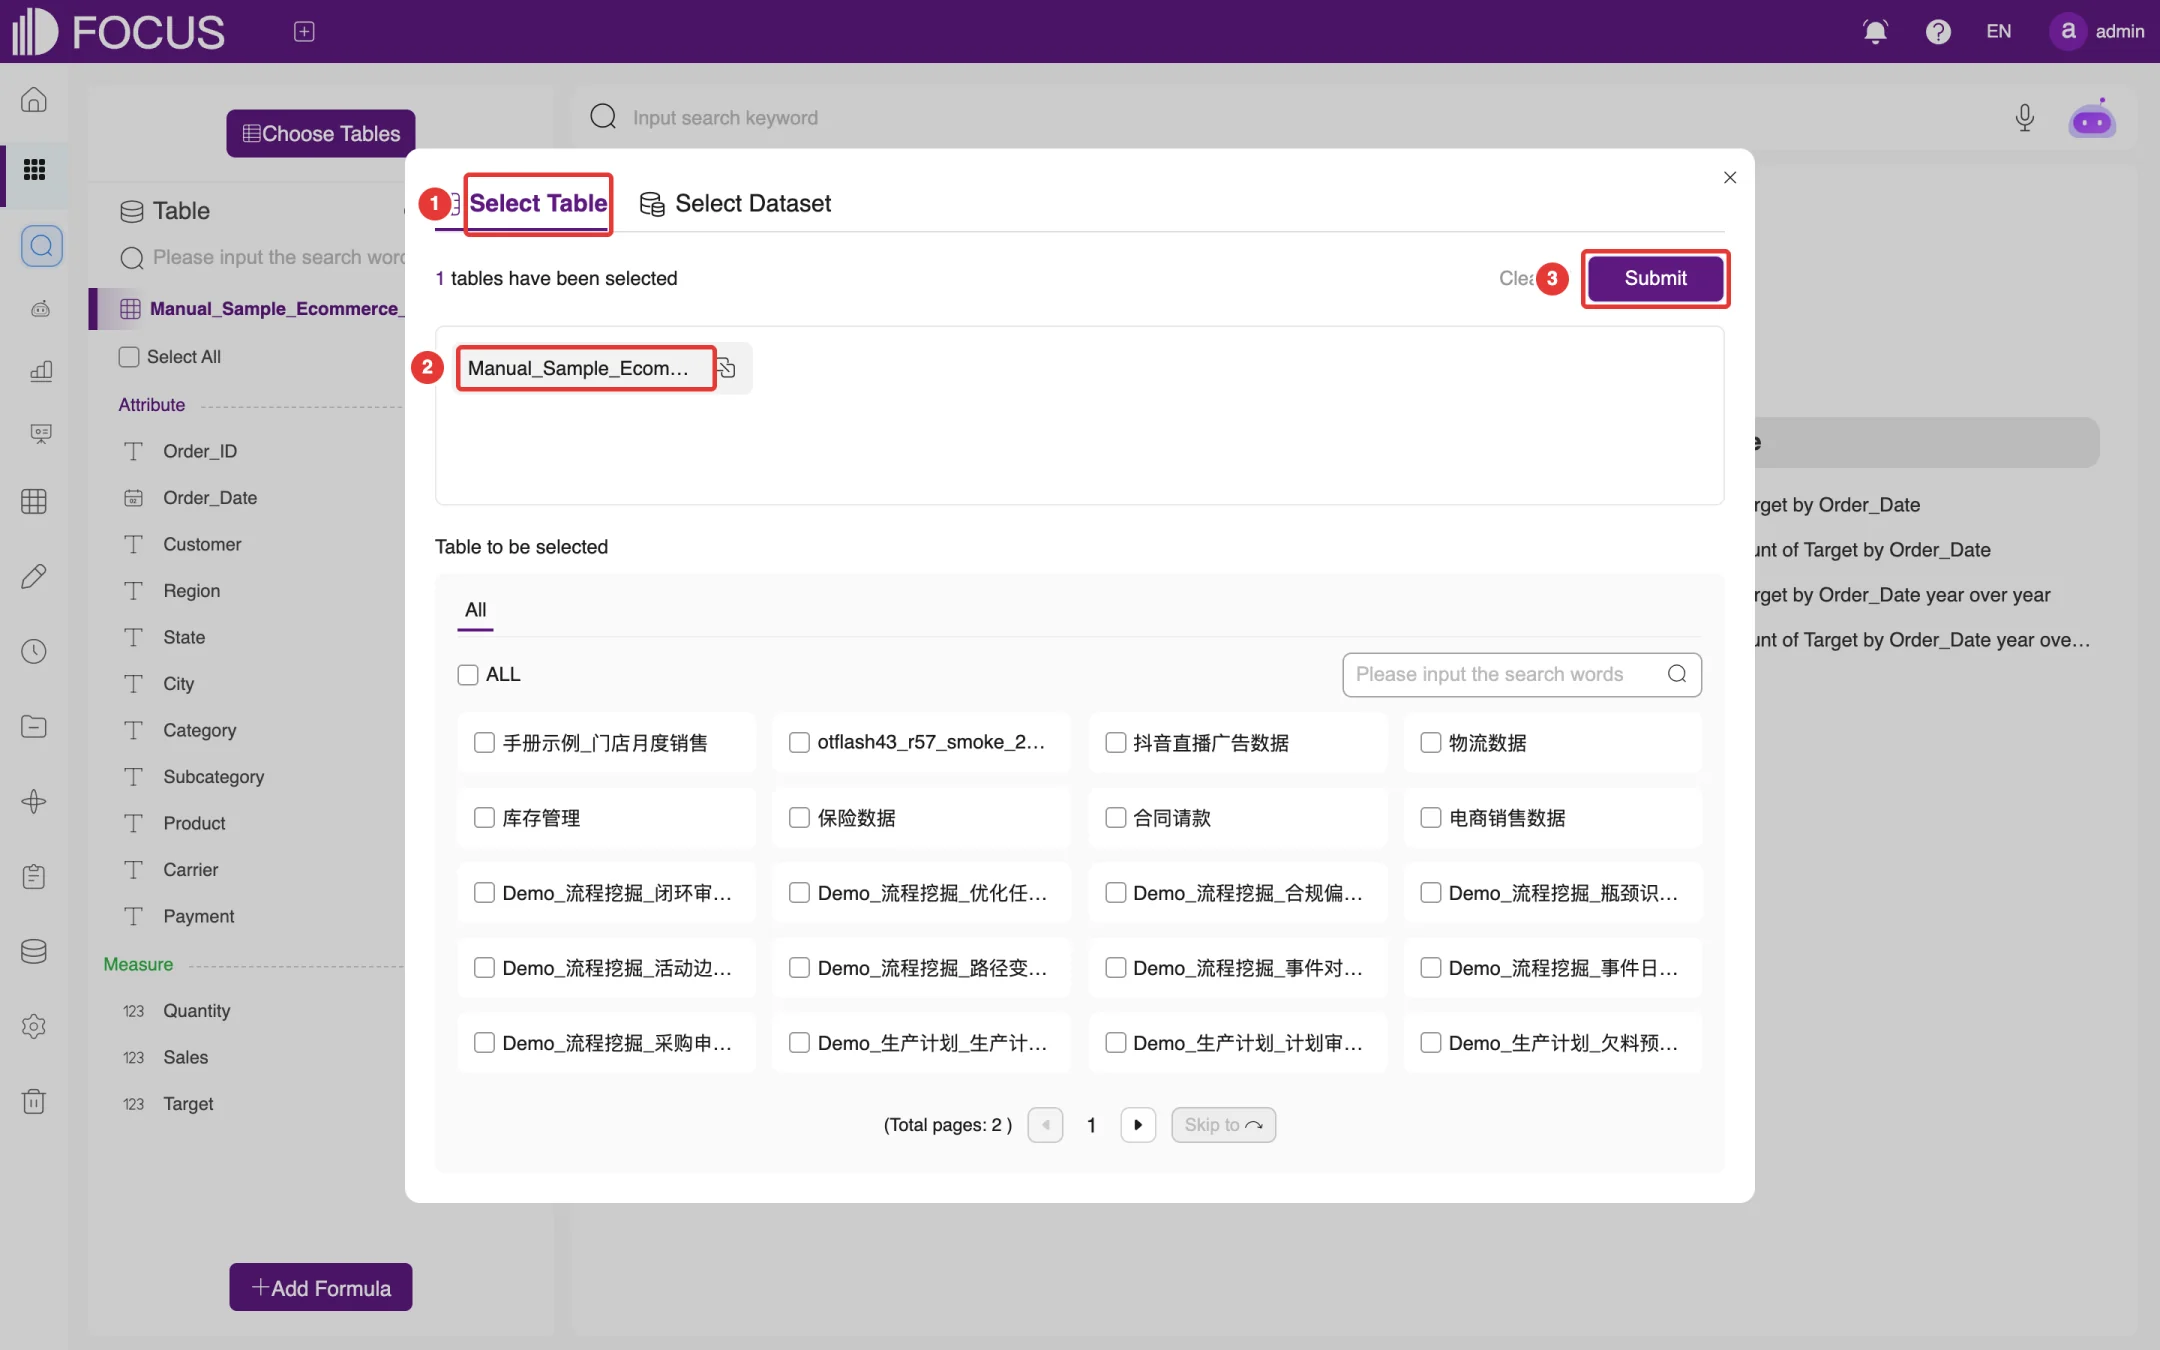
Click Choose Tables at the top left of the page to open the selection dialog, as shown in Figure 2-1.
On the Select Table tab at ①, check the table you want to use, for example Manual_Sample_Ecommerce_Sales. If the table is not on the first page, find it with the search box or page through the list. Selected tables appear in the area at the top, marked ②. To choose from a dataset you have already built, switch to the Select Dataset tab.
Click Submit at ③.
Figure 2-1. Choosing a table
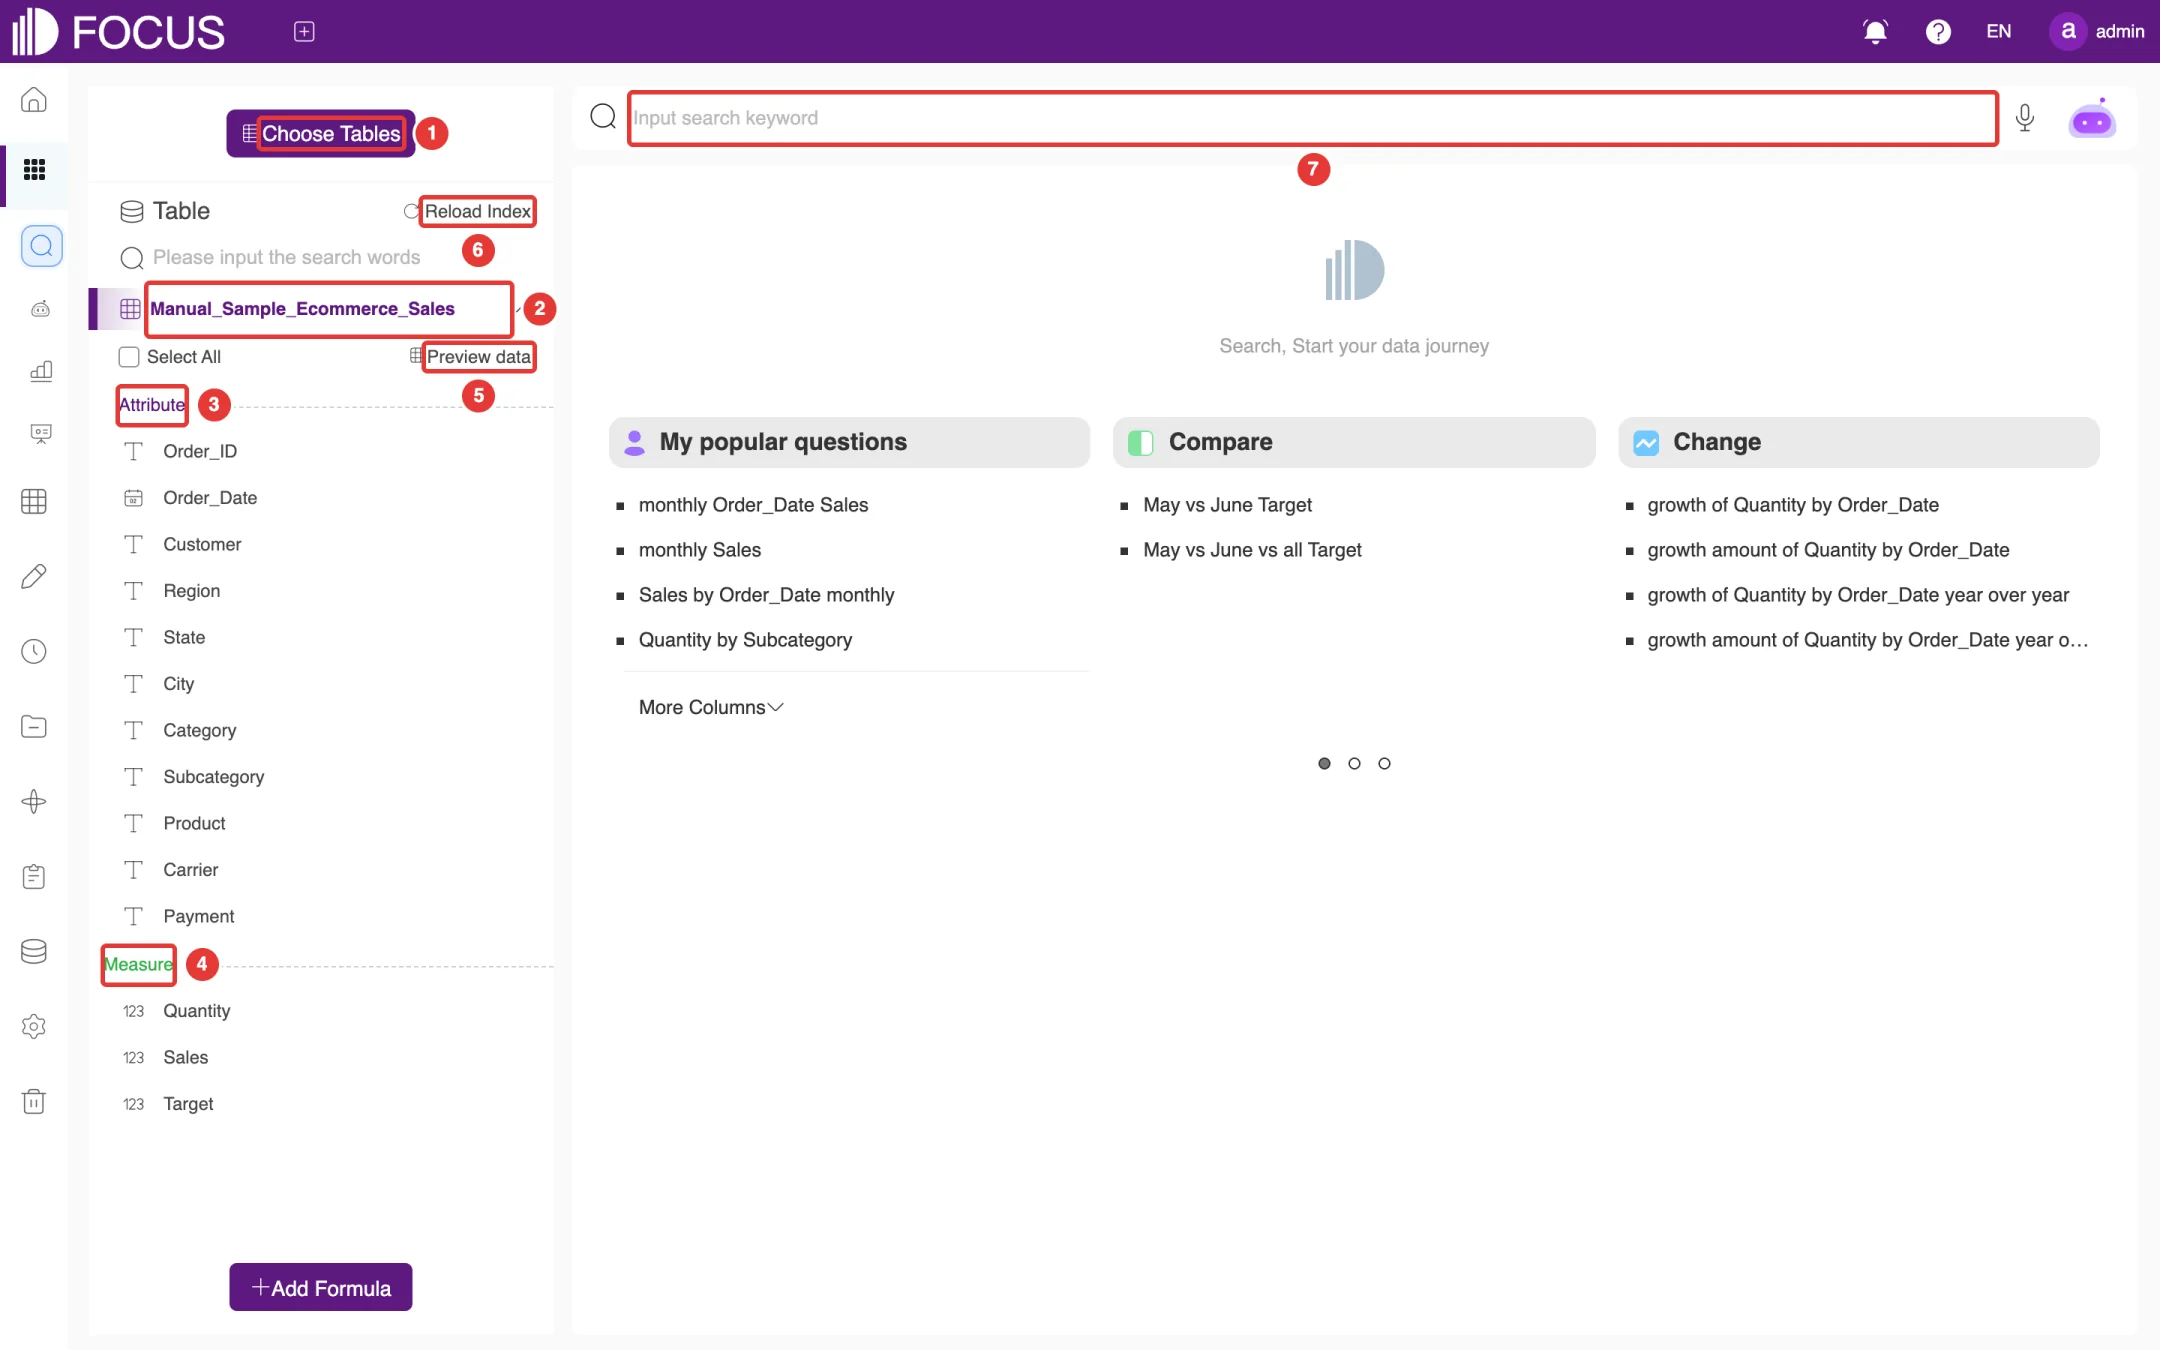
The left side of the page now lists all columns of the table, as shown in Figure 2-2:
① Choose Tables: choose the tables again.
② Current table: shows the name of the selected table. Click the arrow on its right to collapse or expand the column list.
③ Attribute columns: descriptive columns such as text, dates and locations, for example Product, Region and Order_Date. They are usually used for grouping and filtering.
④ Measure columns: numeric columns such as Sales and Quantity. In a search they are summed by default.
⑤ Preview data: view some of the table's data; see Section 2.6.
⑥ Reload Index: after the table's content has changed, click here to refresh the index used for search suggestions.
⑦ Search box: enter your search statement here.
Figure 2-2. Search page with a table selected
Below the search box are recommended search statements, grouped into categories such as My popular questions, Compare and Change. Click one to run that search directly.
2.2Entering a search statement
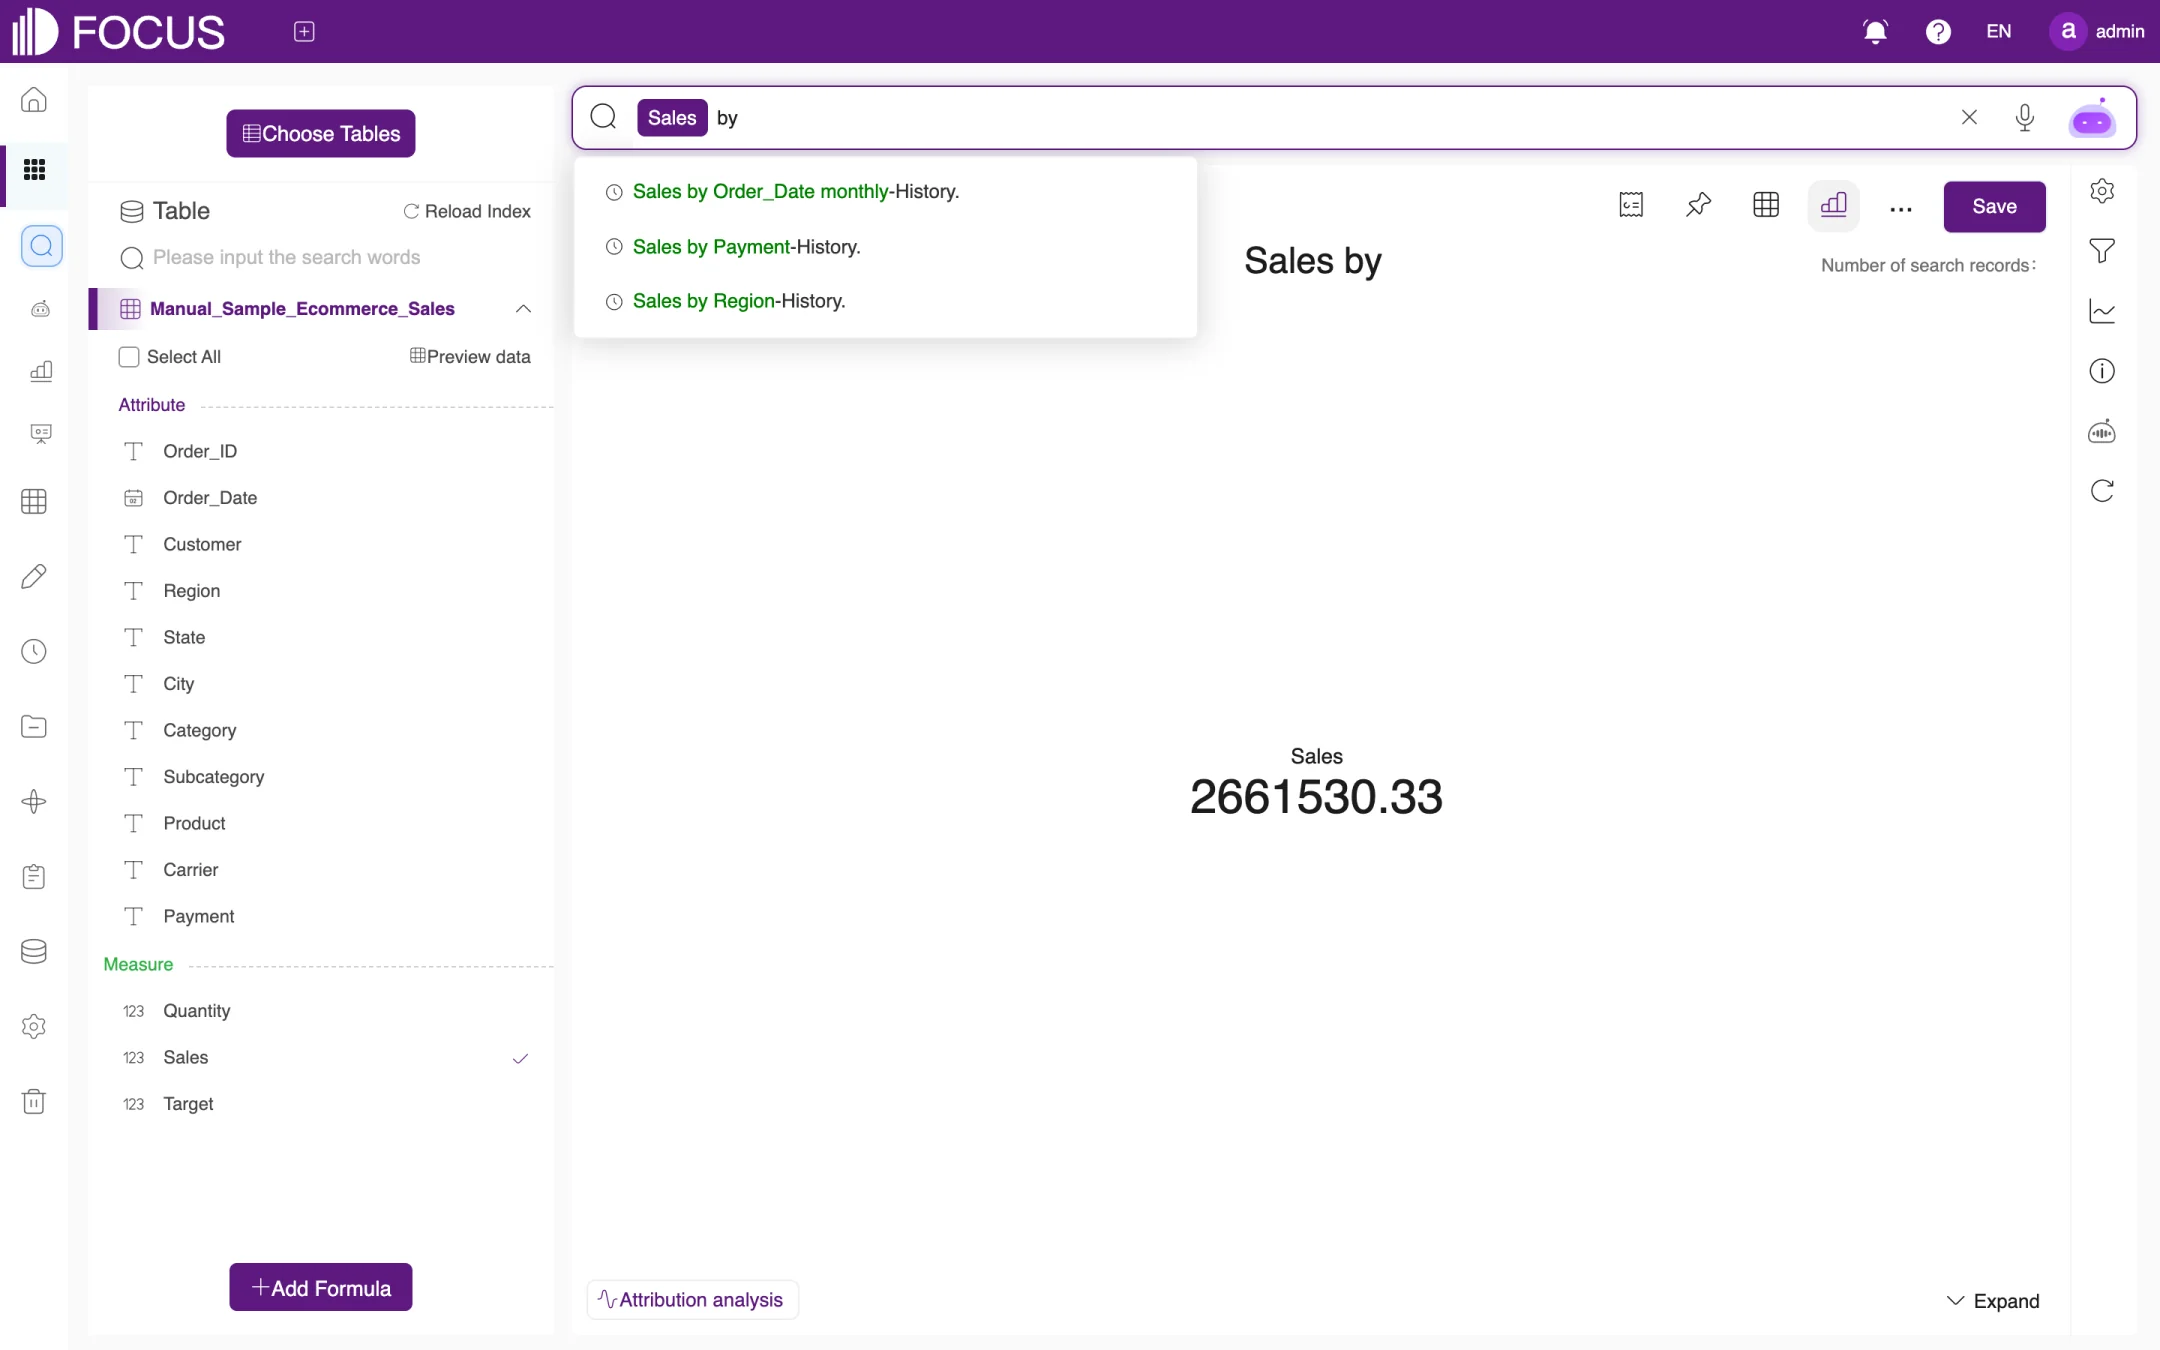
Type column names and keywords in the search box, separated by spaces. As you type, suggestions (including your search history) appear below the search box, as shown in Figure 2-3; click one to use it. Recognized column names and keywords turn into highlighted tags.
Figure 2-3. Suggestions while typing
When you have finished, press Enter to run the search. Some common statements:
Search statement
Meaning
Default chart
Sales by Region
Total sales for each region
Pie chart
Sales by Order_Date monthly
Total sales for each month of the order date
Line chart
Quantity by Subcategory
Total quantity for each product subcategory
Pie chart
Sales by Payment
Total sales for each payment method
Pie chart
For the full usage of keywords such as monthly and yearly, open the Help menu at the top right of the page, click Tutorial, and see the keyword reference there.
Note: If what you type is not made up of standard column names and keywords (for example, a complete question), the system automatically asks FocusGPT to parse it into a search statement; see Section 2.4.
2.3Search results
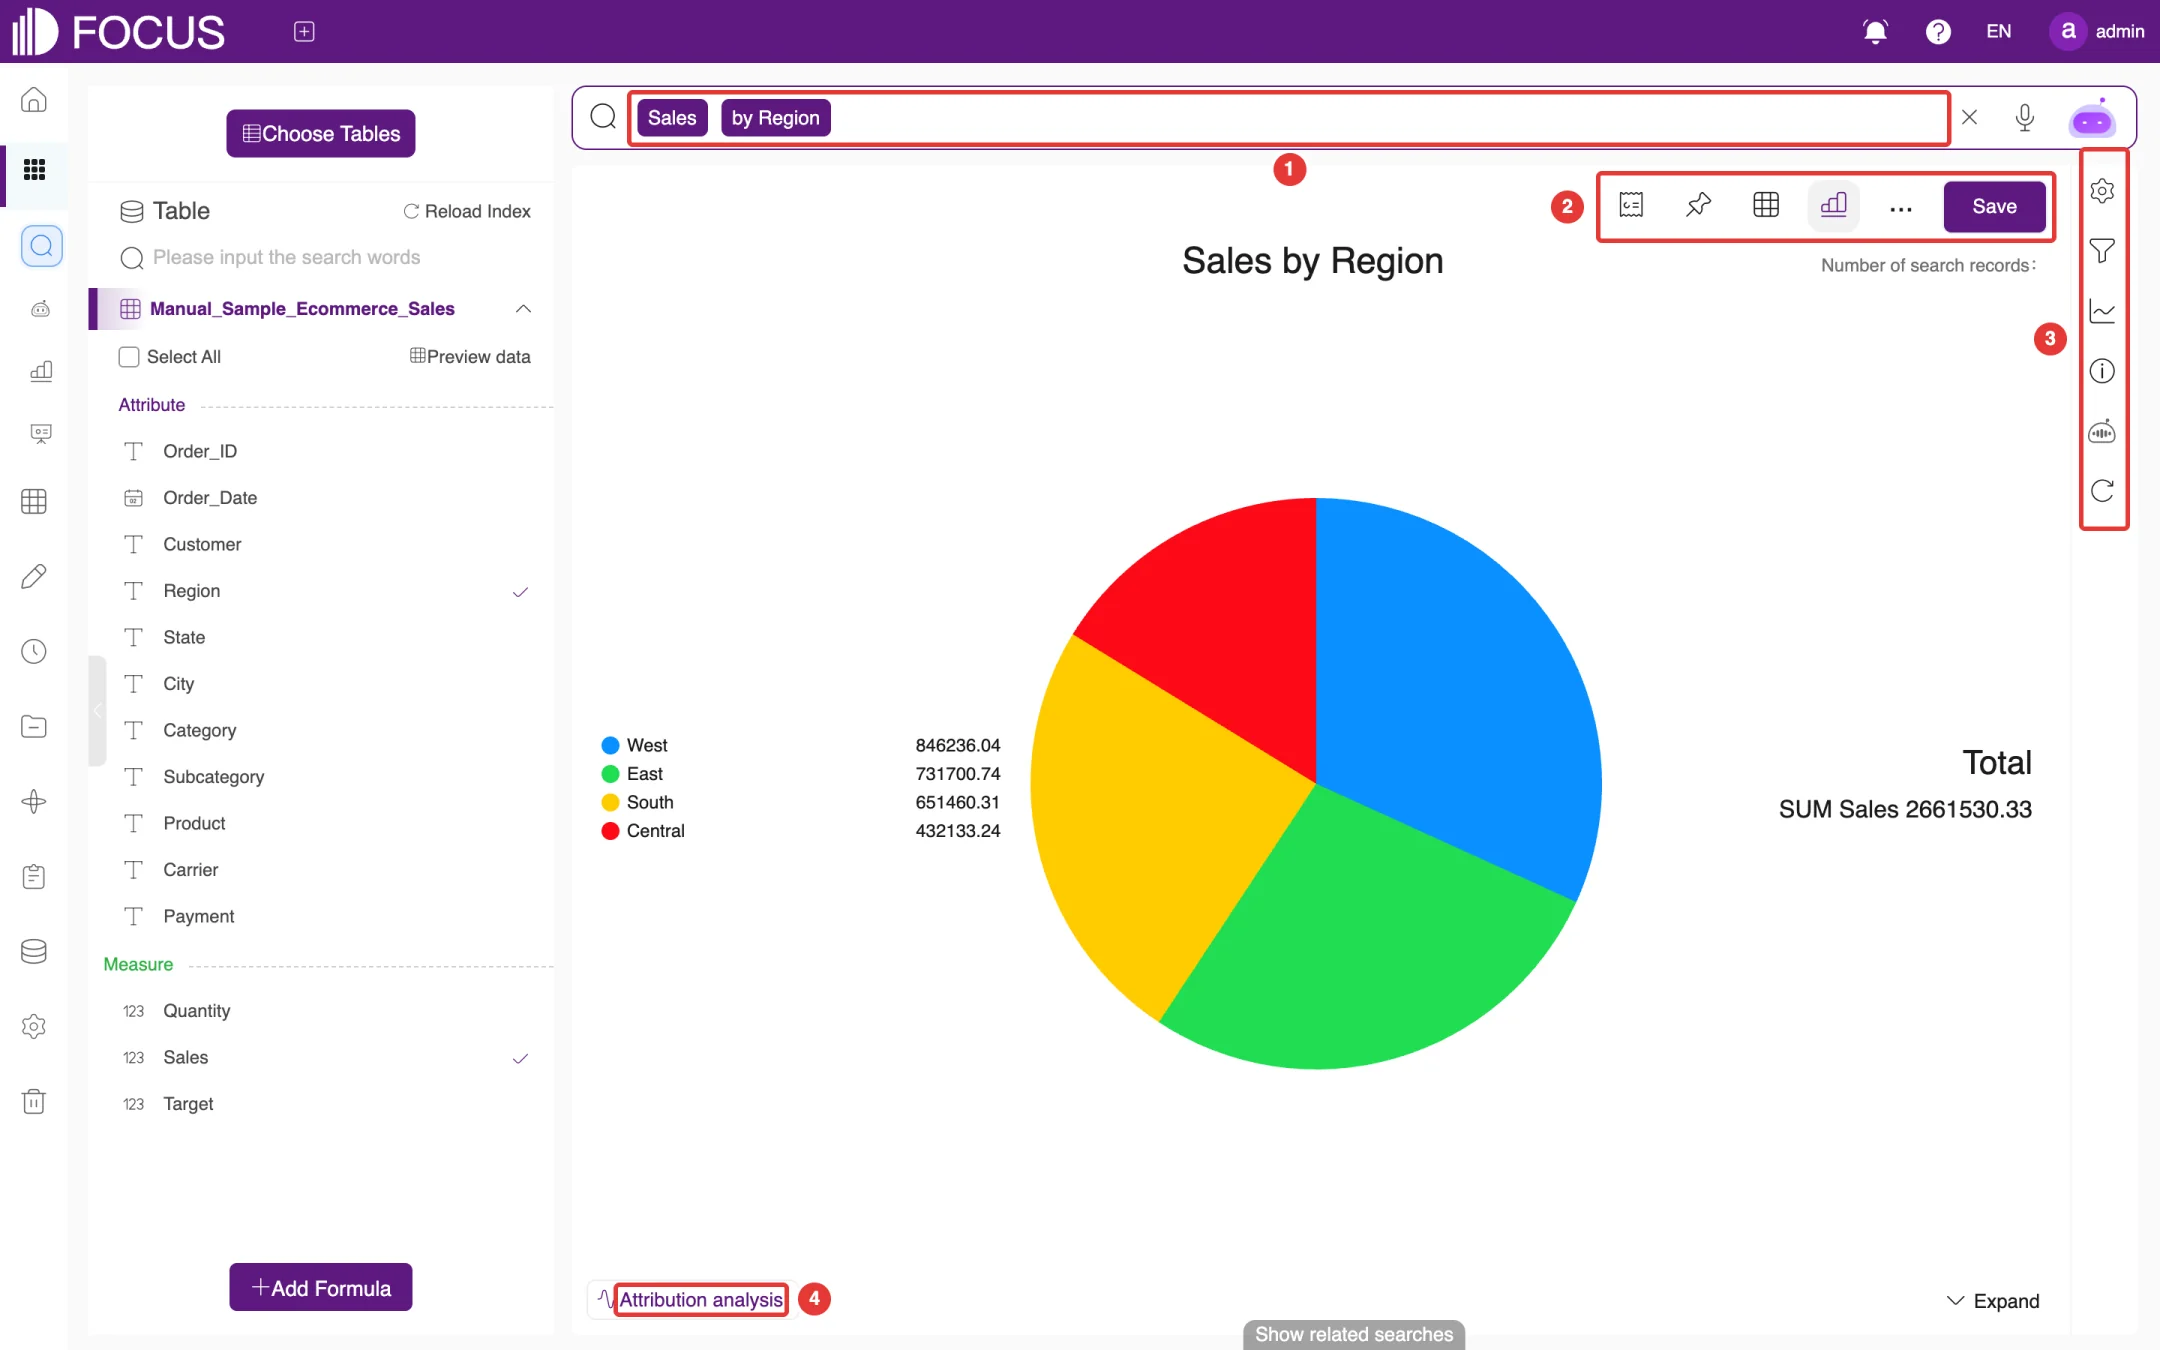
When the search is complete, the page shows the result chart with the search statement as its title, and Number of search records at the top right, as shown in Figure 2-4:
① Search box: the current search statement. You can edit it and search again.
② Toolbar: add the result to a pinboard, switch the display mode, save it, and more.
③ Right-hand rail: adjust the chart properties, filters and chart axes, and view the SQL and FocusGPT's analysis summary.
④ Attribution analysis: analyze what caused a change in a measure; see Section 2.5.
Figure 2-4. Search result page
2.3.1Toolbar
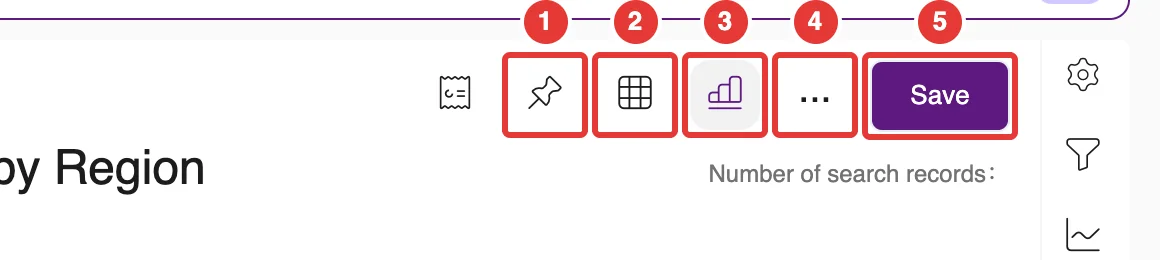
The toolbar buttons are shown in Figure 2-5. The leftmost icon, Join the brief report, adds the current result to a data briefing as one item; you can place the chart on the left or the right (Chart is left / Chart is right) and add remarks. The other buttons, from left to right, are:
① Add to pinboard: add the result to a pinboard; see Section 2.7.
② Display in grid: show the result as a detail table.
③ Display in chart: change the chart type.
④ … (more): save as a worksheet, export the data, export an image, convert the data, or refresh the data.
⑤ Save: save the result as an answer; see Section 2.7.
Figure 2-5. Result toolbar
2.3.2Switching the chart type
The system picks a chart automatically from the characteristics of the result data. You can also change it yourself:
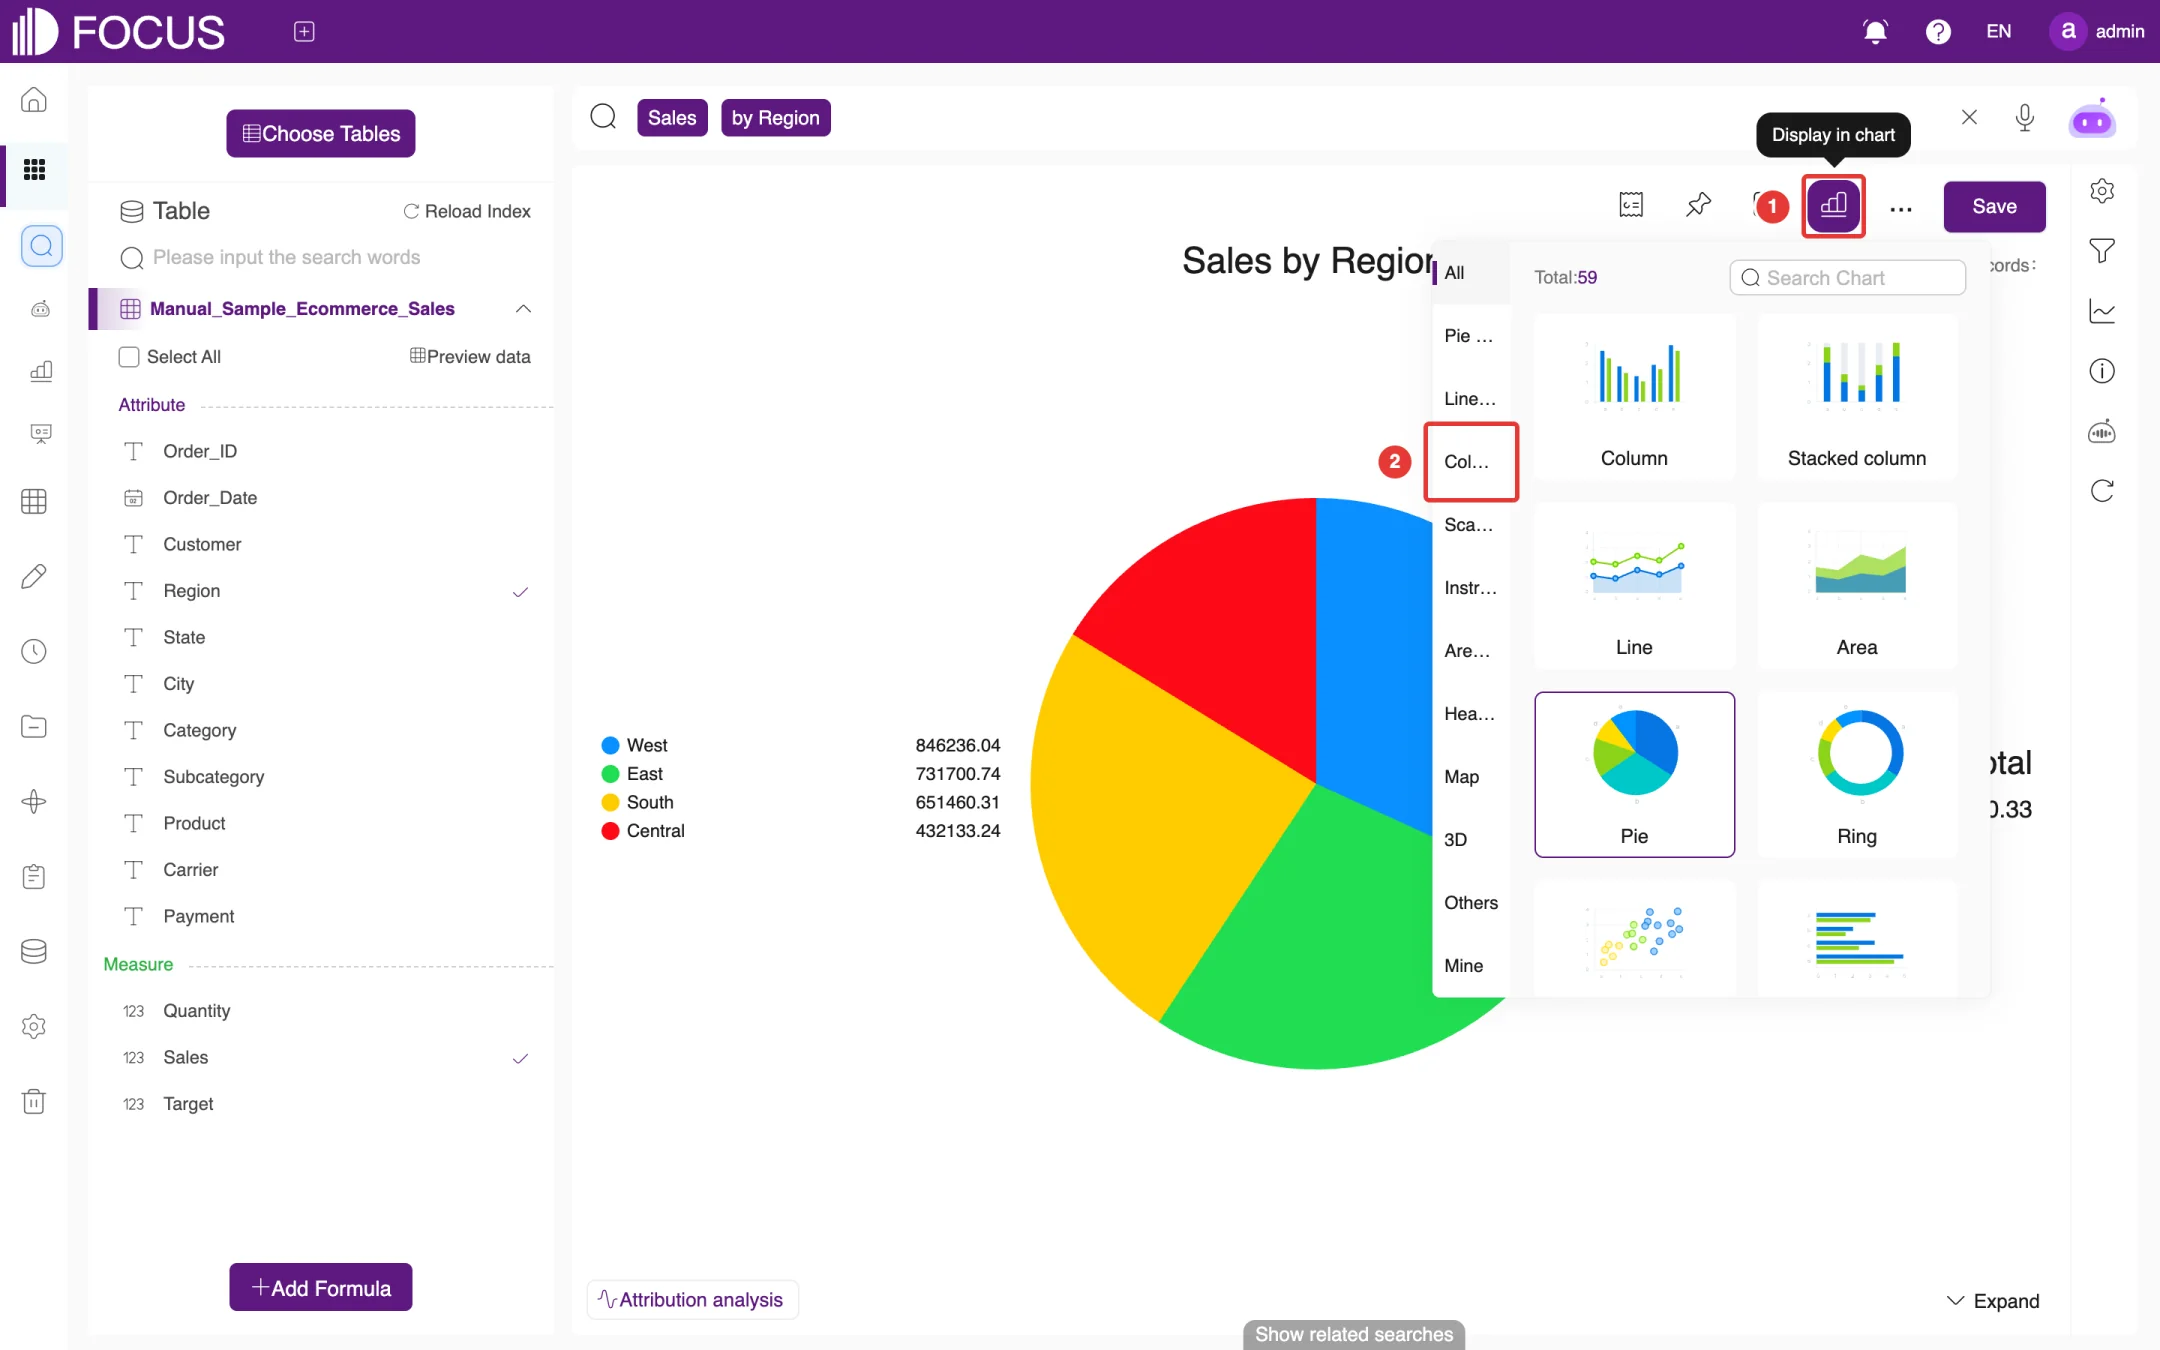
Click Display in chart in the toolbar (① in Figure 2-6) to open the chart panel. The top of the panel shows how many chart types are available (Total), and the left side groups them into categories such as Pie Chart, Line Chart, Column Chart, Scatter Chart, Instrument Chart, Area Chart, Heat Chart, Map and 3D.
Choose a category on the left (for example Column Chart at ②), then click a chart on the right, such as Column.
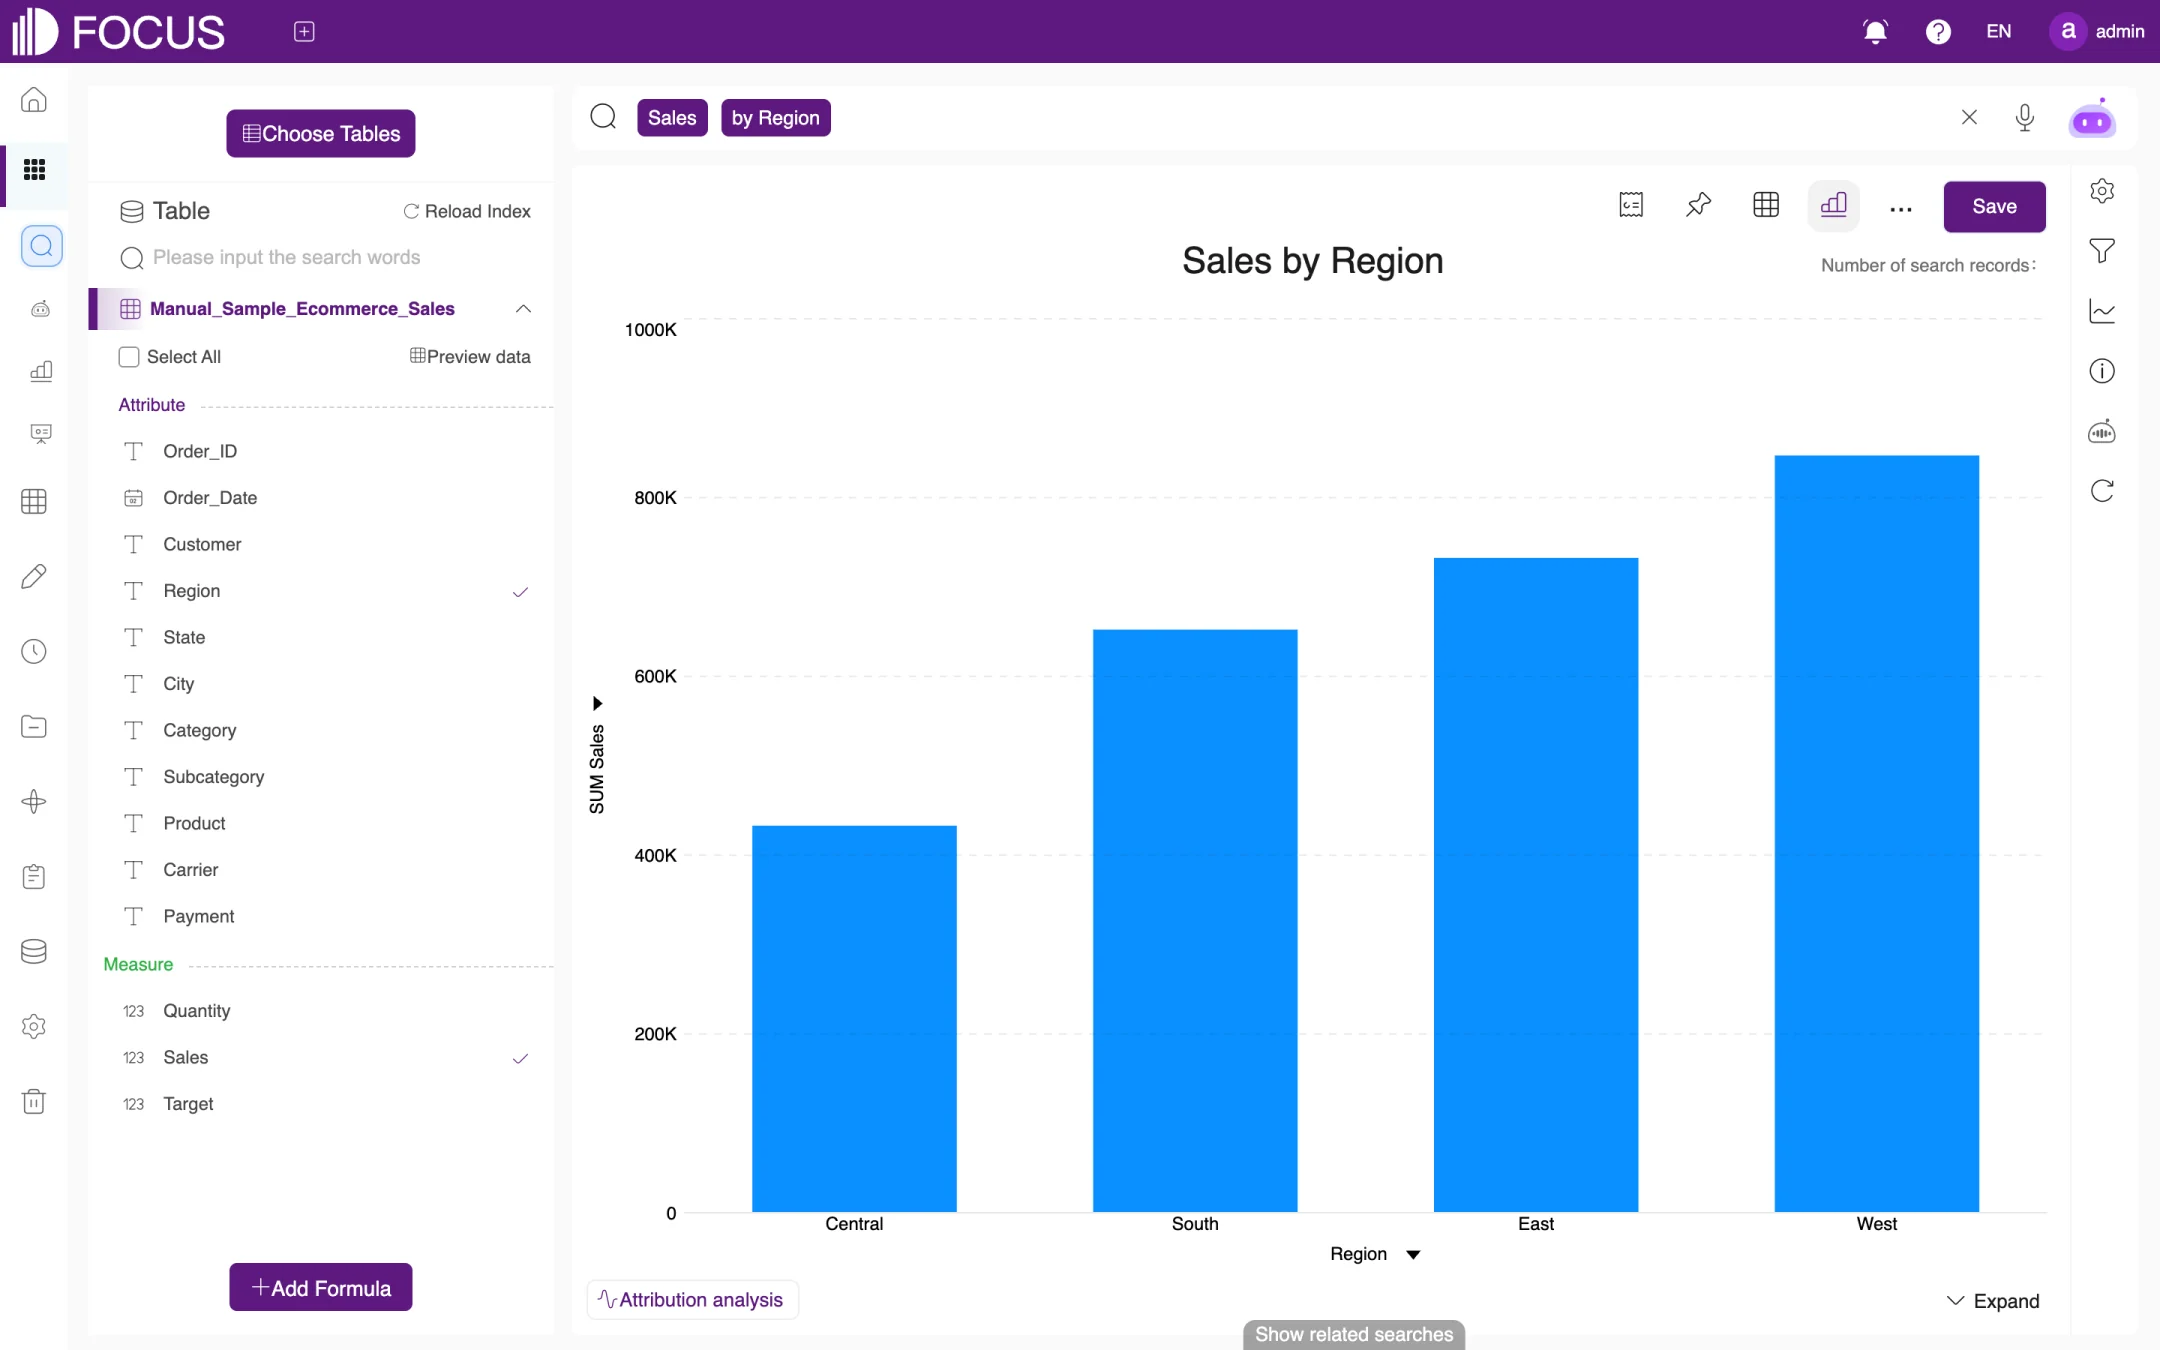
The chart switches to the selected type at once, as shown in Figure 2-7.
Figure 2-6. Chart type panelFigure 2-7. Switched to a column chart
2.3.3Showing the result as a table
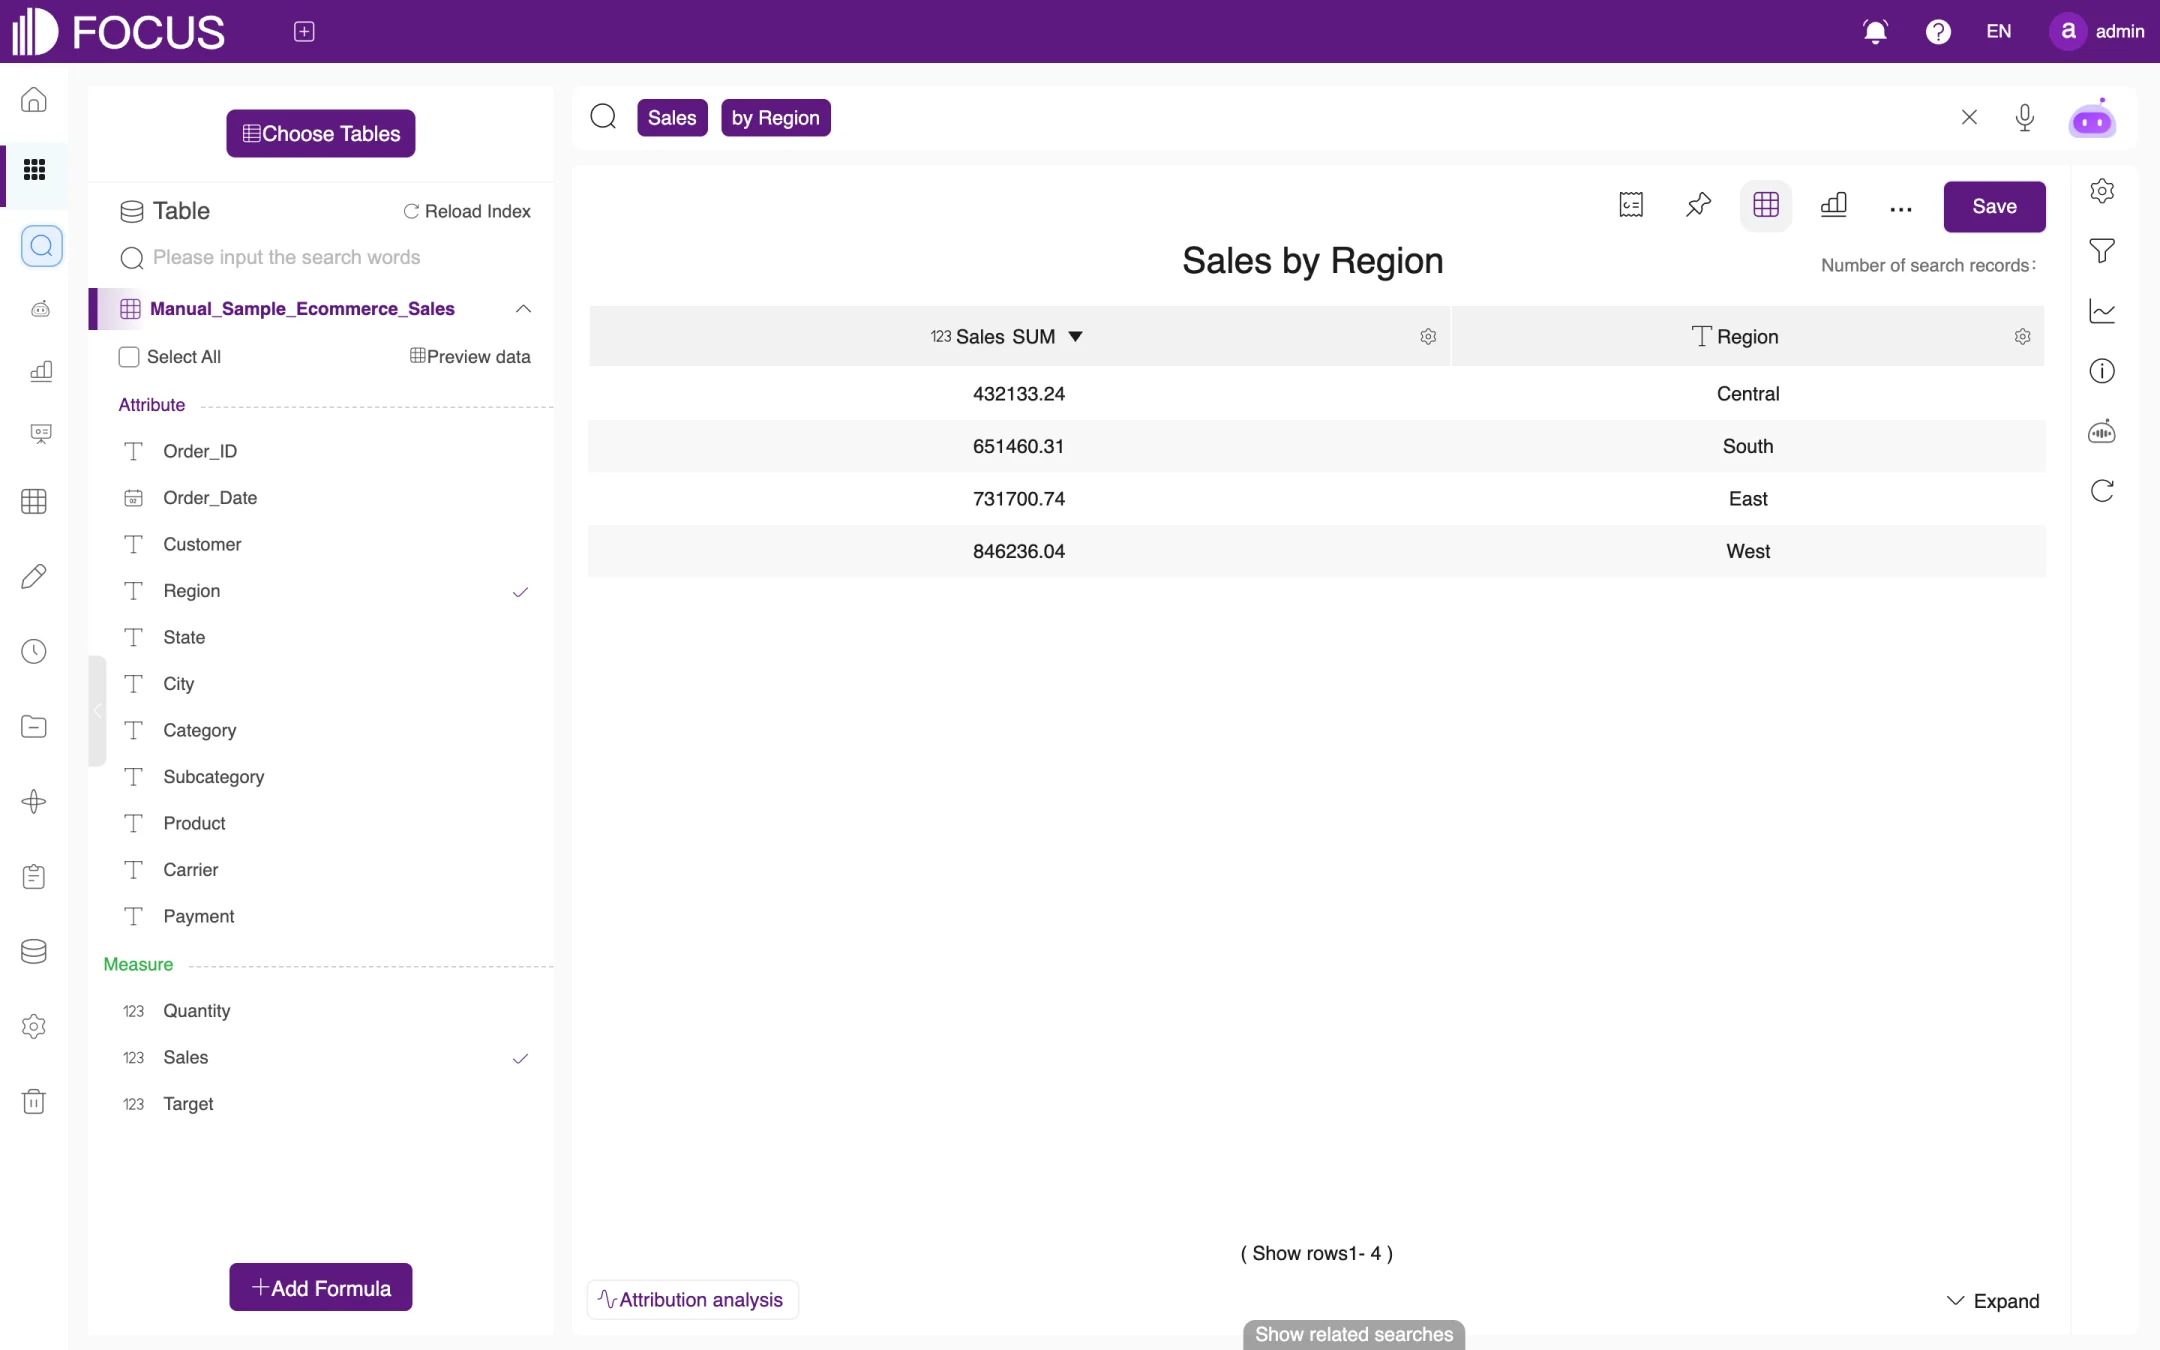
Click Display in grid in the toolbar to show the result as a table, as shown in Figure 2-8. Click the arrow next to a column header to sort by that column, or click the gear icon to set up the column. To return to a chart, click Display in chart and choose a chart.
Figure 2-8. Result shown as a table
2.3.4Right-hand rail
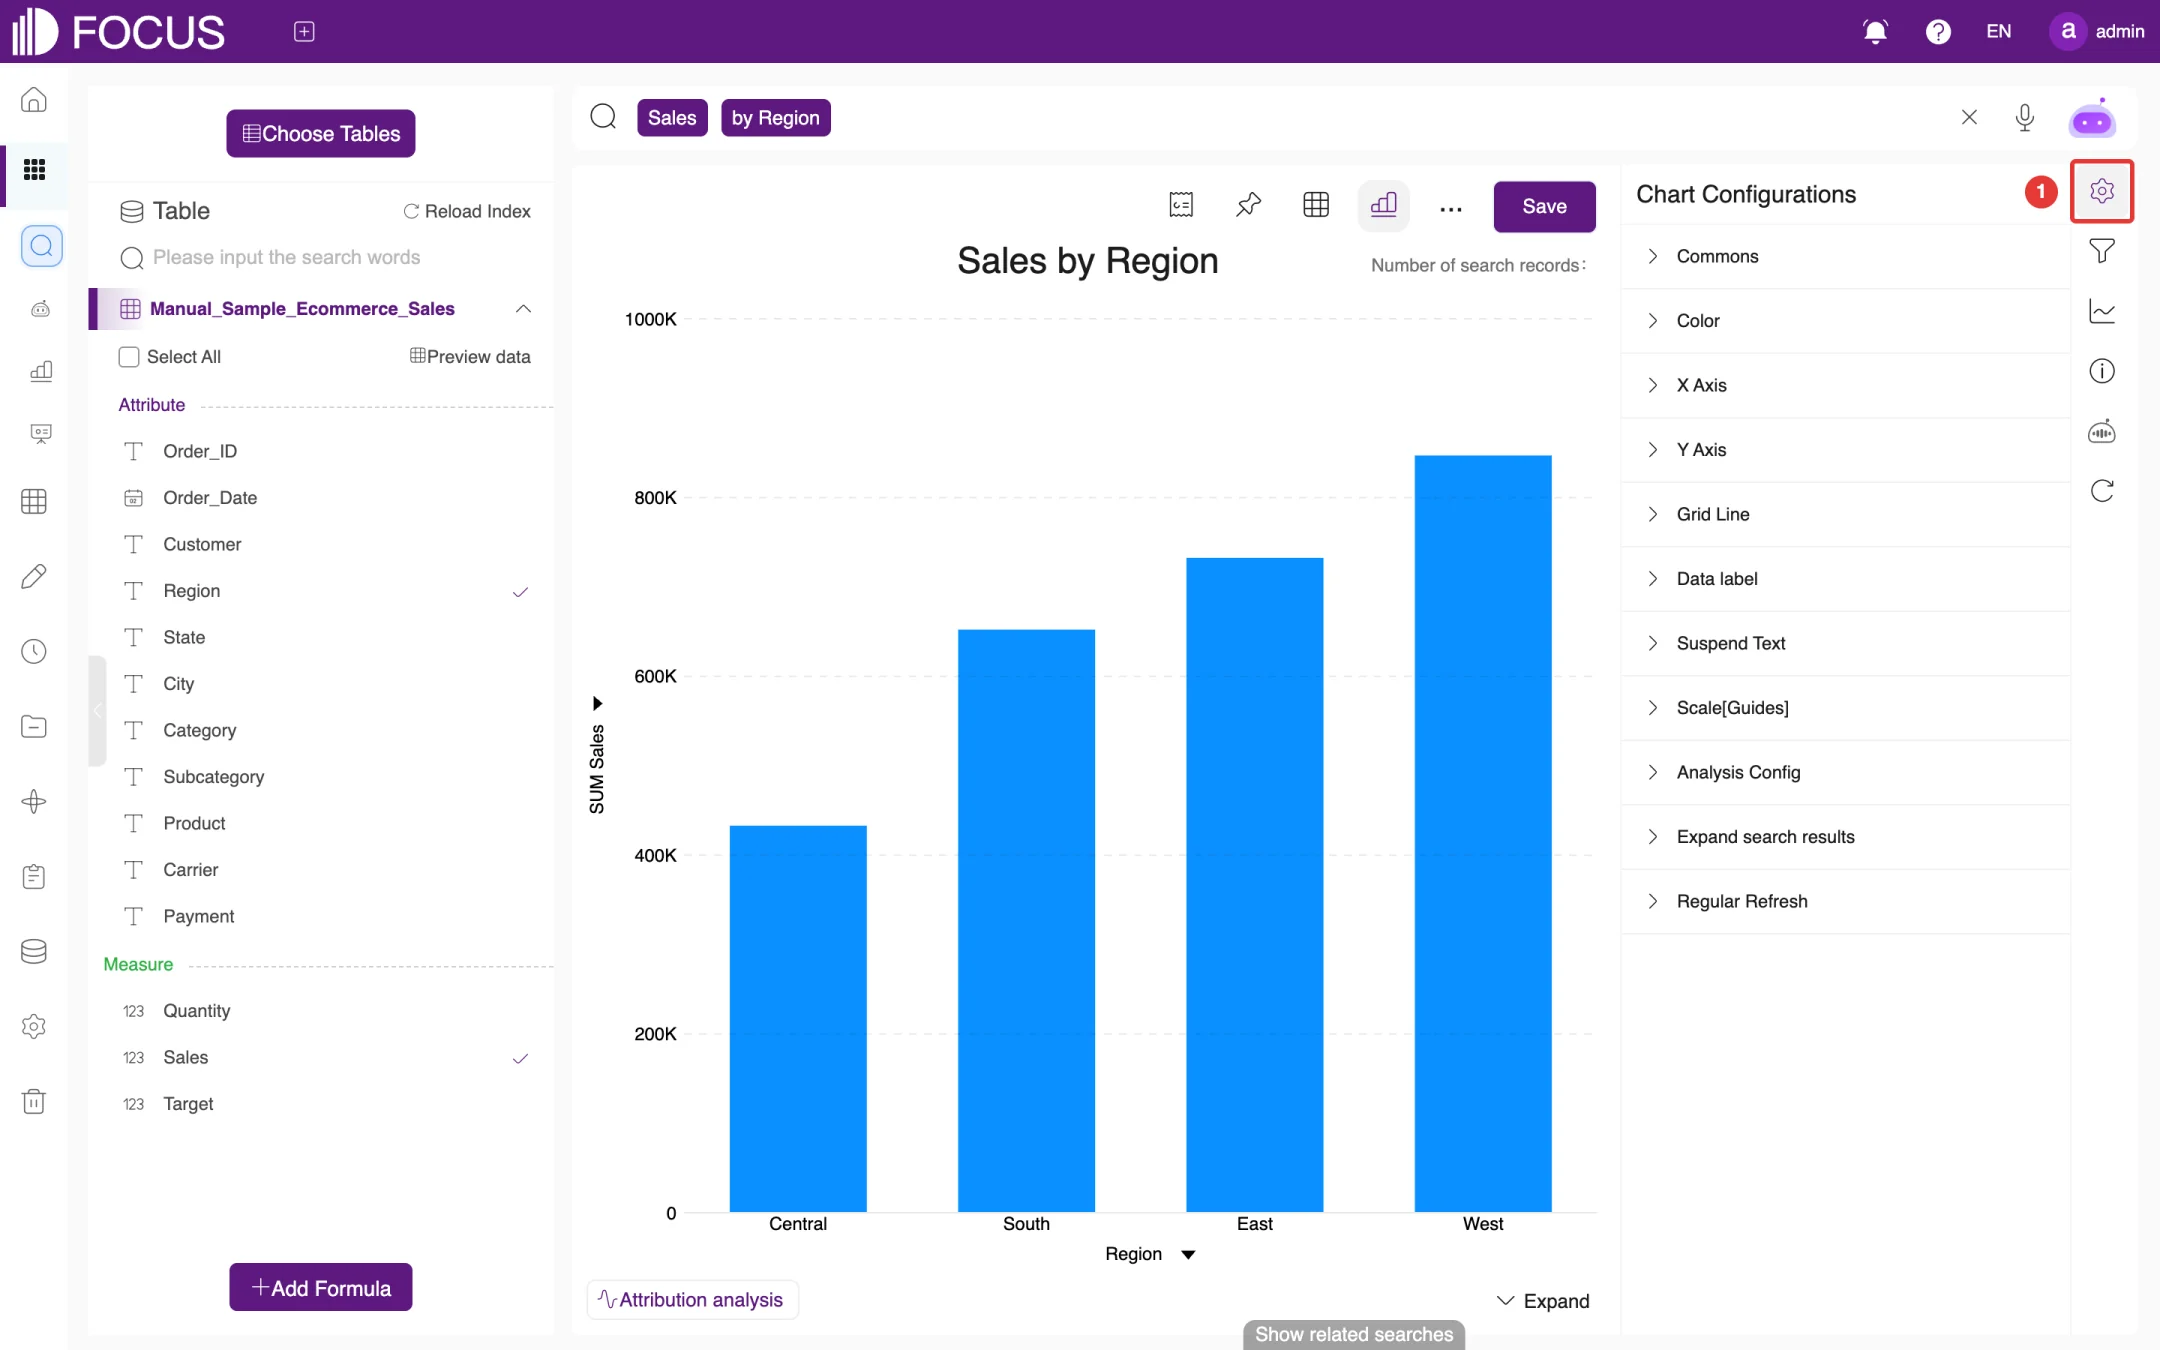
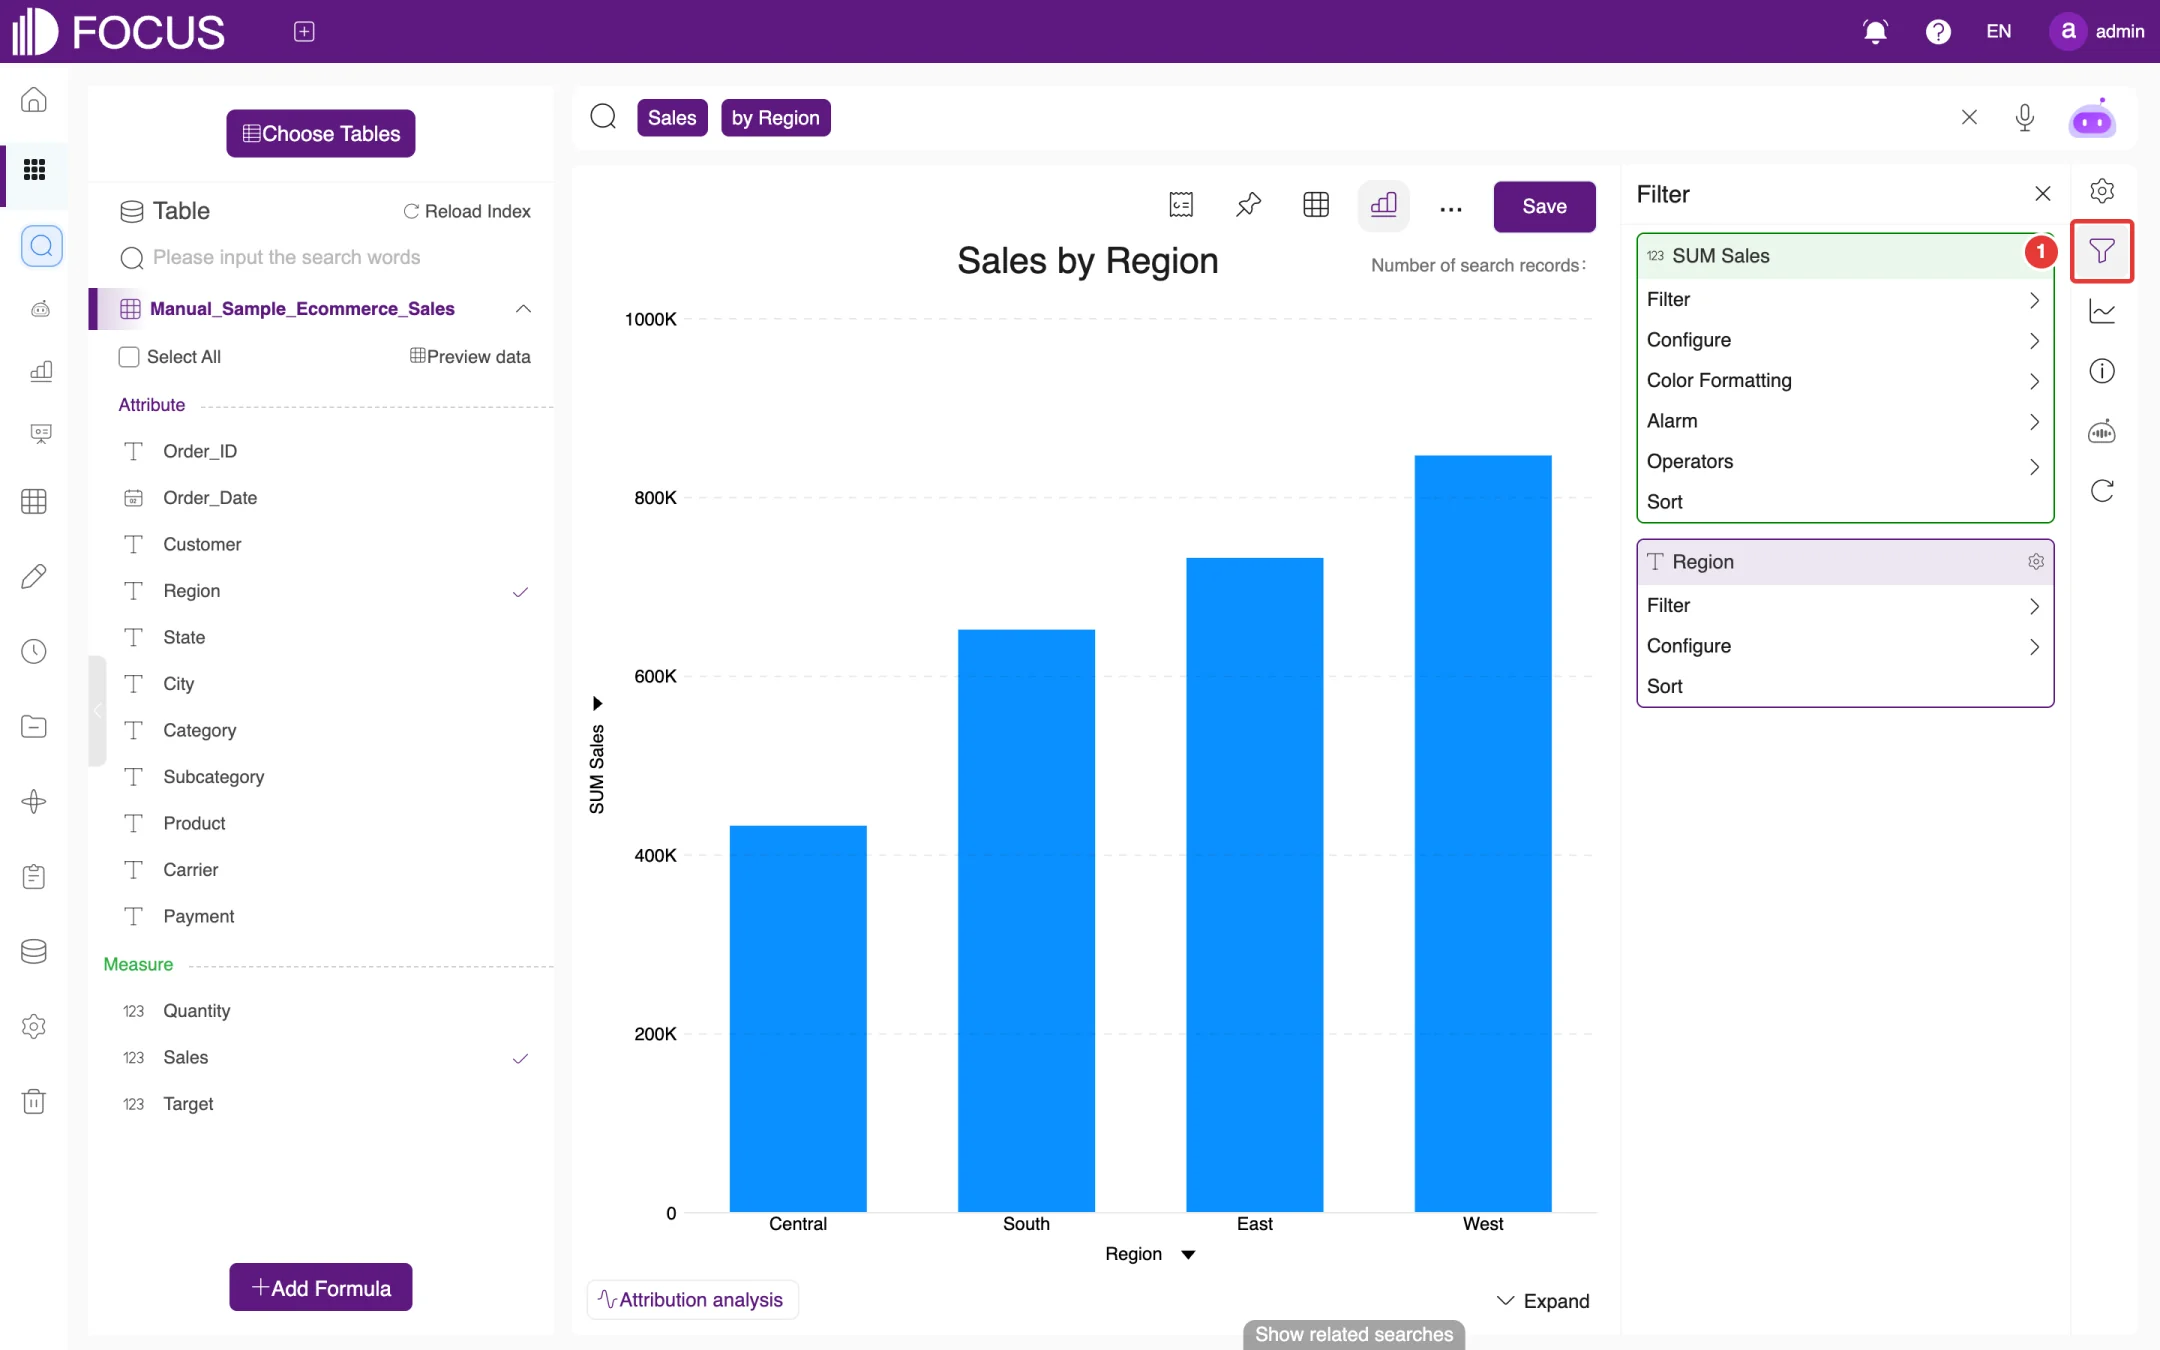
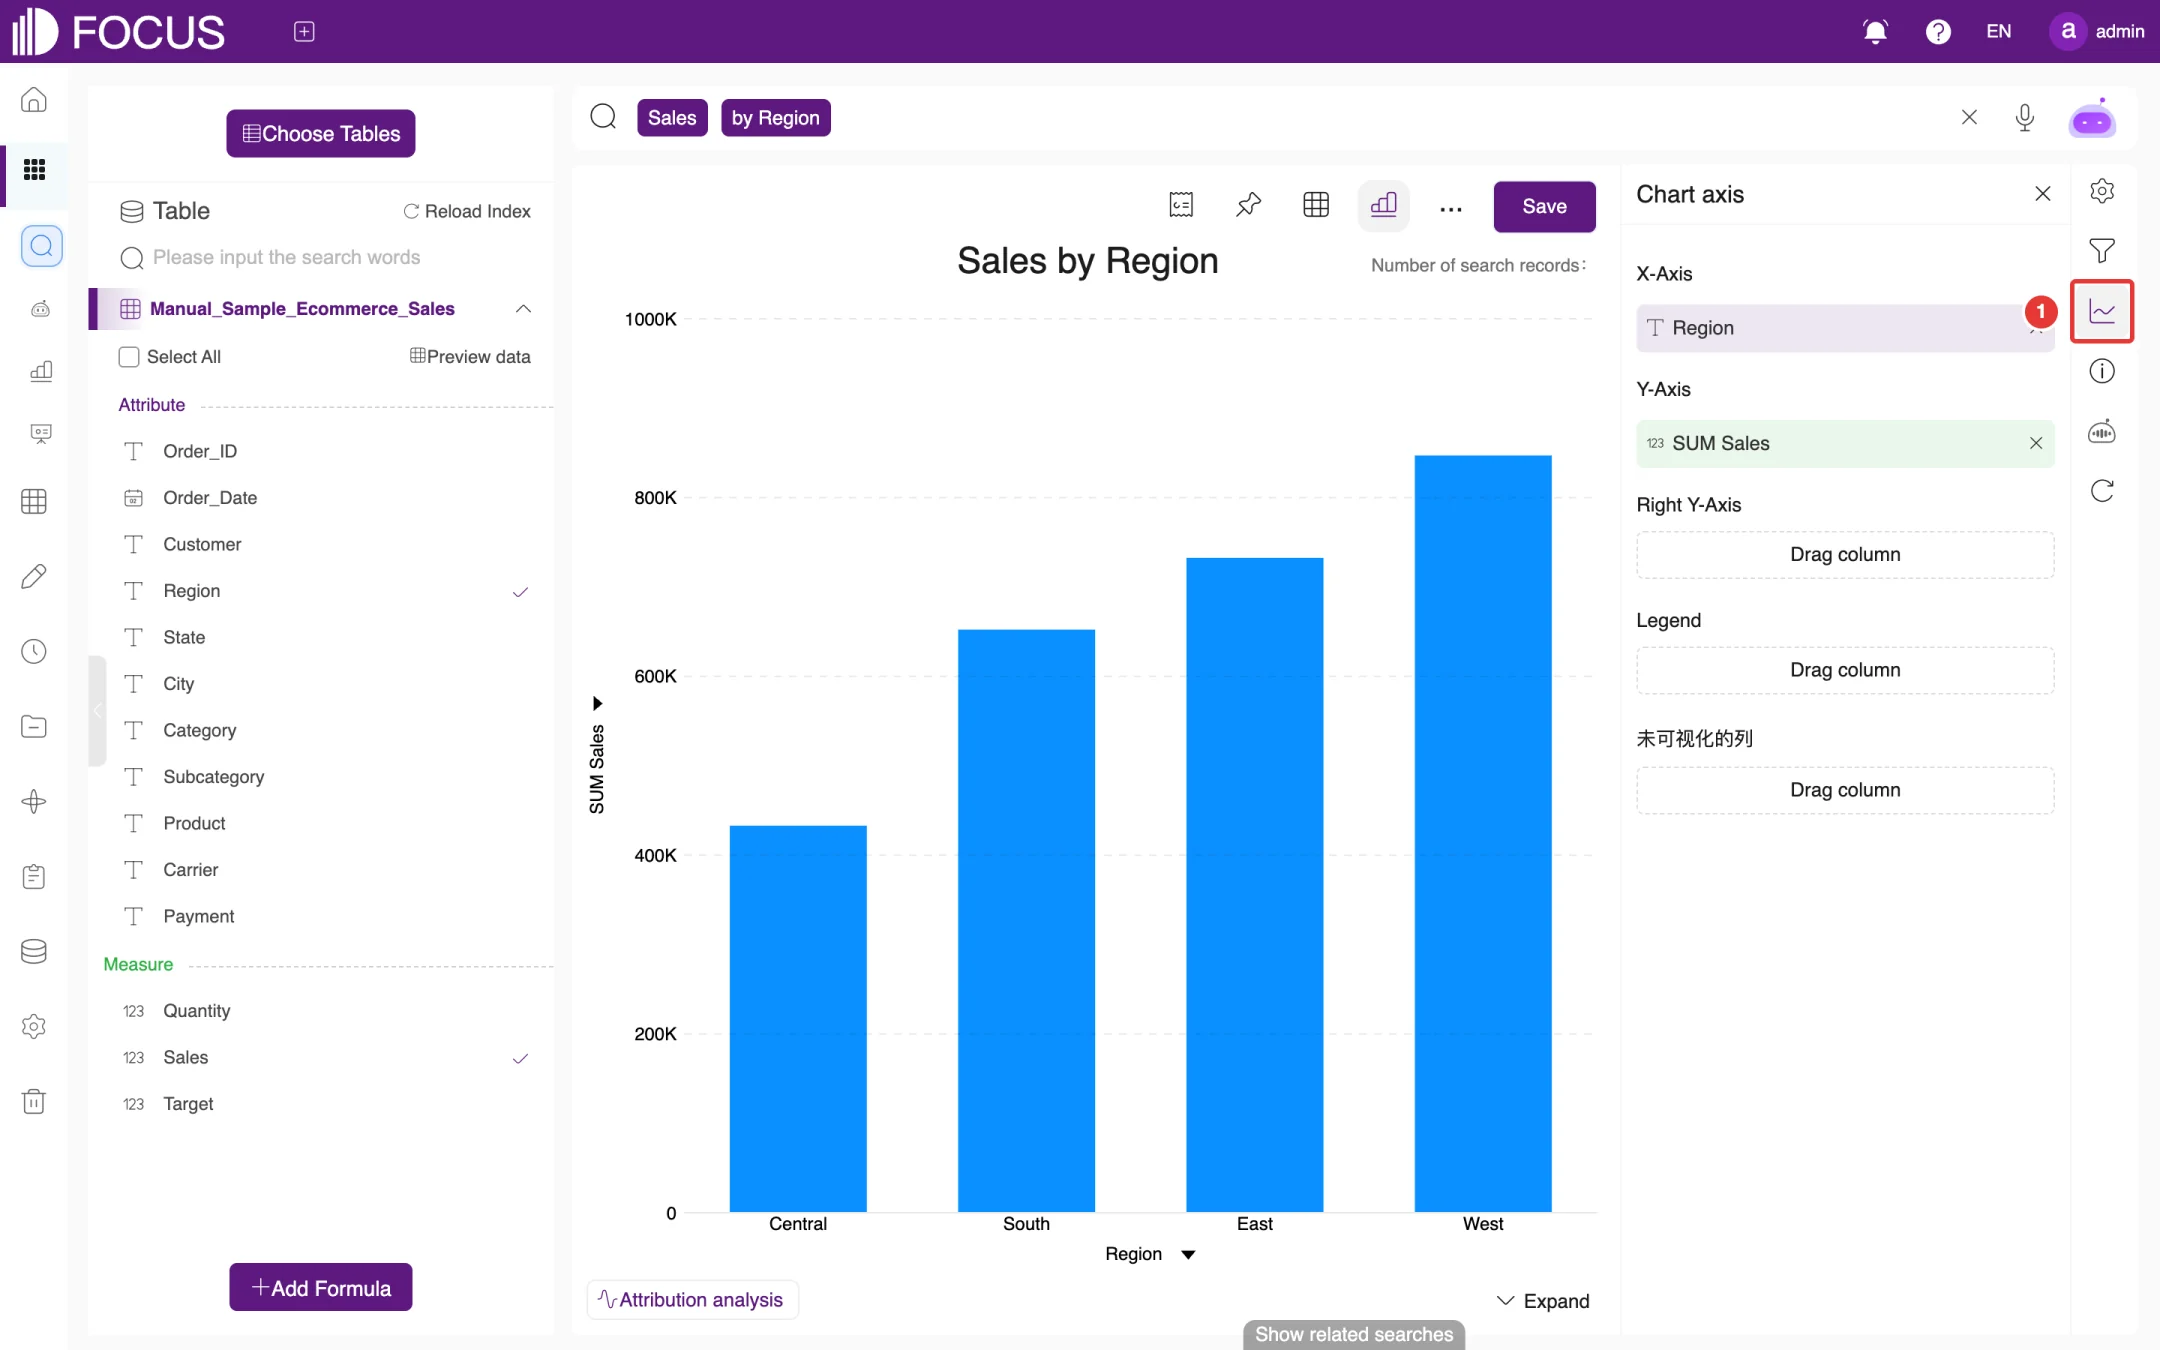
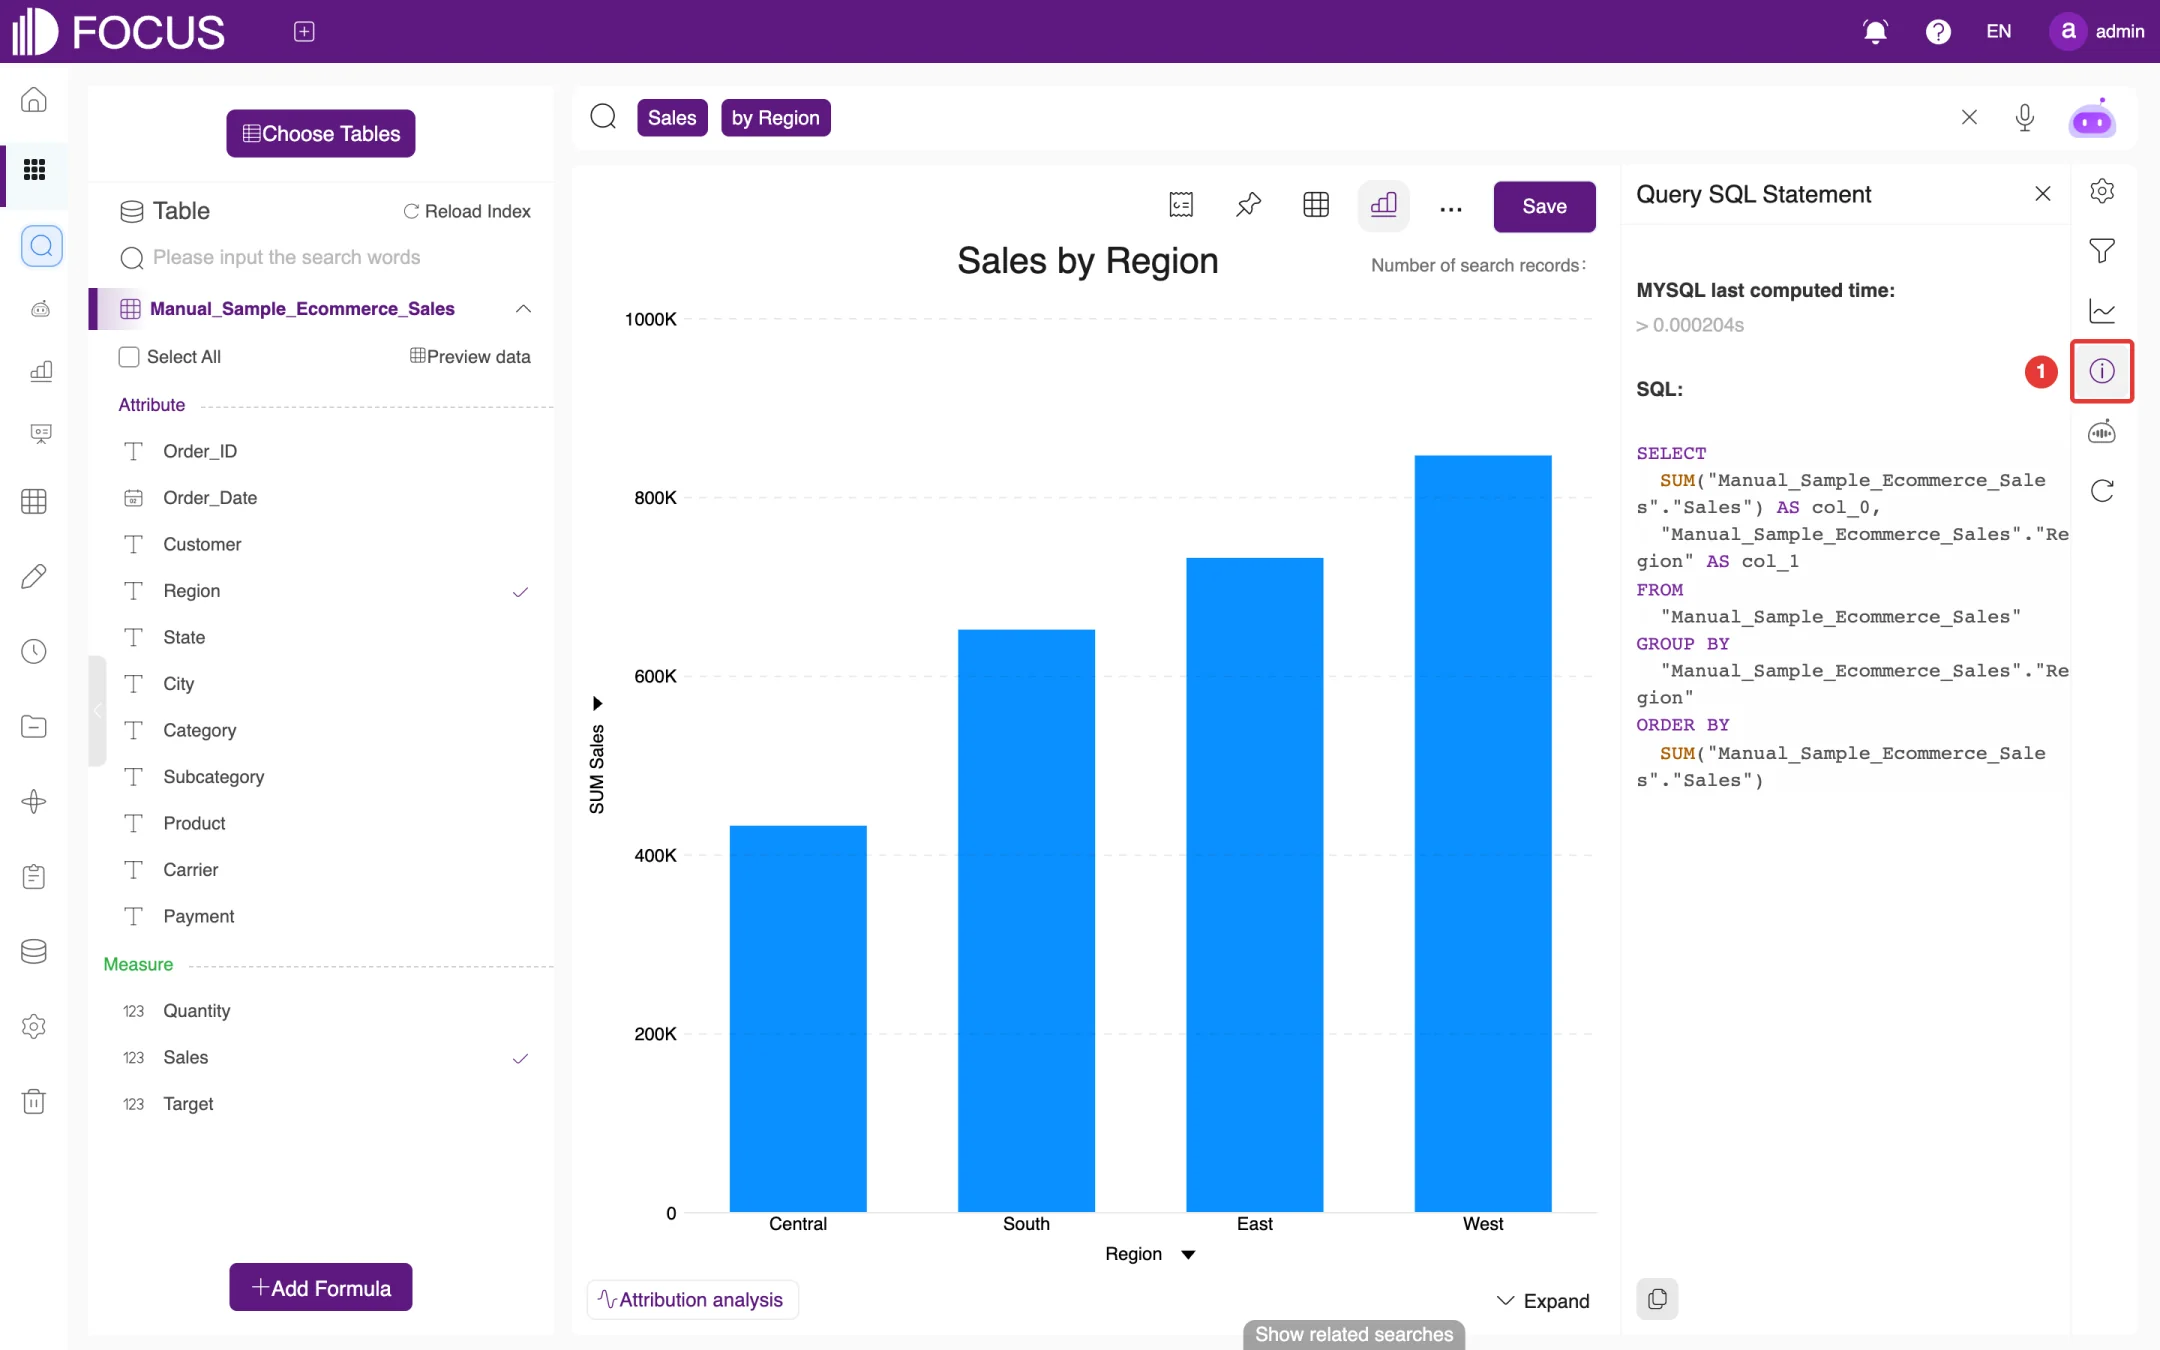
The first five buttons on the right-hand rail are described below, from top to bottom. Click a button to open its panel to the right of the result, and click it again to close the panel. In each of the following figures, ① marks the button.
Chart Configurations: adjust the appearance of the chart, including Commons, Color, X Axis, Y Axis, Grid Line, Data label, Suspend Text (hover text), Scale[Guides] (reference lines), Analysis Config, Expand search results and Regular Refresh, as shown in Figure 2-9.
Figure 2-9. Chart Configurations
Filter: set filter conditions column by column, as shown in Figure 2-10. Each column offers options such as Filter, Configure and Sort; measure columns also have Color Formatting, Alarm and Operators (the aggregation, for example changing a sum to an average).
Figure 2-10. Filter
Chart axis: choose which columns are used for the X-Axis, Y-Axis, Right Y-Axis and Legend, as shown in Figure 2-11. Drag a column to the matching area (Drag column). To hide a column for now, drag it to the last area, titled 未可视化的列 ("non-visualized columns"; this label is not yet translated in the English interface).
Figure 2-11. Chart axis
Query SQL Statement: shows the SQL that the search actually ran and its computation time (MYSQL last computed time), so that you can check how the figures were calculated, as shown in Figure 2-12.
Figure 2-12. Query SQL Statement
Summary of Analysis: FocusGPT interprets the current result in words, on two tabs, Summary and Analysis.
2.3.5More operations
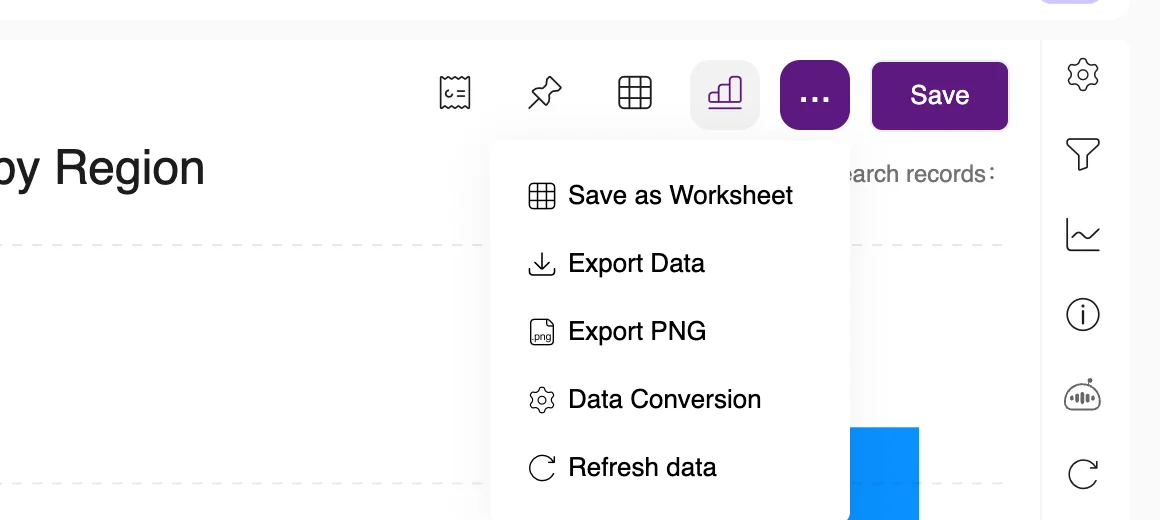
Click … in the toolbar to open the menu of more operations, as shown in Figure 2-13:
Save as Worksheet: save the current result as a new table for later searches.
Export Data: download the result data to your computer.
Export PNG: download the chart as an image.
Data Conversion: transform the result data further.
Refresh data: run the query again to get the latest data.
Figure 2-13. More operations
2.4FocusGPT natural-language parsing
Instead of column names and keywords, you can also ask a question in natural language, for example What are the sales of each state in the East region?. When you press Enter, FocusGPT parses the question into a search statement. A prompt below the search box reads "FocusGPT just parsed your input … into …", followed by the statement FocusGPT produced, and the search box shows the parsed version. Check it; if it is not what you meant, click Revert to go back to your own input.
The prompt has three actions on the right:
Revert: undo FocusGPT's parsing and go back to what you typed;
the thumbs-up icon: give positive feedback on this parsing;
×: close the prompt.
Note: When you type a standard search statement, FocusGPT also parses it again in the background. If its version differs from your input, the same prompt appears and the search box is replaced with the parsed version. To keep your own statement, click Revert. The search screenshots in this chapter keep the original statements in this way.
2.5Forecast and attribution analysis
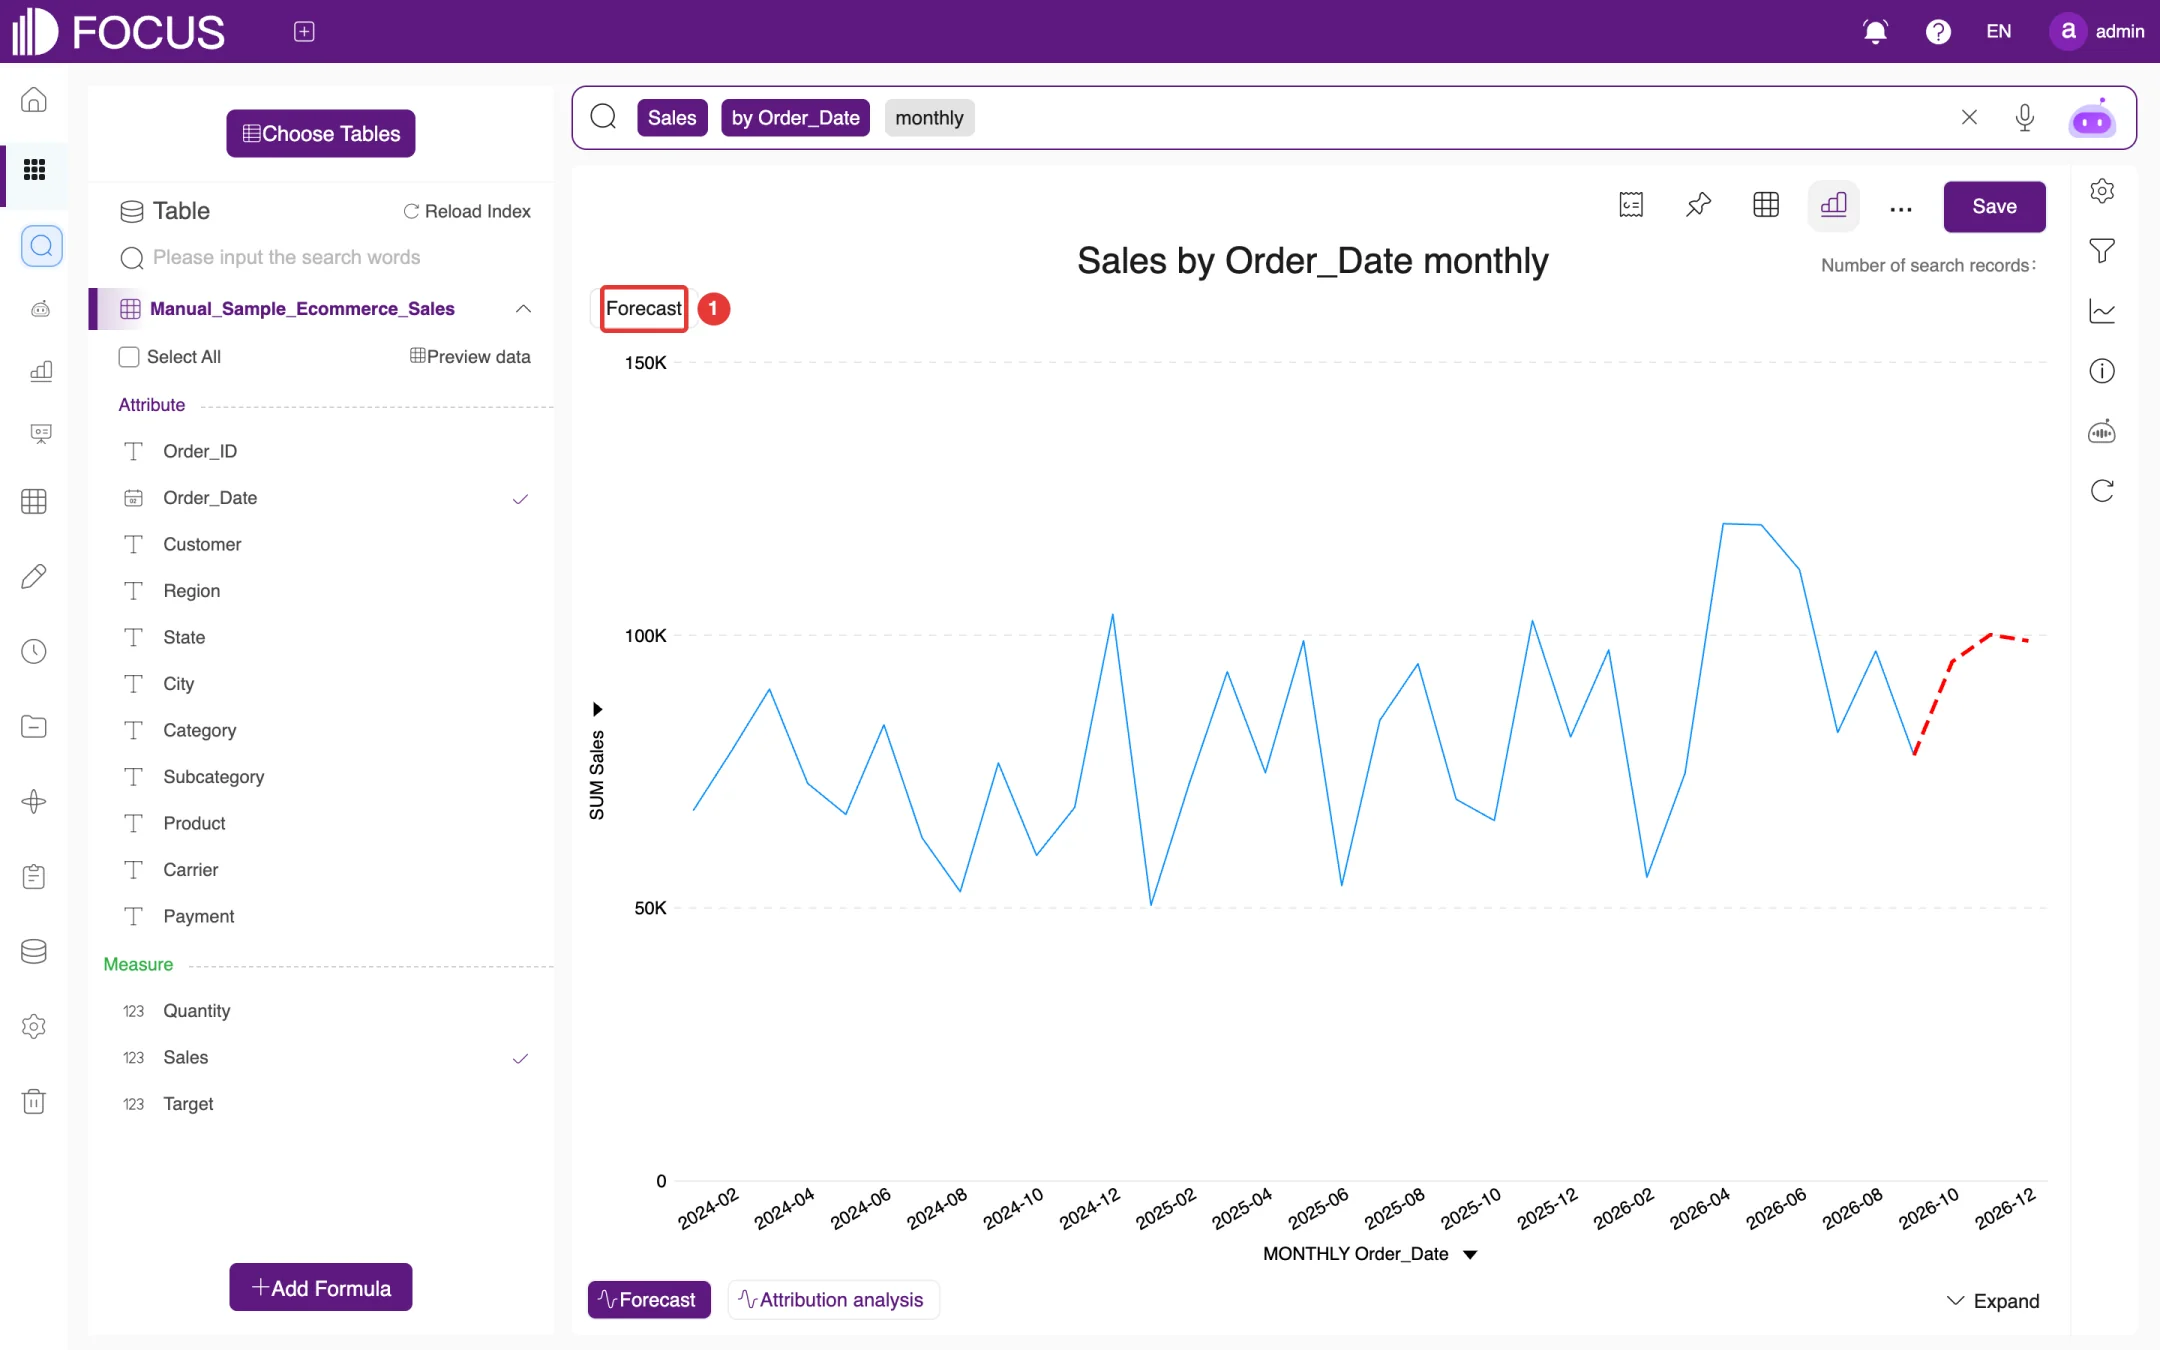
2.5.1Forecast
When the result is shown over time (for example Sales by Order_Date monthly), a Forecast button appears at the bottom left of the result. Click it, and the system predicts the next few periods from the historical data and draws them as a red dashed line that continues the original curve, labeled Forecast at the top left of the chart (①), as shown in Figure 2-14.
Figure 2-14. Forecast
2.5.2Attribution analysis
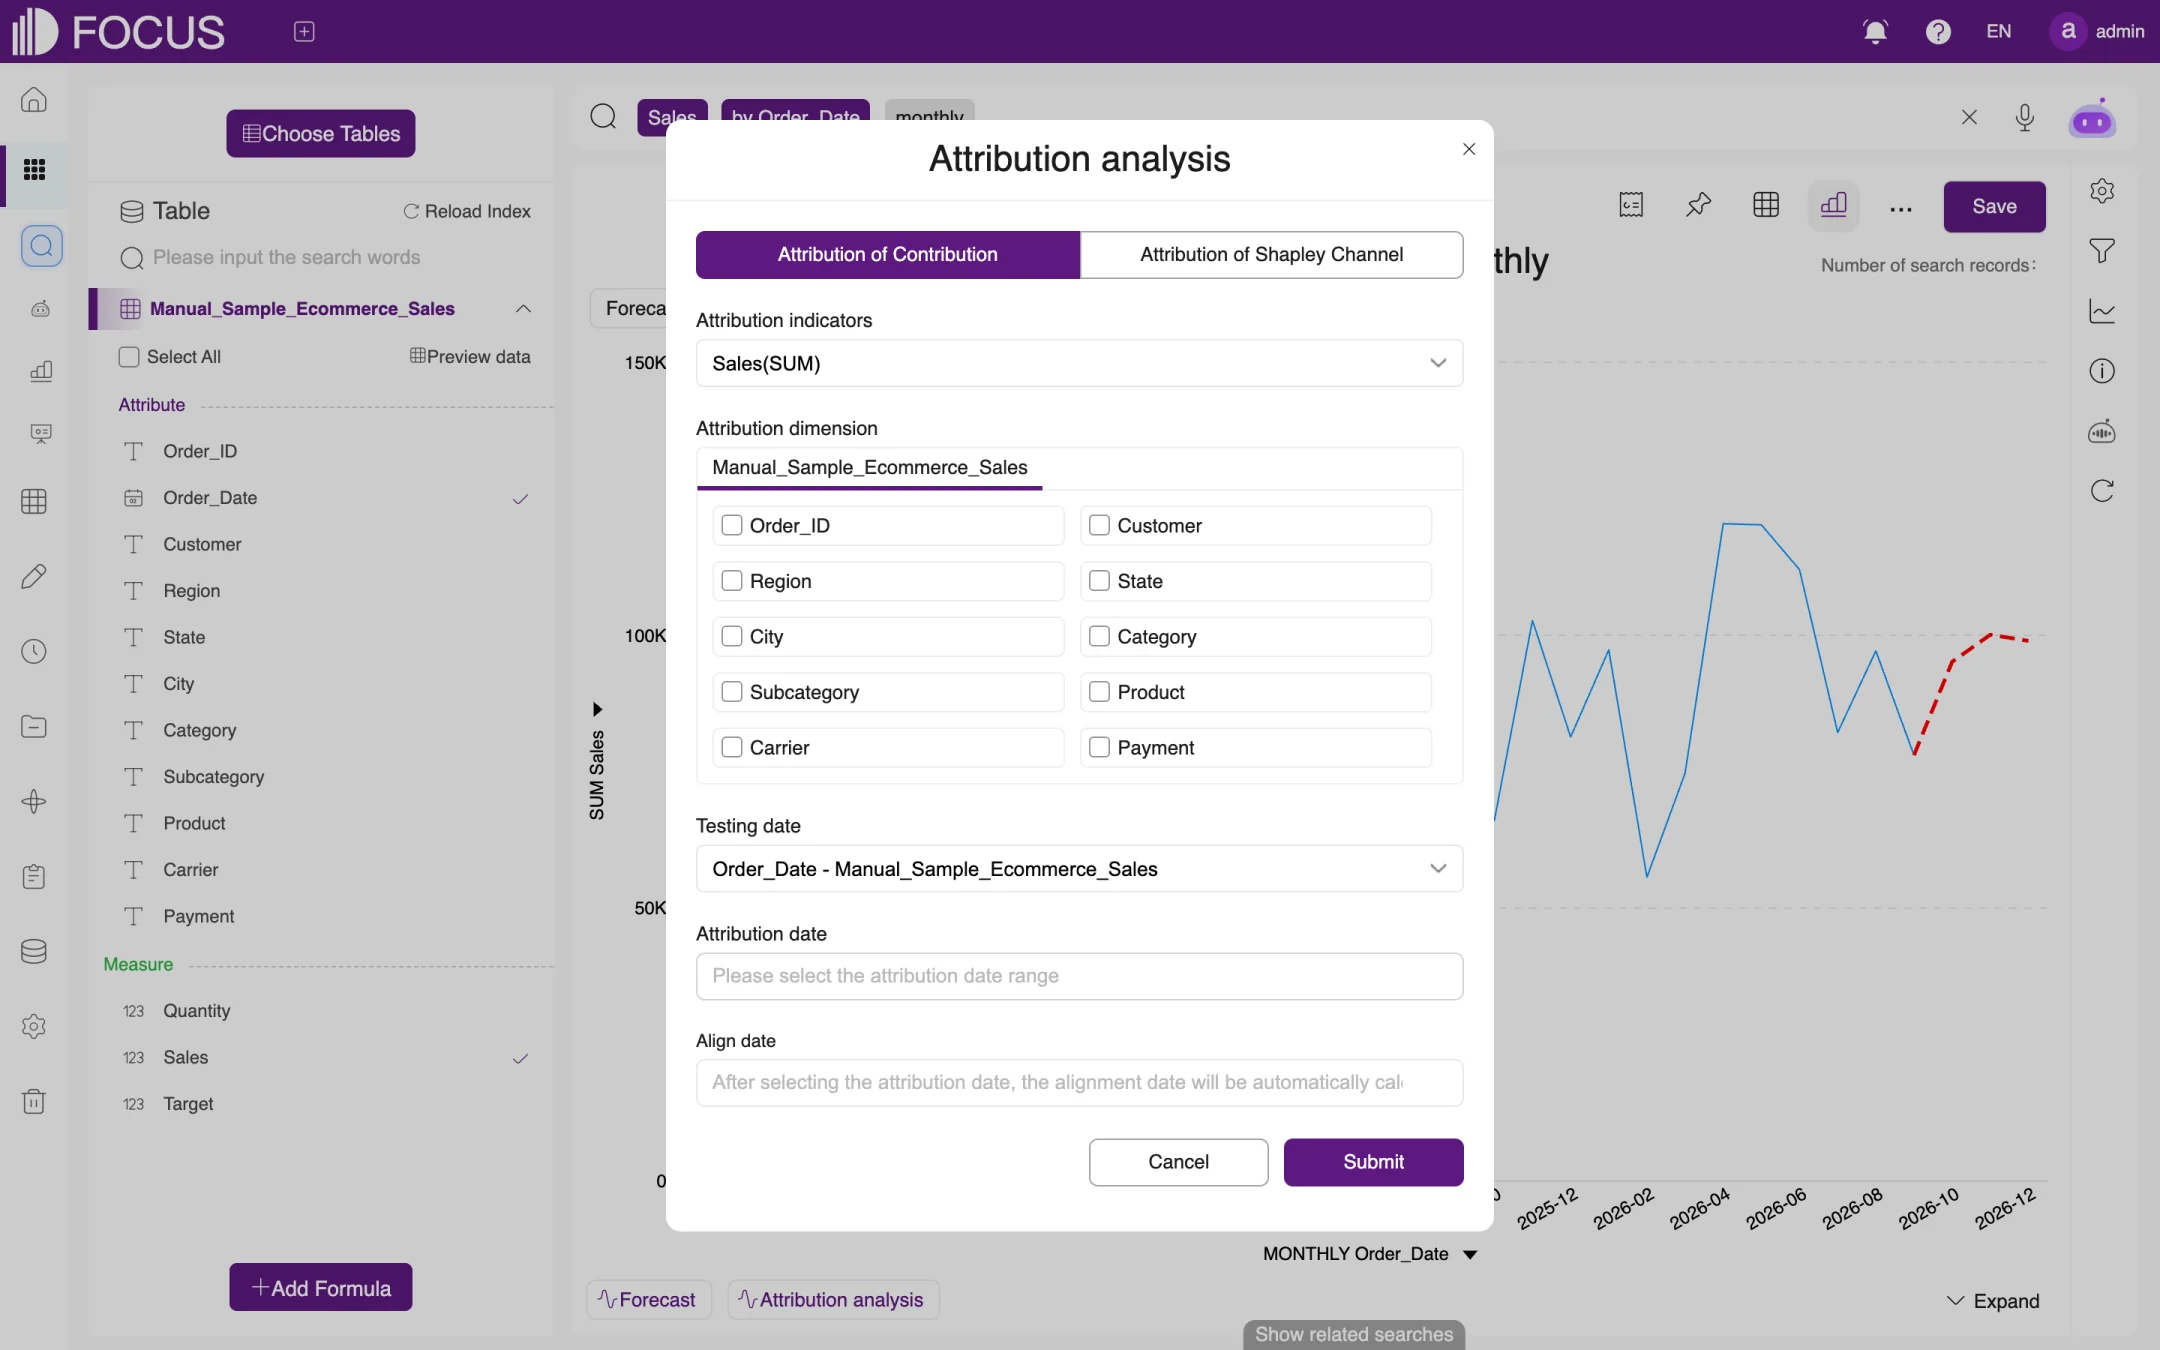
Click Attribution analysis at the bottom left of the result to open the Attribution analysis dialog, as shown in Figure 2-15. It offers two methods, Attribution of Contribution and Attribution of Shapley Channel:
Under Attribution indicators, choose the measure to analyze, for example Sales(SUM).
Under Attribution dimension, check the columns that may affect the measure, for example Subcategory, Region and Carrier.
Choose the Testing date and set the Attribution date range; the Align date range is then calculated automatically.
Click Submit. The system shows how much each dimension contributed to the change in the measure.
Figure 2-15. Attribution analysis
2.6Previewing data and adding formulas
2.6.1Preview data
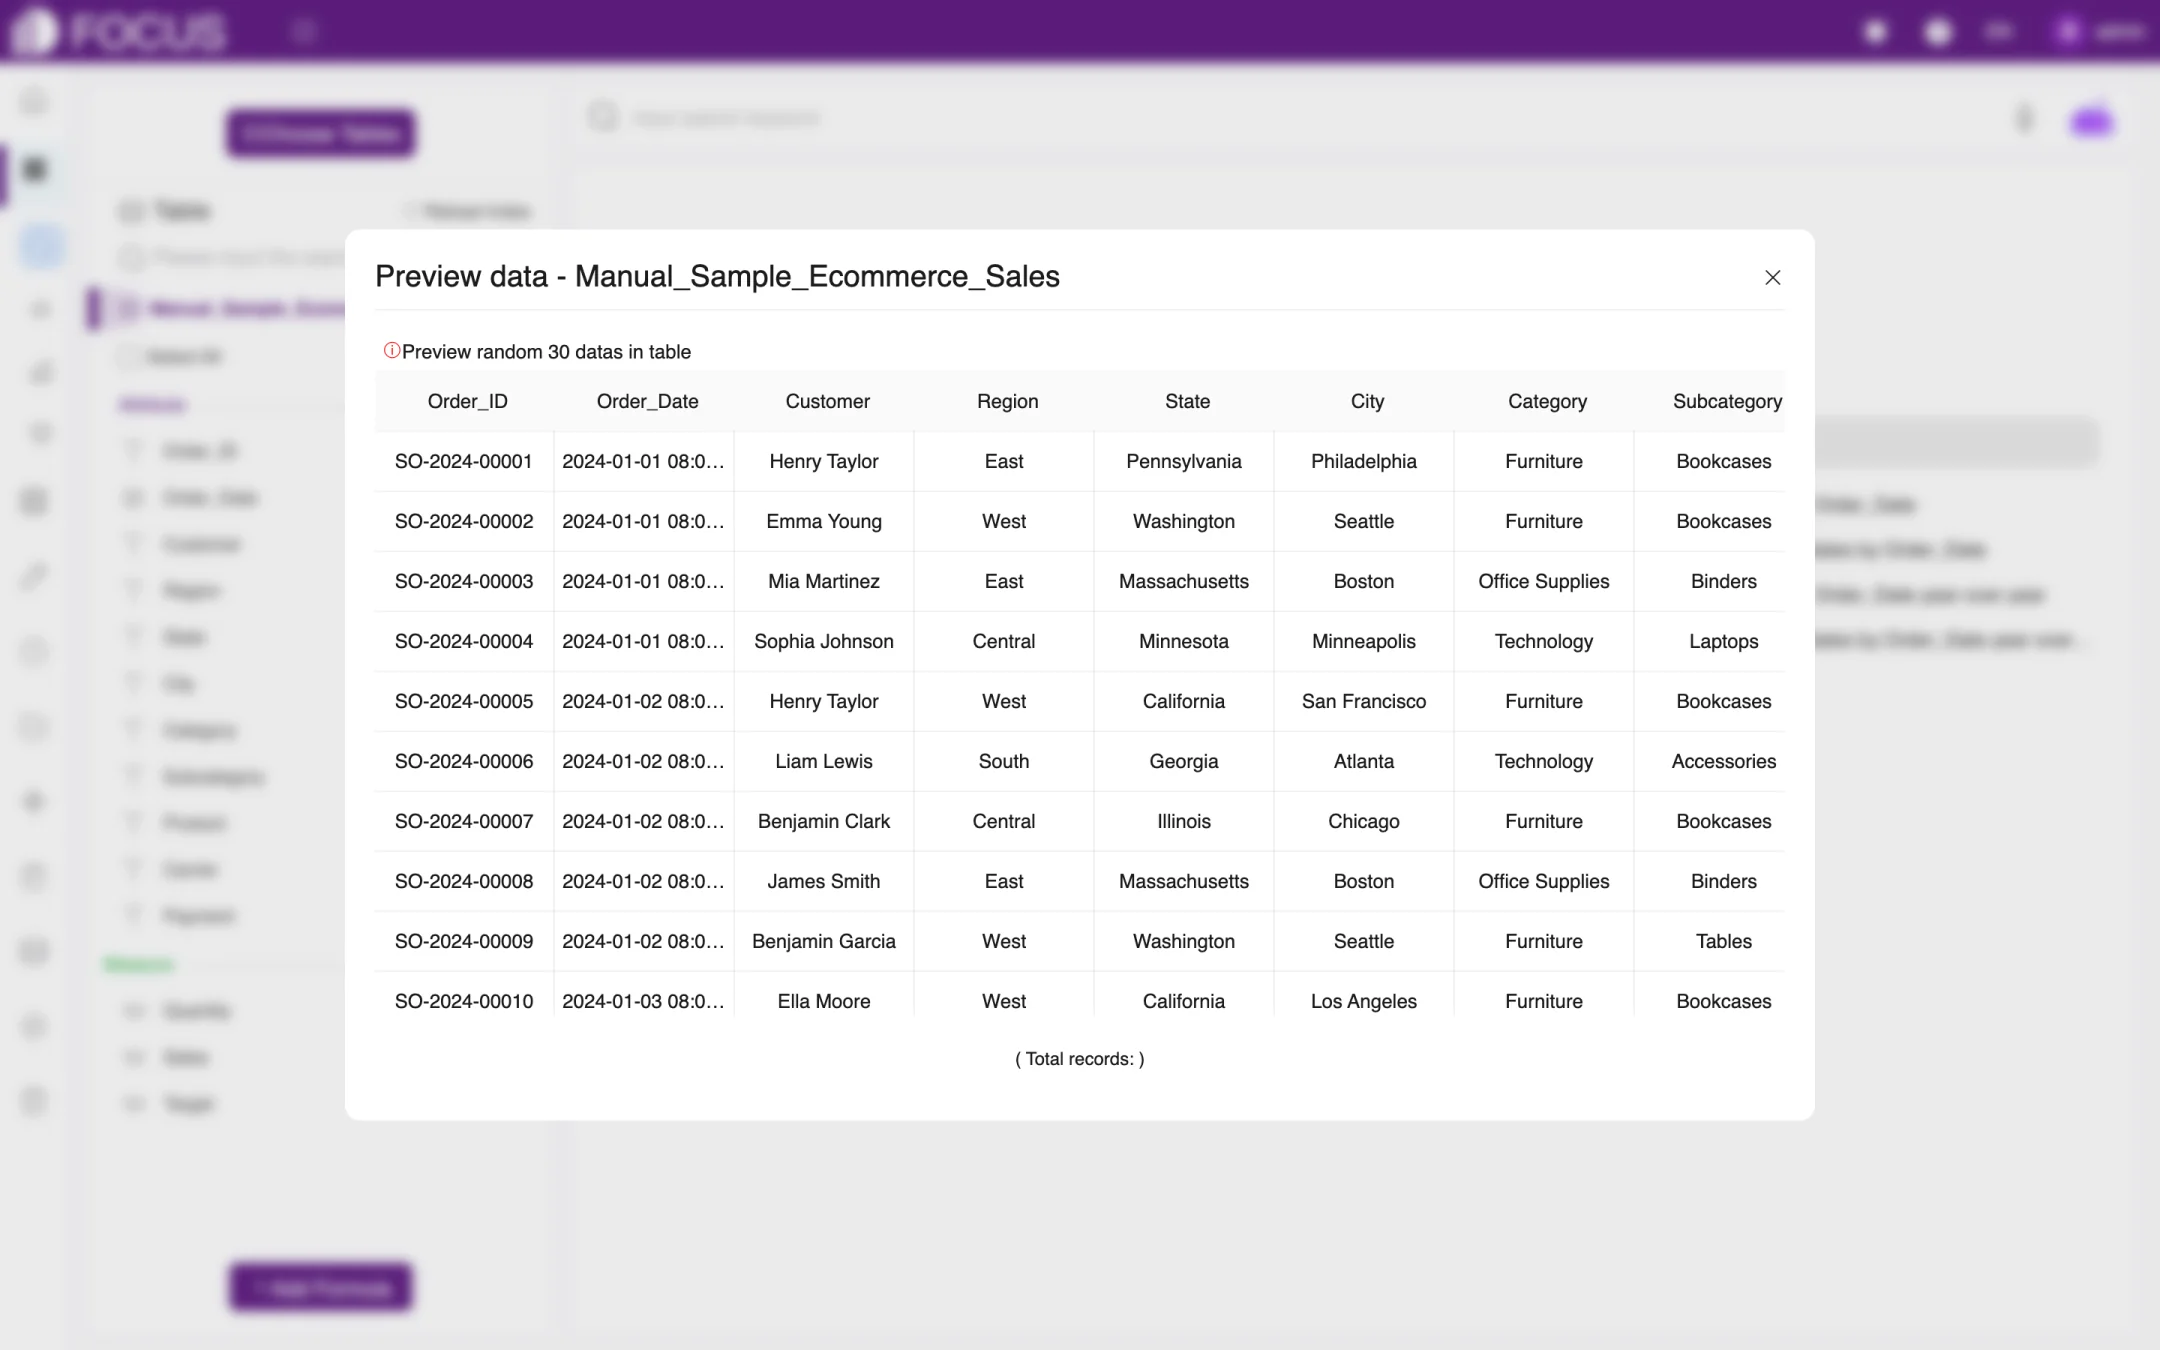
Click Preview data above the column list on the left to view rows picked at random from the current table (Preview random 30 datas in table), as shown in Figure 2-16.
Figure 2-16. Preview data
2.6.2Add a formula
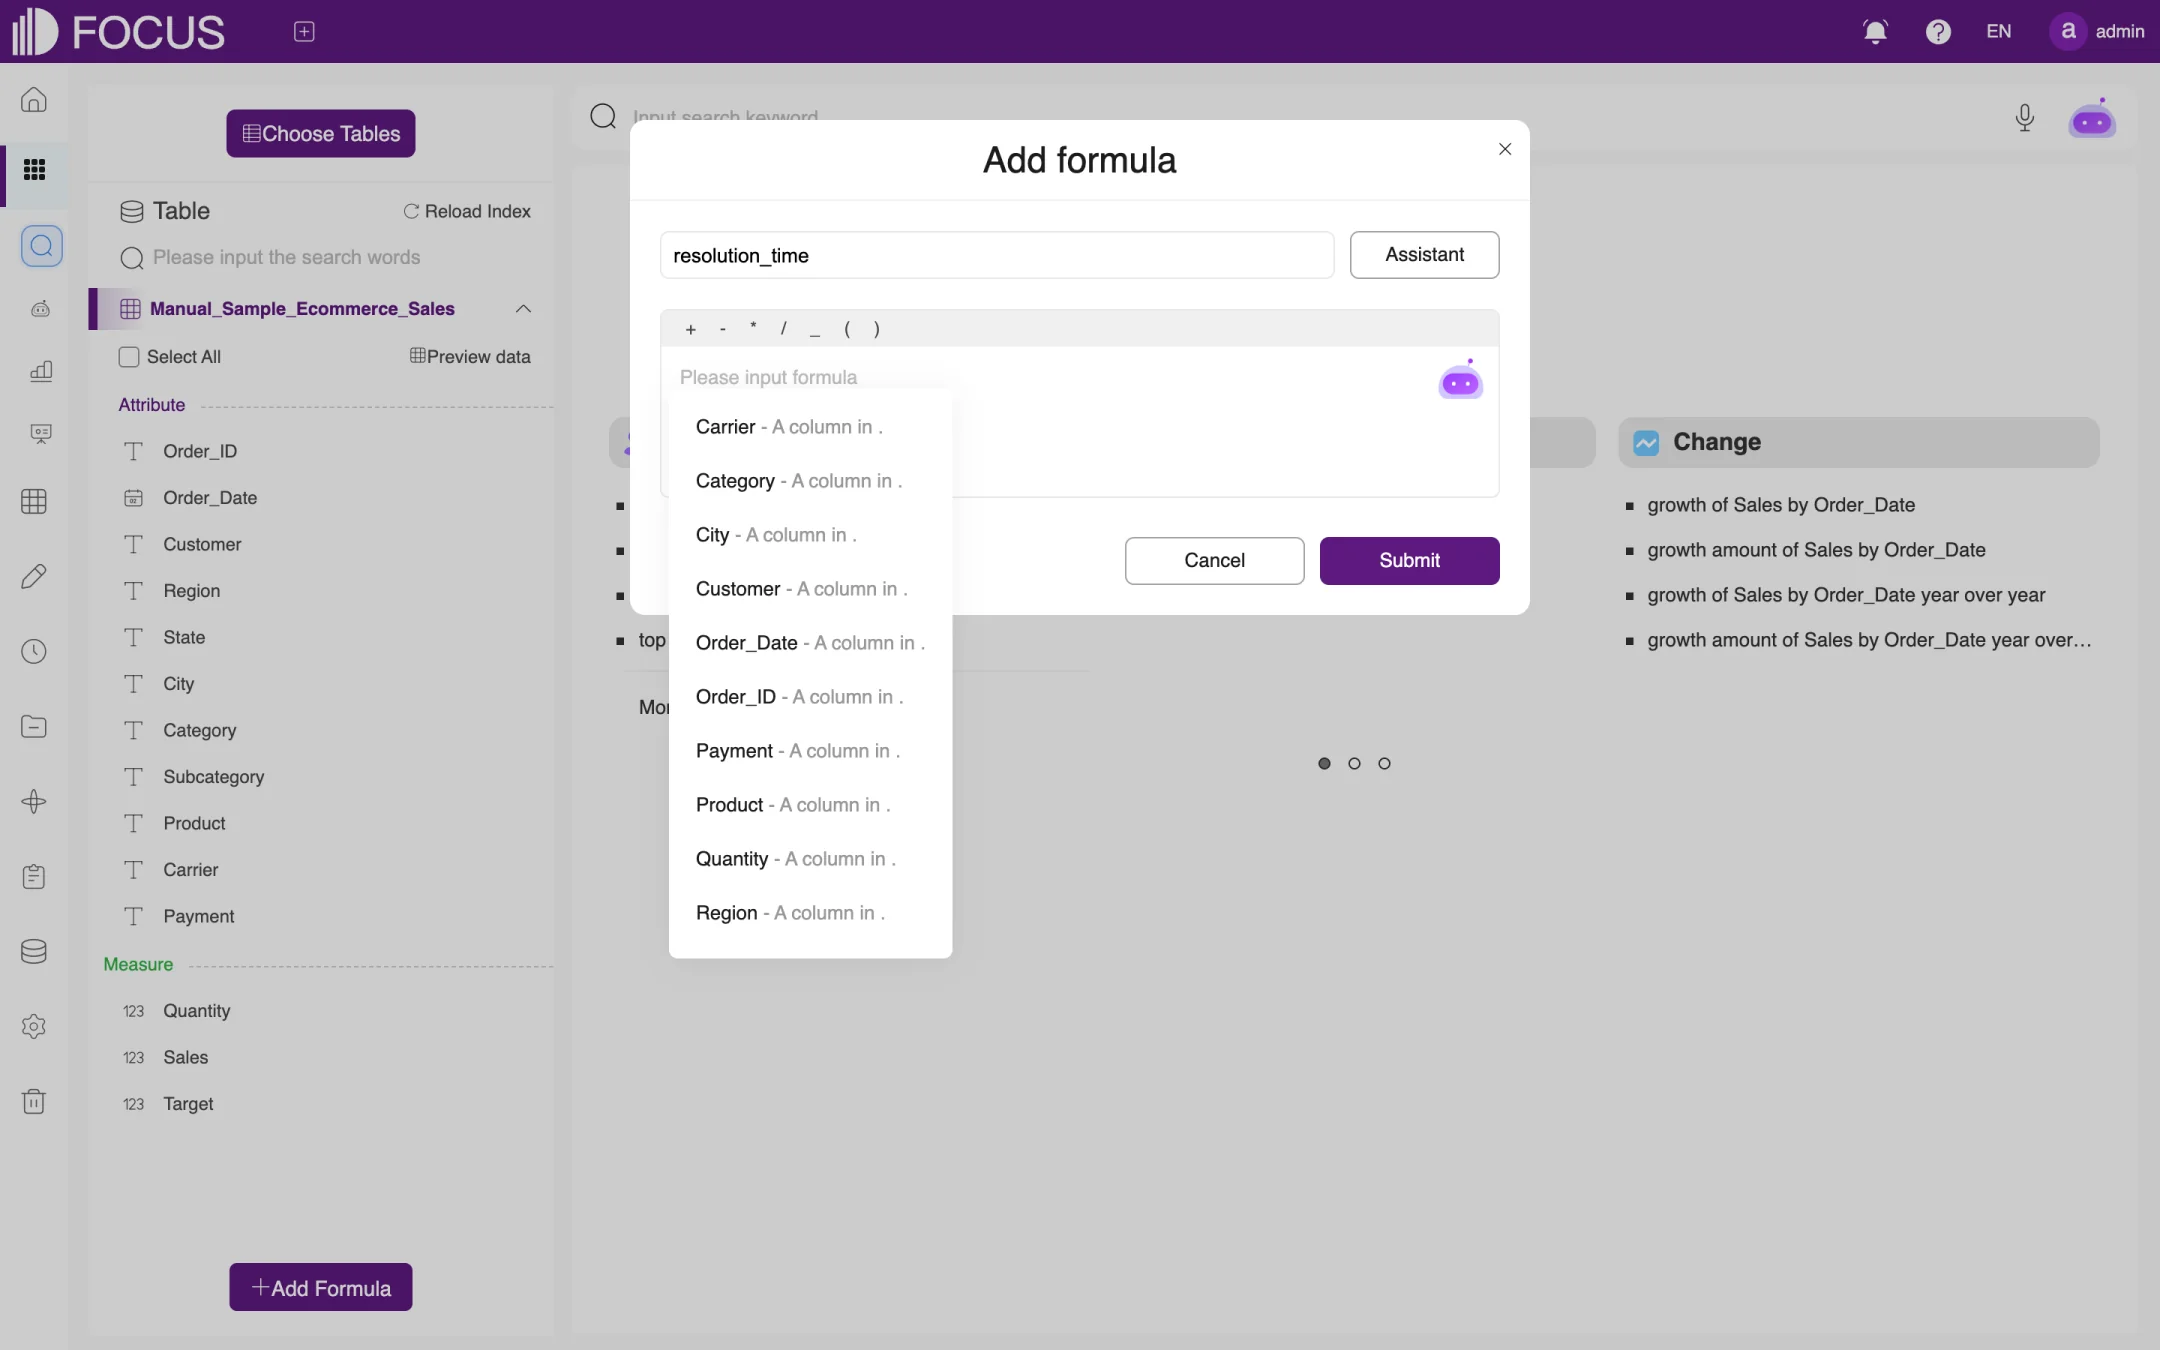
If your search needs a calculated value that the table does not contain, click Add Formula at the bottom left to open the Add formula dialog, as shown in Figure 2-17:
Enter a formula name in the box at the top.
Enter the expression in the formula box. You can use the operators above the box; as you type, the available columns and functions are listed below it, and you can click one to insert it. Click Assistant for descriptions of the functions.
Click Submit. The new formula appears in the column list on the left and can be searched like any other column.
Figure 2-17. Add formula
2.7Saving and adding to a pinboard
2.7.1Save as an answer
You can save a useful search result and open it again later:
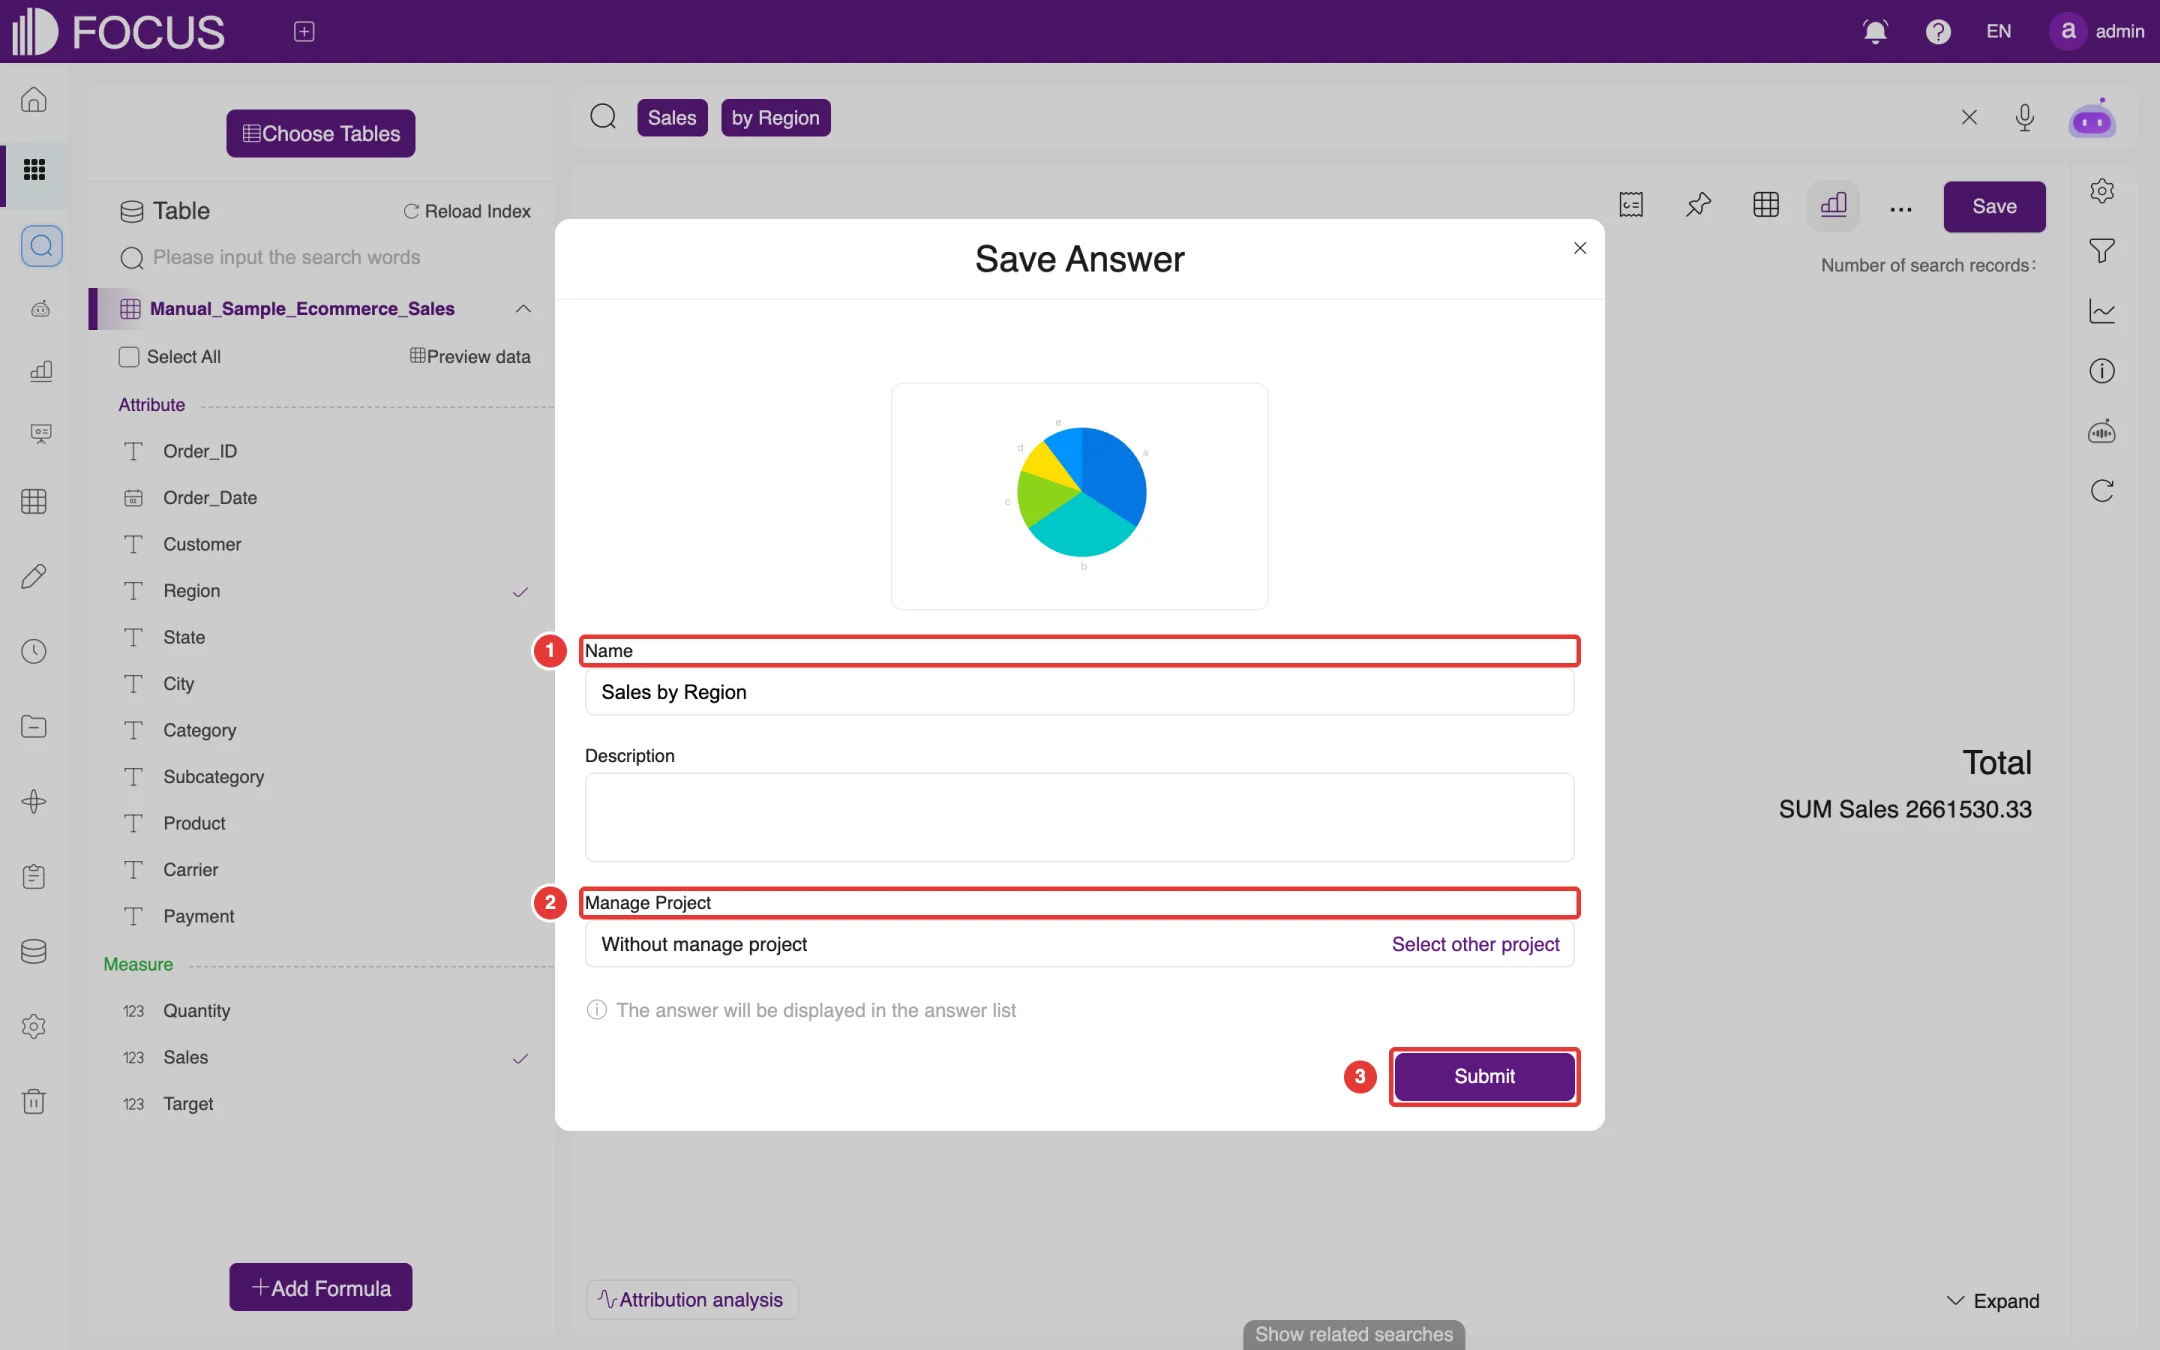
Click Save in the toolbar to open the Save Answer dialog, as shown in Figure 2-18.
Enter a name at ① Name (the search statement by default). You can also add a Description.
Under ② Manage Project, click Select other project to put the answer in a project (for projects, see Chapter 9). If you do not choose one, it stays Without manage project.
Click Submit at ③. When the answer has been saved, the system shows "Save the answer successfully", and you can click Jump to view in project.
Figure 2-18. Save Answer
Saved answers are managed on the Answer page (BI Workspace > Answer History); see Chapter 4.
2.7.2Add to a pinboard
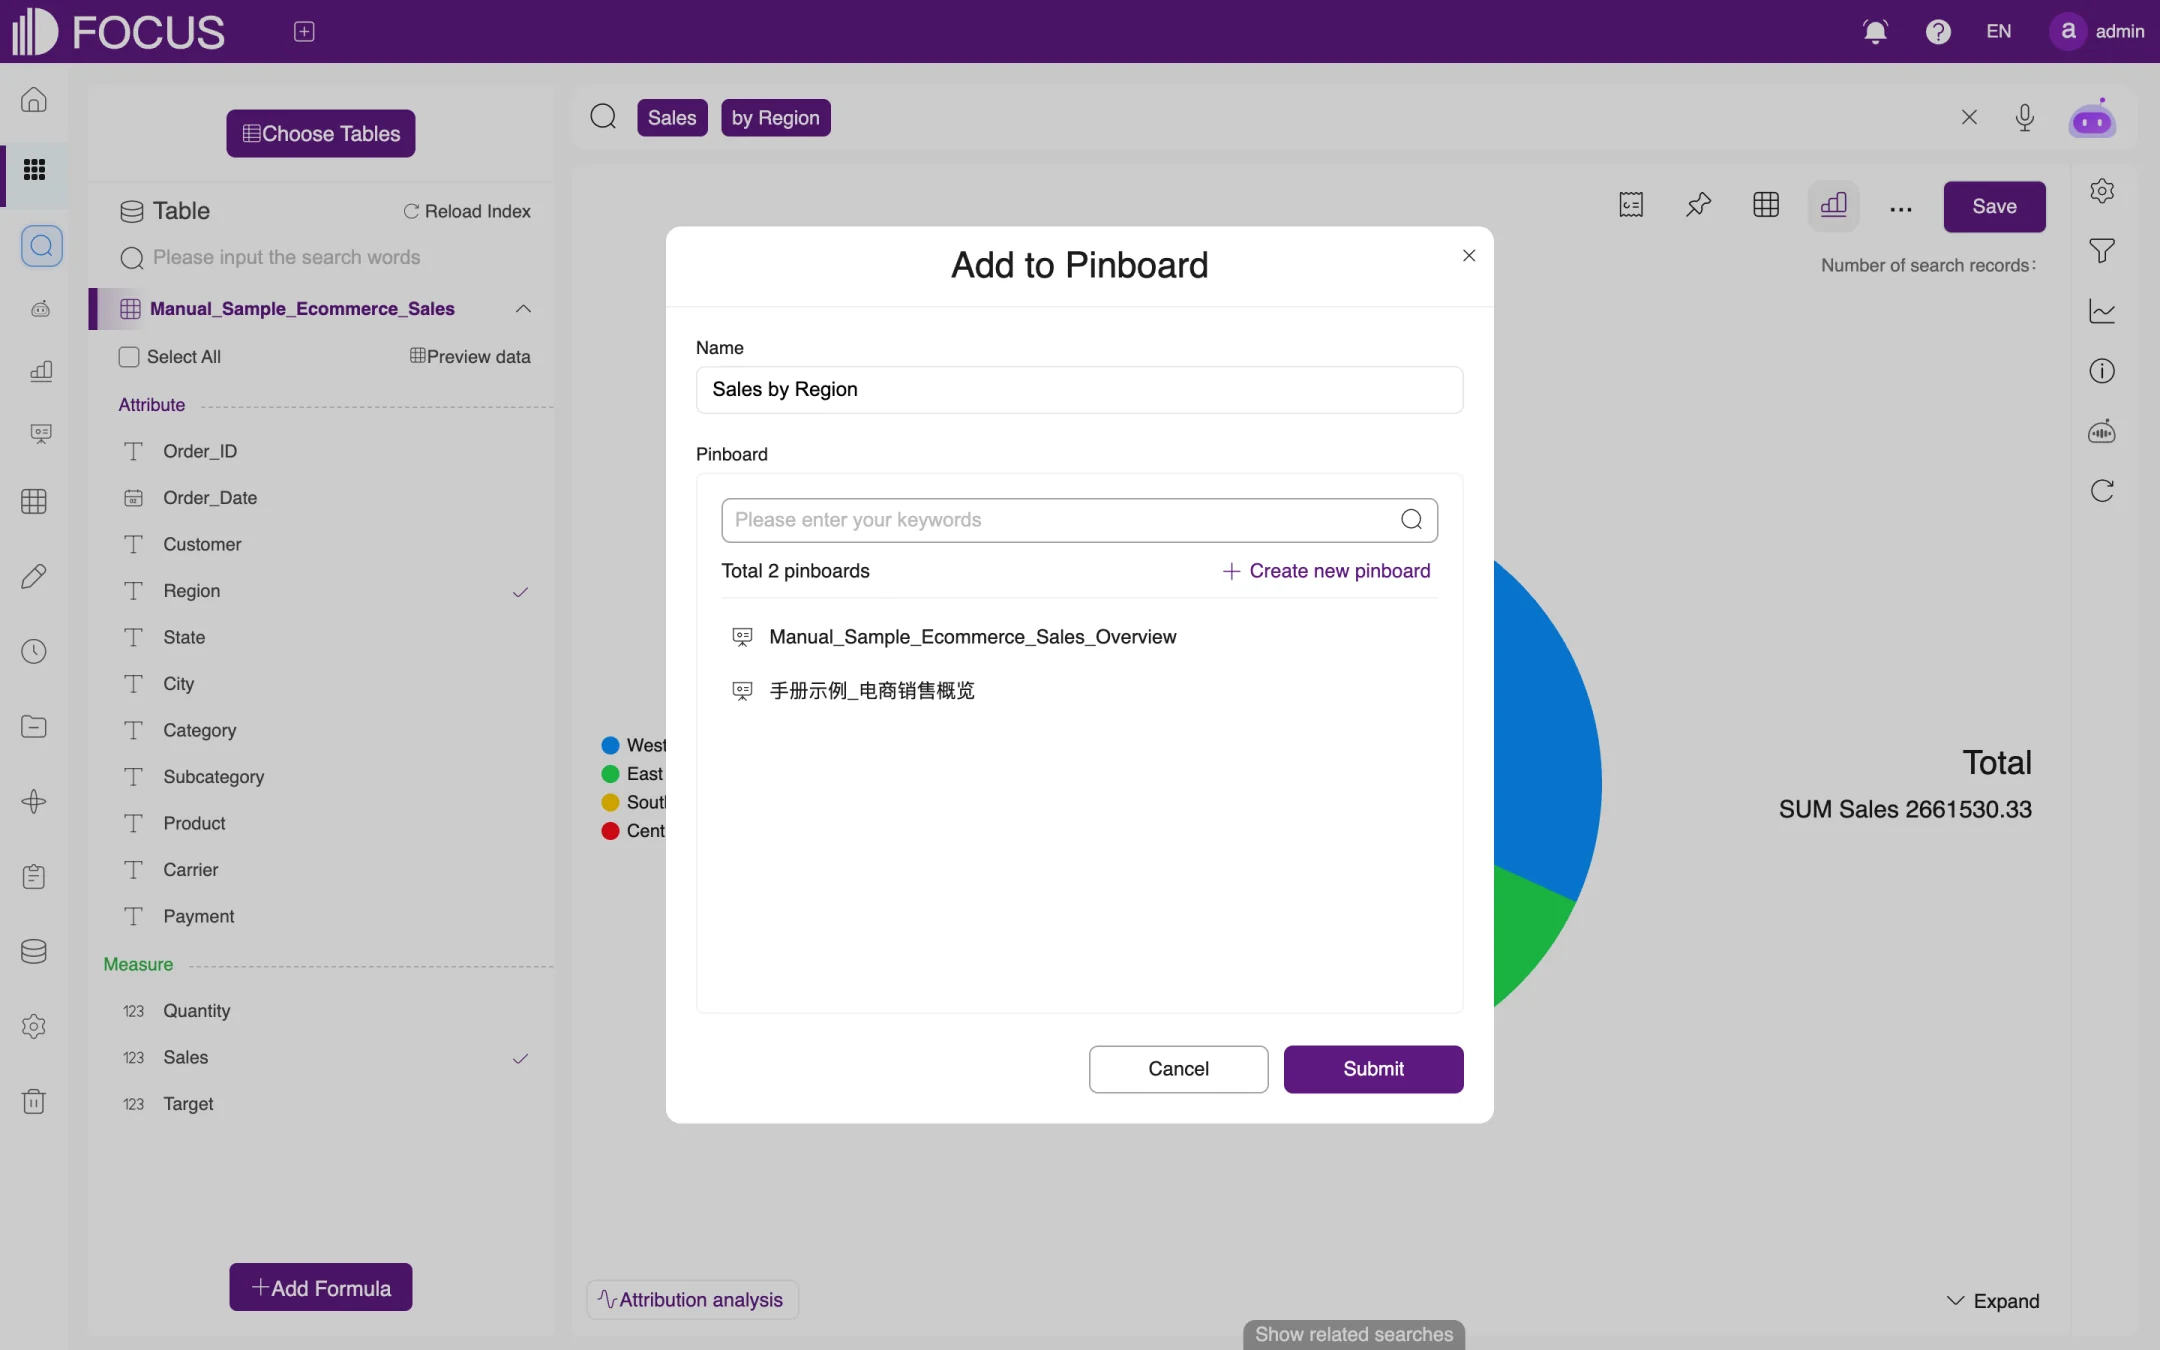
Click Add to pinboard in the toolbar to open the Add to Pinboard dialog, as shown in Figure 2-19:
Enter a Name. This is the title the chart shows on the pinboard.
In the Pinboard list, choose an existing pinboard. If you do not have one yet, click Create new pinboard to create one.
Click Submit.
Figure 2-19. Add to Pinboard
For how to use pinboards, see Chapter 5.
Chapter 3FocusGPT
FocusGPT is the AI assistant you chat with on the Smart Q&A page to analyze data in a conversation. You don't need to remember column names or keywords: ask in everyday language, and FocusGPT works out what you mean, picks the data and returns the analysis. FocusGPT can also write analysis reports for you.
In the left menu bar, expand BI Workspace and click Smart Q&A to open this page.
3.1Page overview
The page has a chat list on the left and a chat area on the right:
New Session (top left): starts a new conversation.
Session list (below New Session): lists your earlier chats with their titles and dates. Use the search box at the top of the list to find a chat by keyword; click a chat to continue it.
Input box (in the chat area, with the placeholder Send message): type your question here and press Enter, or click the send button at its bottom right. The microphone icon on the left lets you ask by voice, and the paperclip icon on the right adds an attachment.
Research reports (below the input box): choose the report mode, Standard or Deep (compatibility mode); see Section 3.3.
My Knowledge Base (bottom left): manage the business knowledge you have added for FocusGPT; see Section 3.4.
My analysis report (bottom left, next to My Knowledge Base): view the analysis reports FocusGPT has generated for you; see Section 3.5.
3.2Ask FocusGPT a question
Click New Session, type a question in the input box, for example Please total Sales by Region in Manual_Sample_Ecommerce_Sales, show a column chart, and tell me which region is highest., and press Enter.
FocusGPT first chooses the data table to use and shows its progress while it loads the table. If it cannot tell which table to use, it lists the likely tables for you to choose from; click one.
Wait while FocusGPT queries the data; this usually takes a minute or two. Its reply includes a line telling you how it parsed your input, so you can check whether it understood the question, followed by the result.
You can keep asking follow-up questions in the same chat. Click the thumbs-up or thumbs-down icon below an answer to let FocusGPT know whether it helped.
Tip: Include specific measures, dimensions and time ranges in your question, for example "How did each region perform against its sales target in 2025?", and FocusGPT's answers will be more accurate. As the reminder at the bottom of the page says ("Content is generated by AI, please carefully identify it"), check important conclusions in Data Search.
3.3Research reports
When you need a complete analysis report, choose a mode under Research reports below the input box, then describe the report you need:
Standard: generates a regular analysis report;
Deep (compatibility mode): runs a deeper, multi-step analysis and takes longer.
You can view the generated reports in My analysis report.
3.4My Knowledge Base
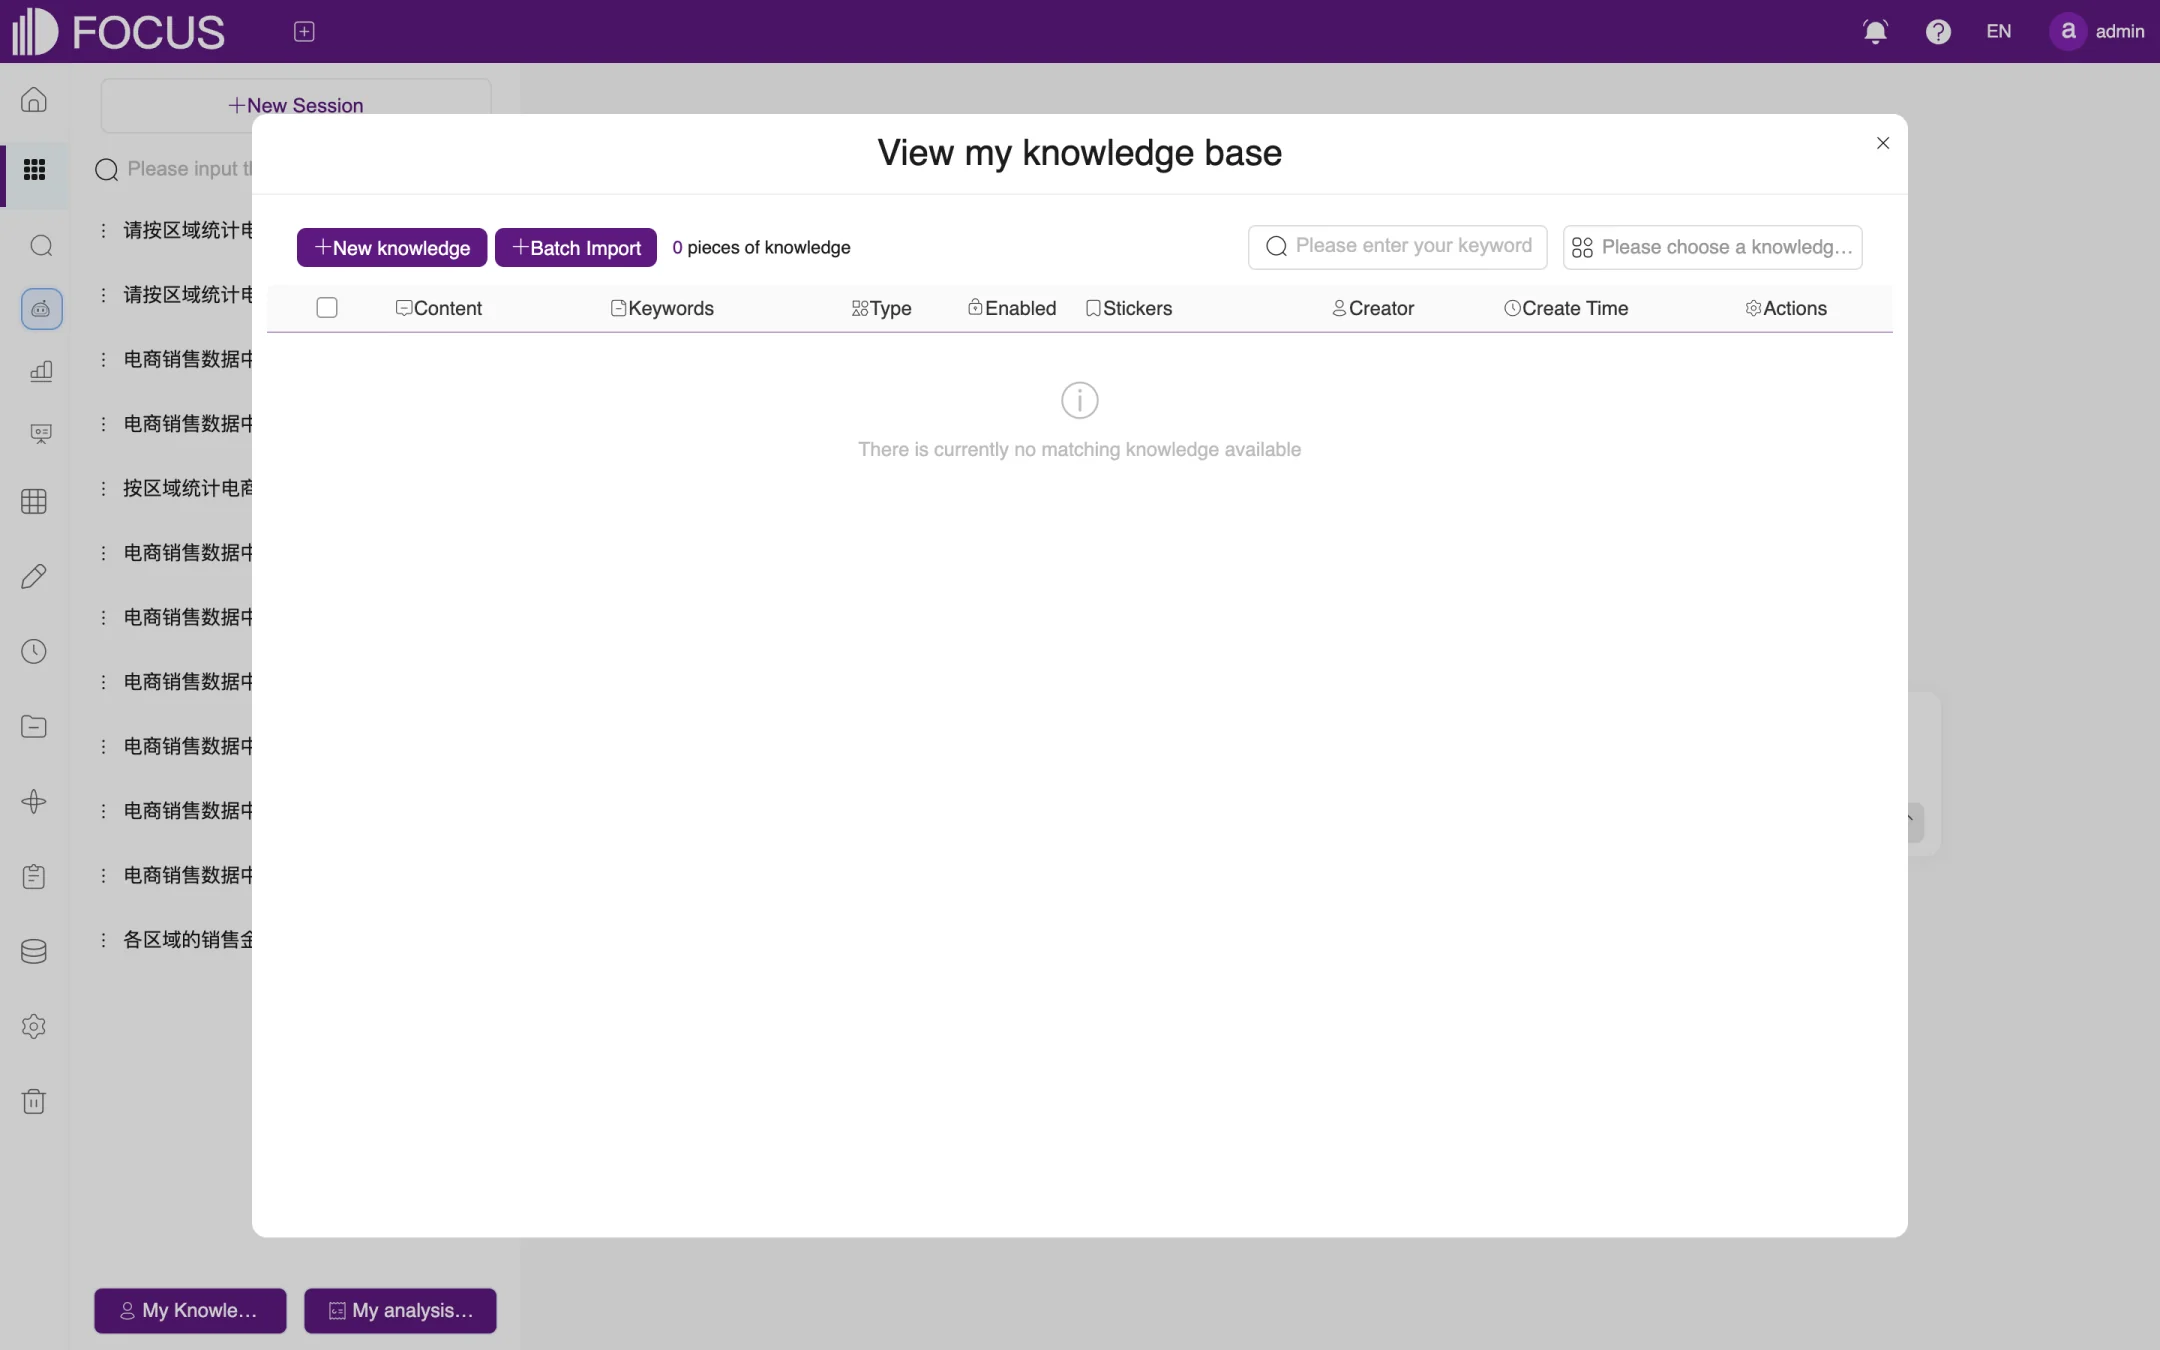
Click My Knowledge Base at the bottom left of the page to open the View my knowledge base window, as shown in Figure 3-1. Here you can tell FocusGPT about business definitions, terminology and other knowledge:
Click New knowledge to add items one at a time, or Batch Import to import many at once.
Each item has its content, keywords, type and category (the Content, Keywords, Type and Stickers columns), and you can choose whether it is enabled (Enabled).
To find existing knowledge, use the keyword box or the knowledge category box at the top right.
Figure 3-1. My Knowledge Base
System administrators can manage knowledge shared across the whole system under Admin > Knowledge; see Chapter 13.
3.5My analysis report
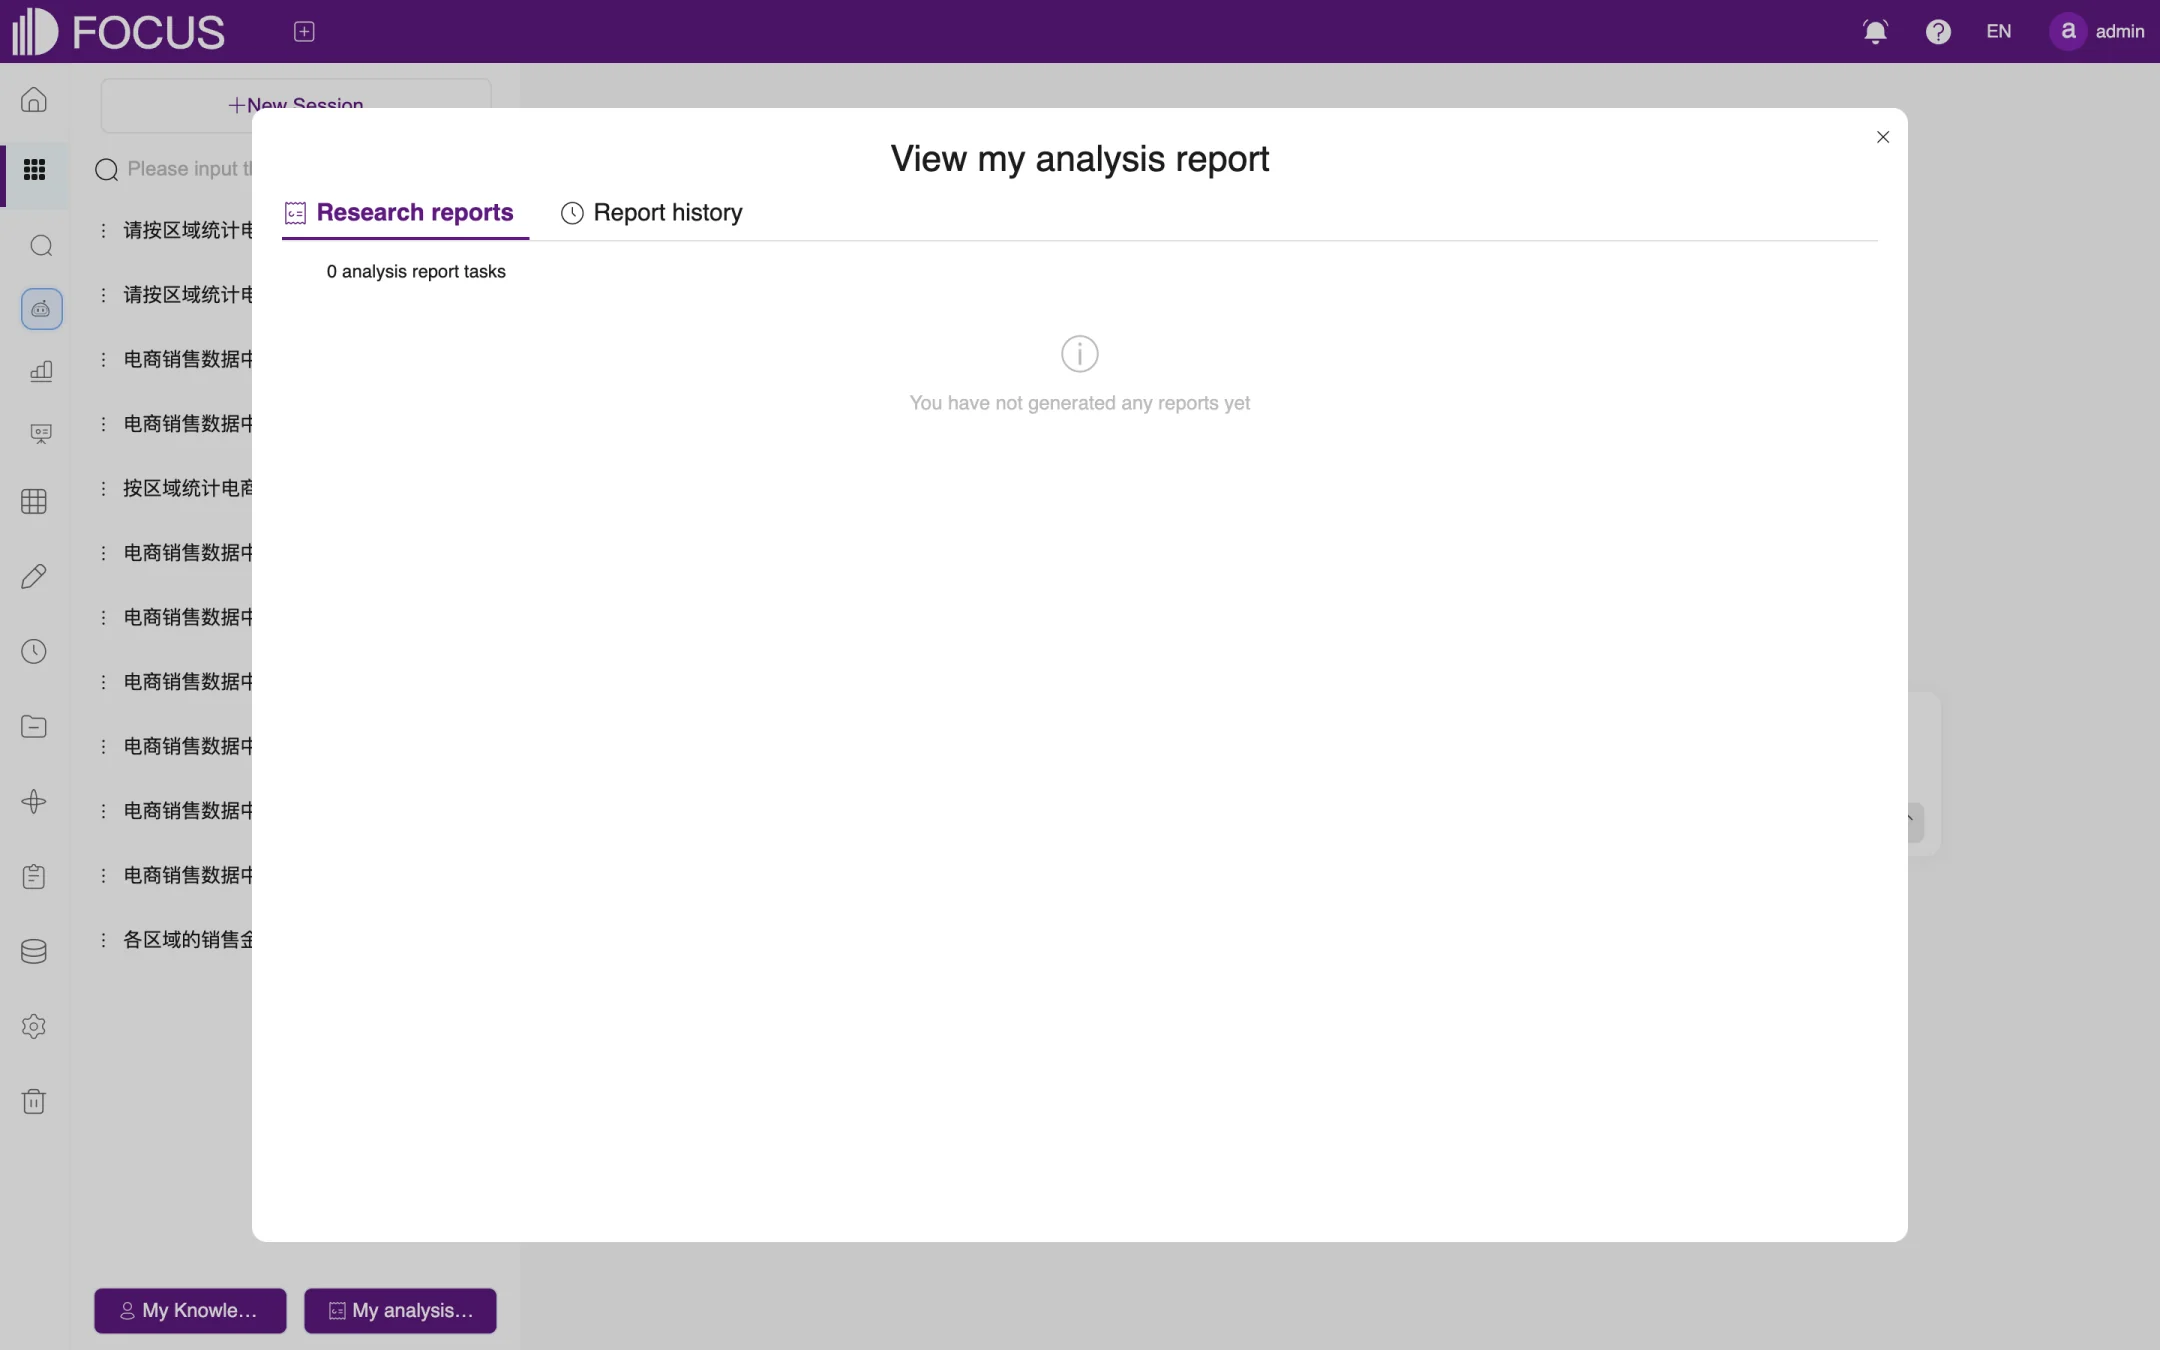
Click My analysis report at the bottom left of the page to open the View my analysis report window, as shown in Figure 3-2. The Research reports tab lists report tasks that are in progress or finished, and the Report history tab lists earlier reports.
Figure 3-2. My analysis reports
Chapter 4Answers
A saved search result is called an answer. An answer records its data source, search statement and chart settings, and it is recalculated with the latest data every time you open it. You can therefore use answers as regular reports, add them to pinboards, share them with colleagues or send them on a schedule.
In the left menu bar, expand BI Workspace and click Answer History to open the answer list.
4.1Answer list
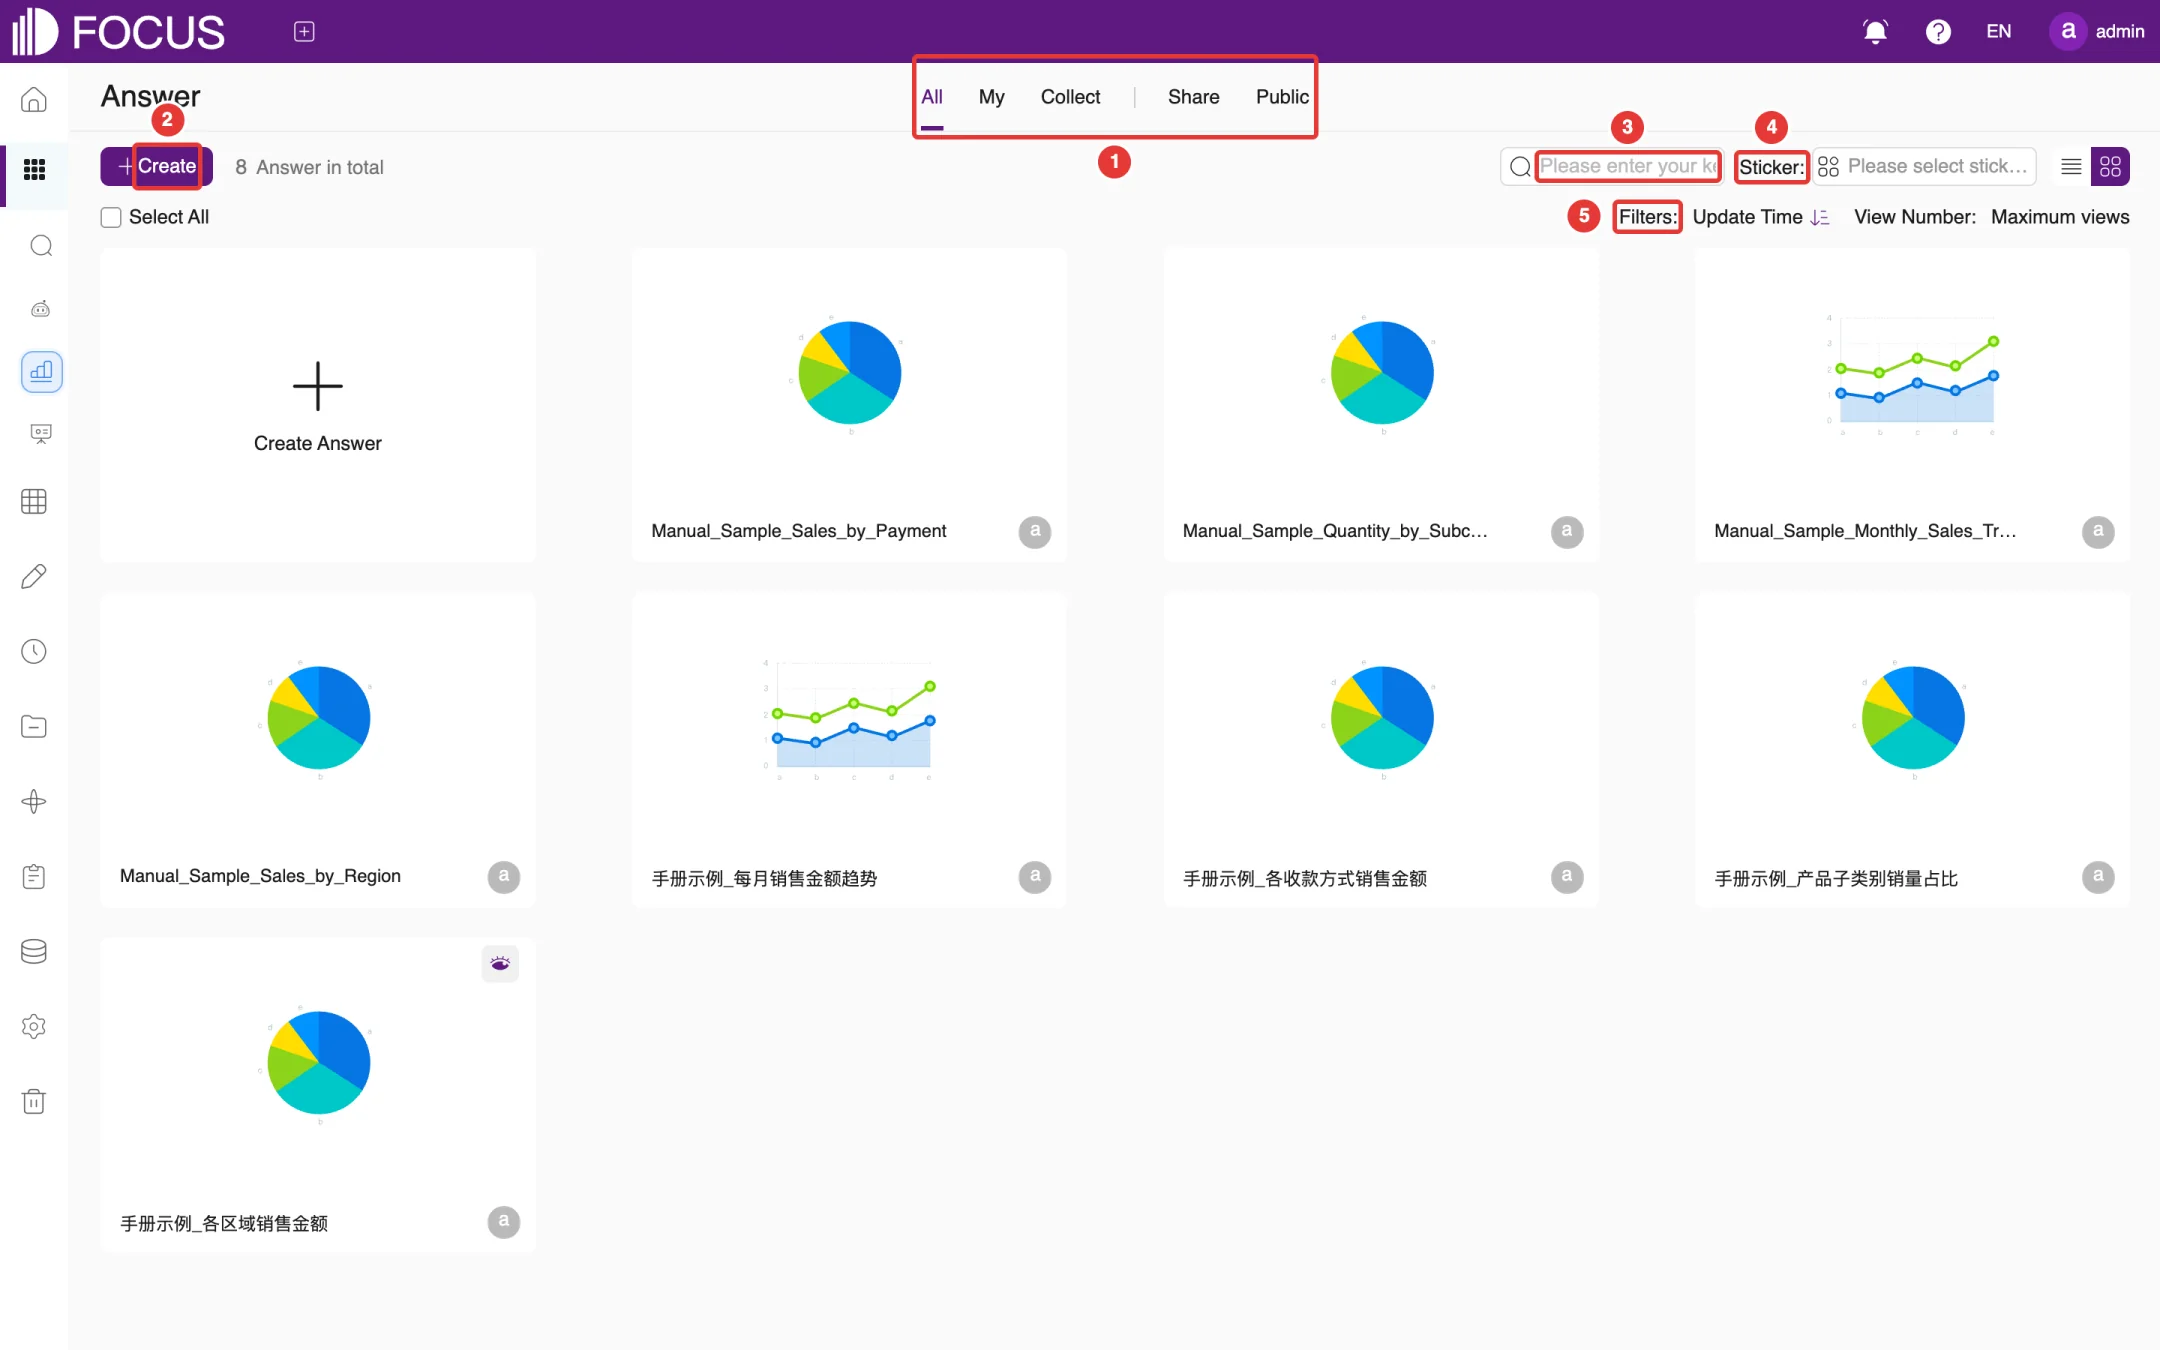
The answer list shows all answers as cards, as shown in Figure 4-1:
① Tabs: All, My, Collect, Share and Public show all answers, the answers you created, the ones you have collected (bookmarked), the ones other users shared with you, and the public ones.
② Create: creates a new answer by taking you to the Data Search page.
③ Search box: finds answers by name.
④ Sticker: filters answers by sticker (tag).
⑤ Filters: sorts the cards by Update Time or View Number.
Figure 4-1. The answer list
4.2Answer actions
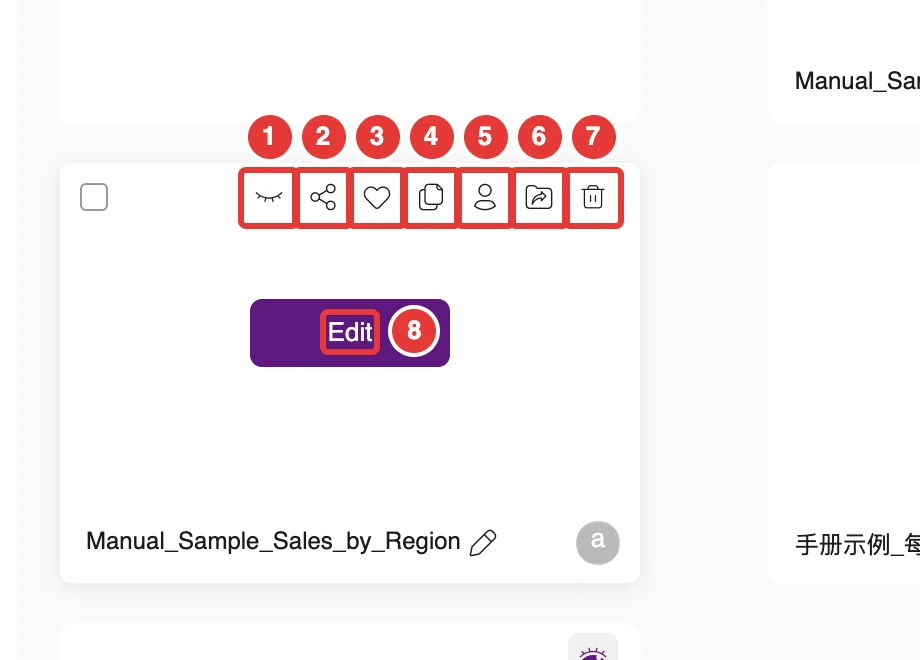
Hover over an answer card: a row of action buttons appears at the top of the card and an Edit button in the middle, as shown in Figure 4-2:
No.
Button
What it does
①
Public
Makes the answer public, so that all users can see it on the Public tab; click it again (Cancel Public) to make the answer private
②
Share
Creates an outside link or shares the answer with other users; see Section 4.4
③
Collect
Bookmarks the answer so you can find it quickly on the Collect tab
④
Copy
Makes a copy of the answer
⑤
Change owner
Hands the answer over to another user
⑥
Move
Moves the answer into a project
⑦
Delete
Deletes the answer
⑧
Edit
Opens the answer so you can view and change it
Figure 4-2. Action buttons on an answer card
To rename an answer, click the pencil icon to the right of its name on the card.
4.3Viewing and changing an answer
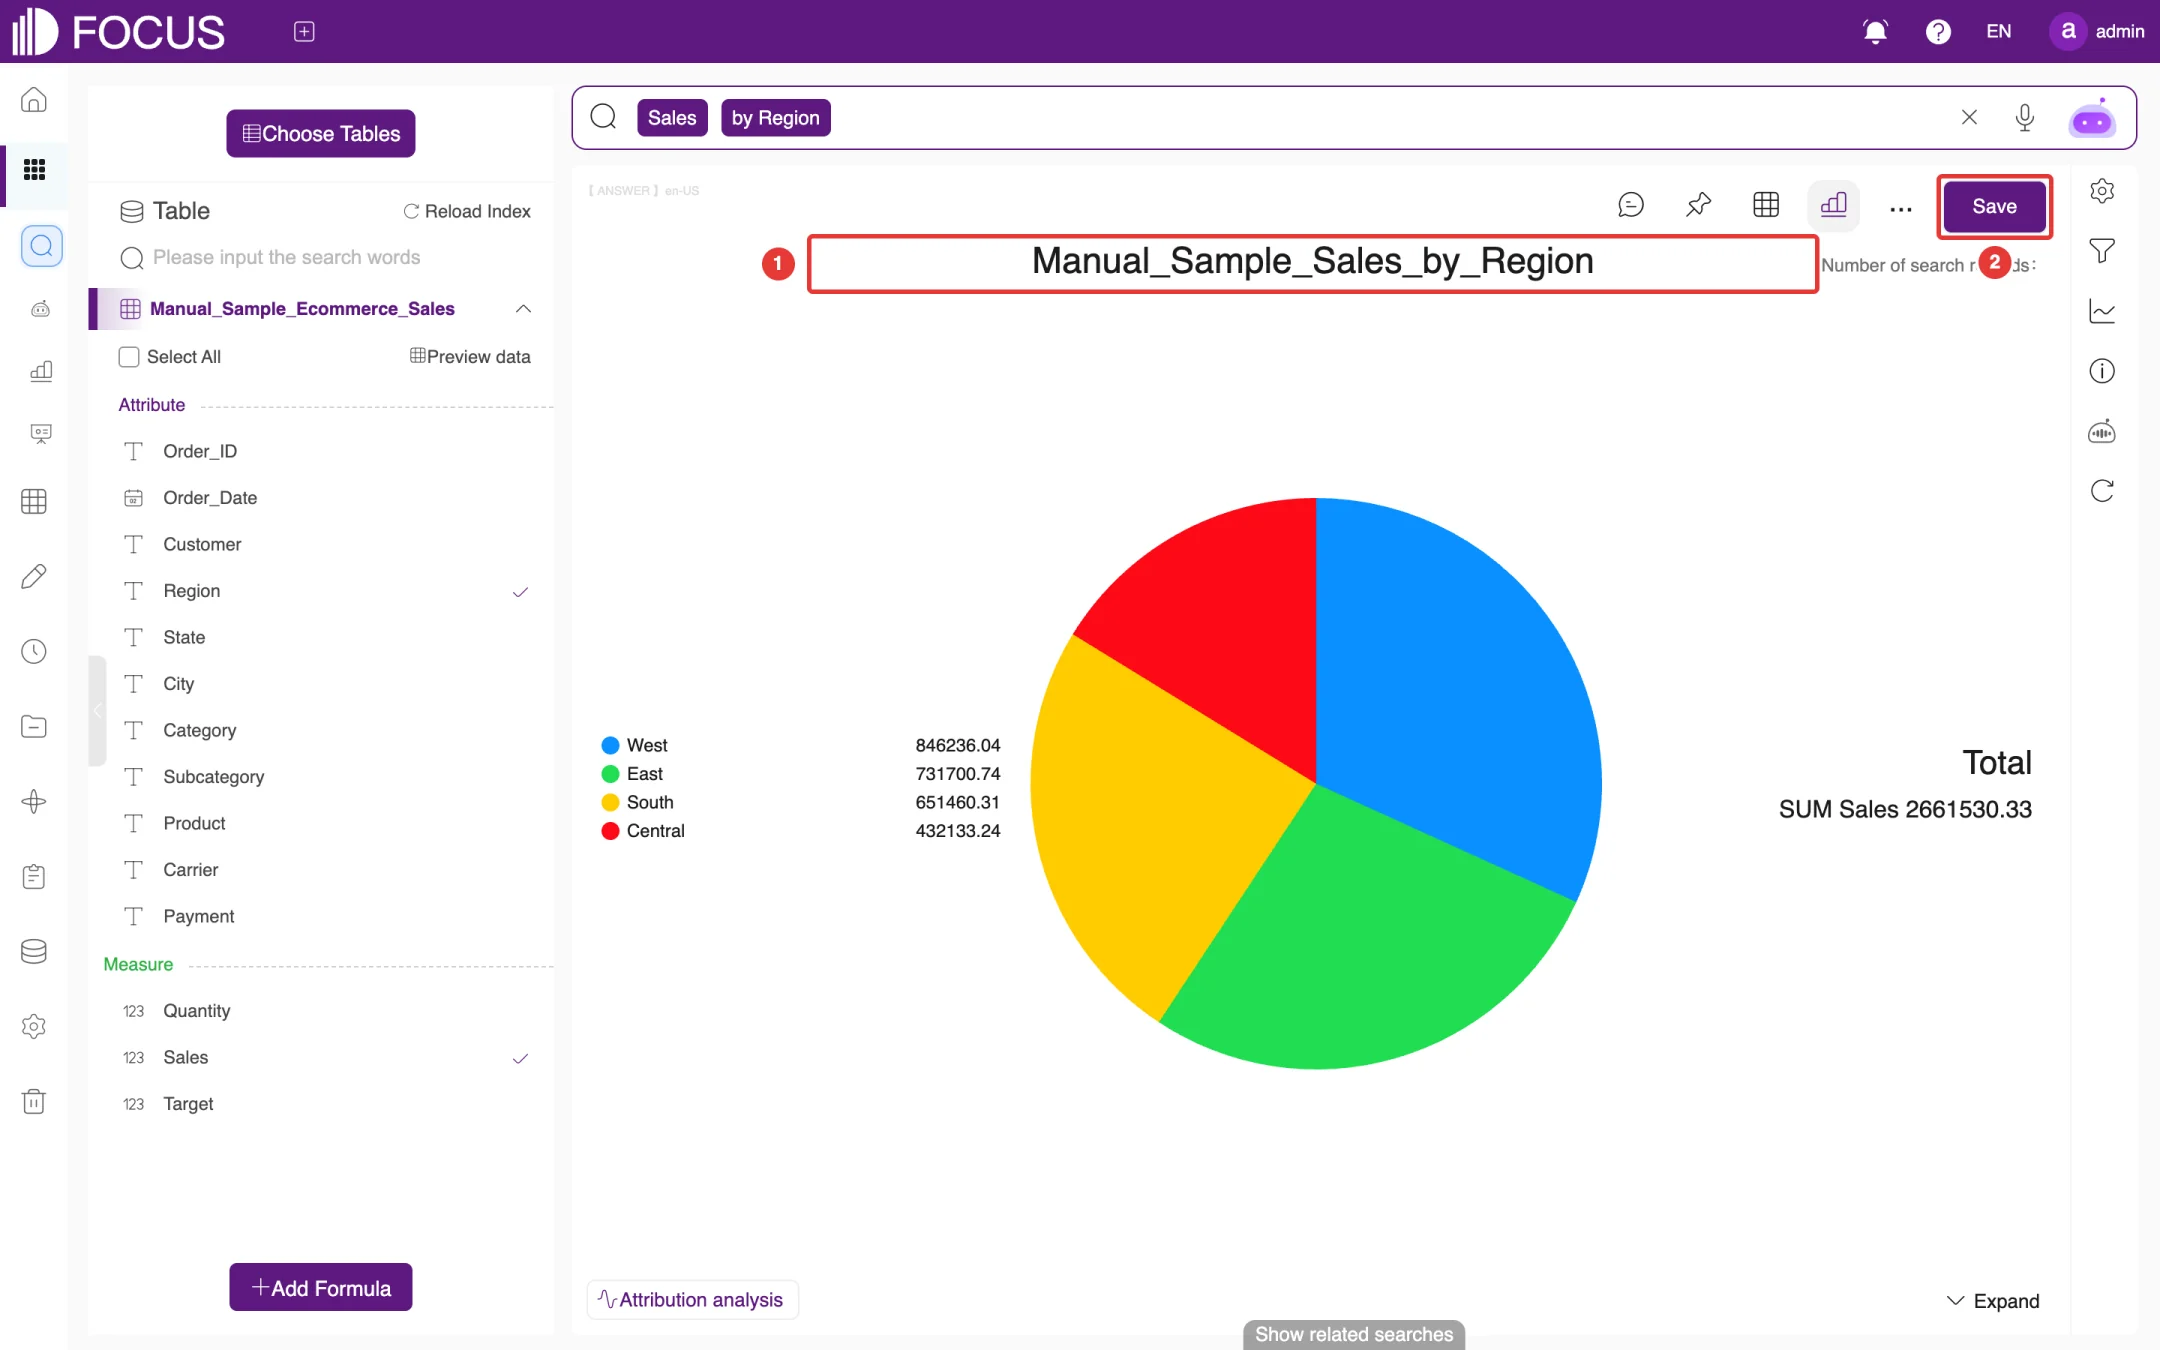
Click Edit on an answer card to open the answer, as shown in Figure 4-3. The title at ① is the answer name.
The open answer works just like Data Search: you can change the search statement, switch charts and adjust settings; see Chapter 2.
When you have finished, click Save at ② to overwrite the answer.
Figure 4-3. An open answer
4.3.1Comments
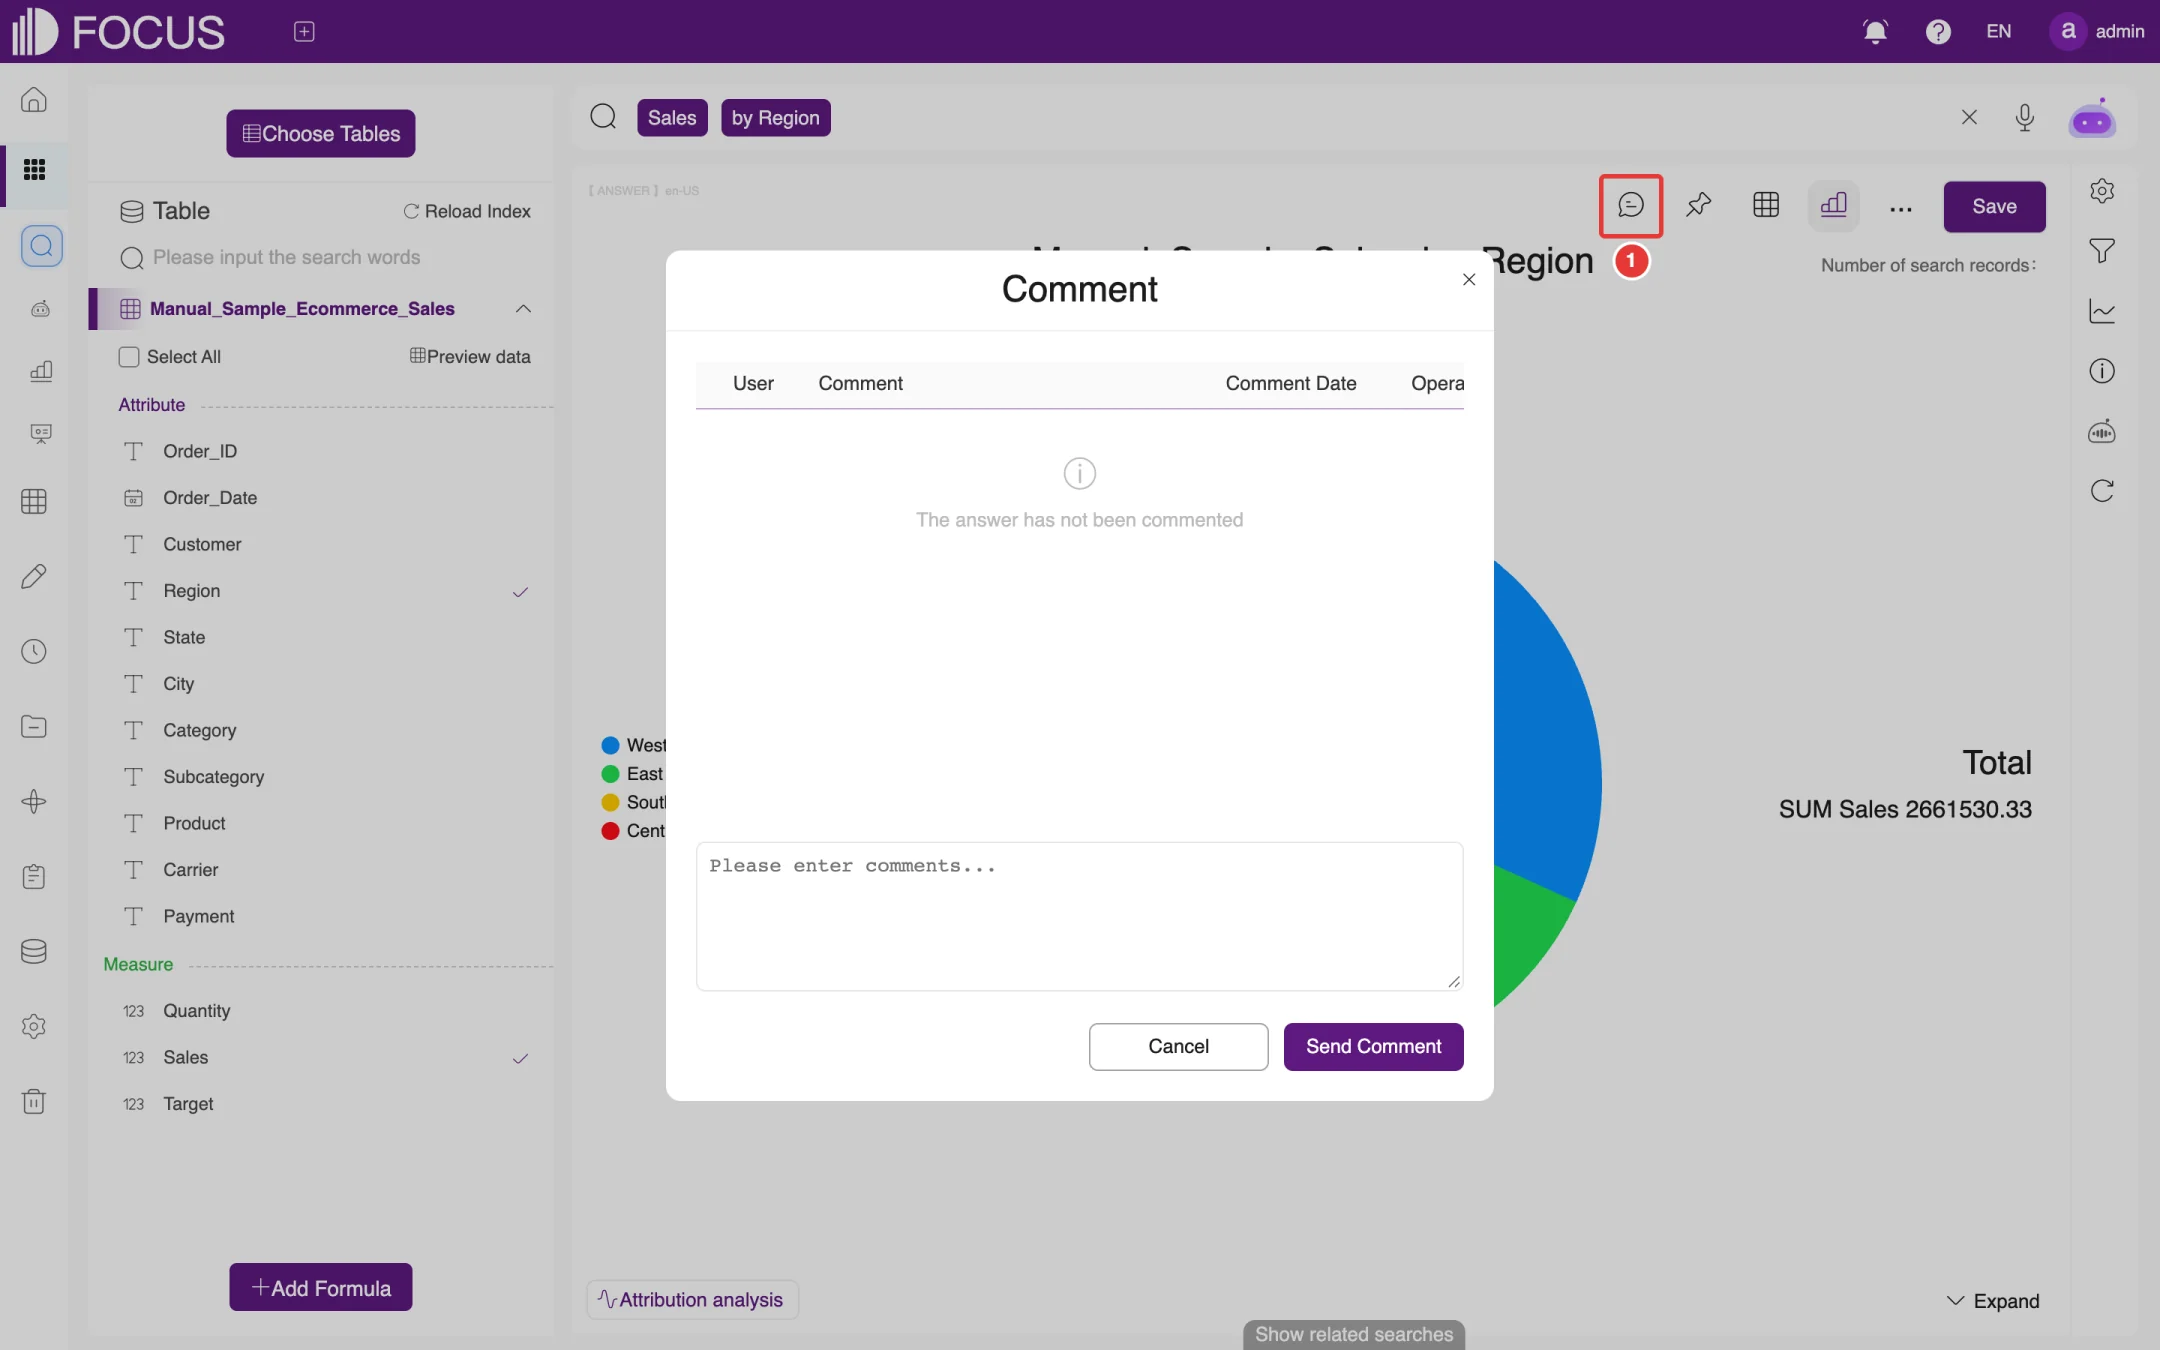
In an open answer, click the Comment button at the left end of the toolbar (① in Figure 4-4) to read other users' comments. To add your own, type it in the box and click Send Comment.
Figure 4-4. Answer comments
4.4Sharing an answer
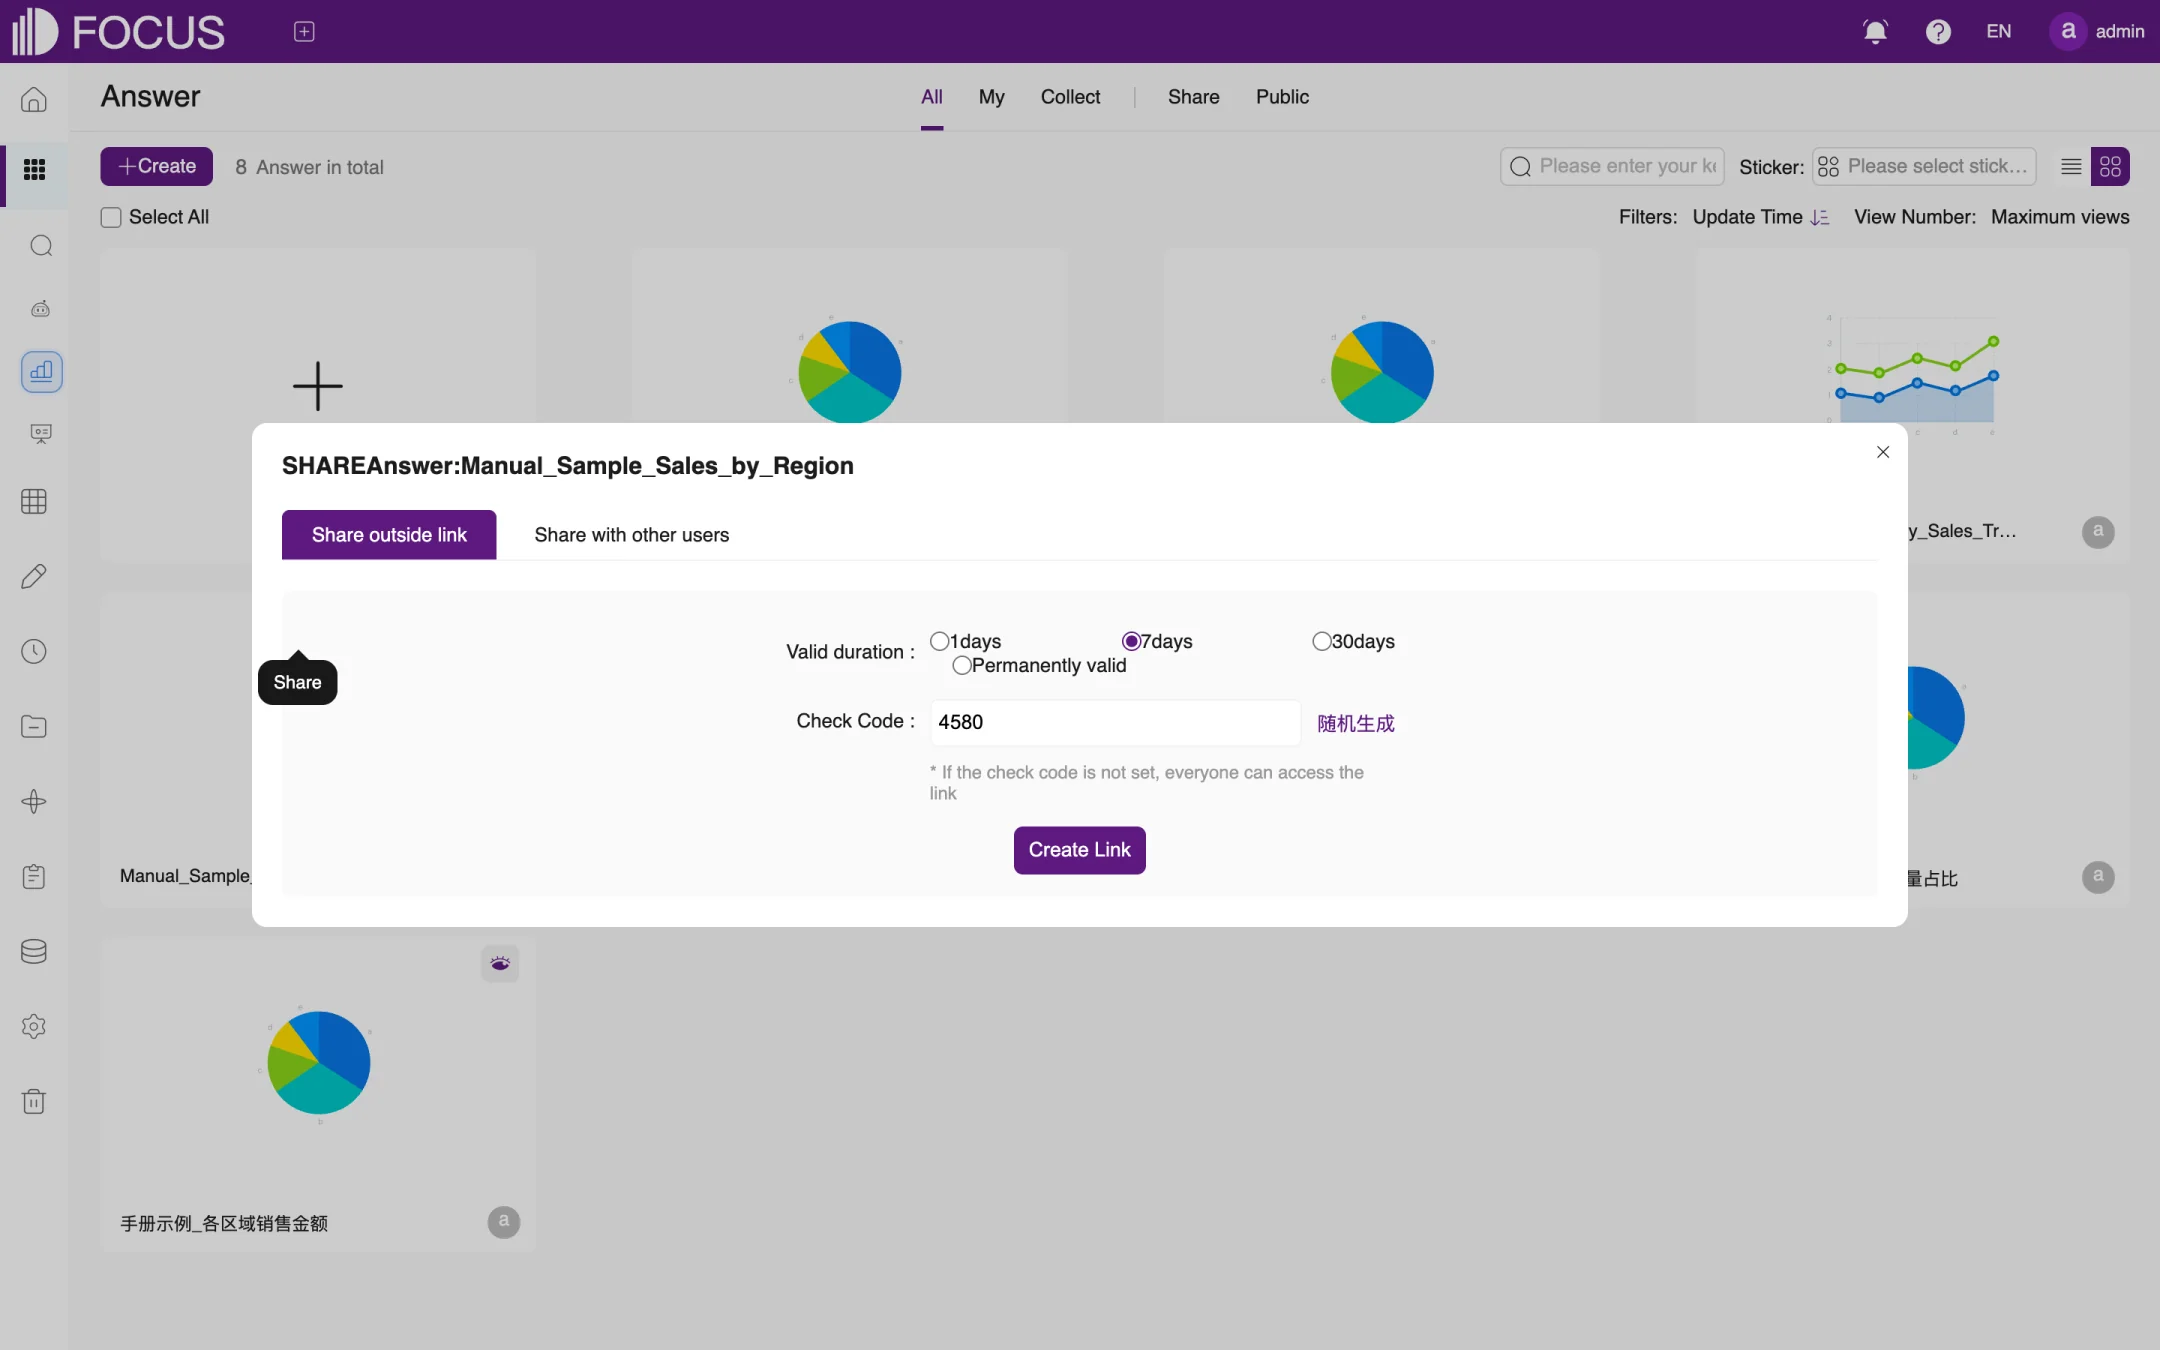
Click the Share button on an answer card to open the share dialog, as shown in Figure 4-5. The dialog has two tabs:
Share outside link: creates a link that can be opened directly in a browser.
Choose how long the link stays valid under Valid duration: 1days, 7days, 30days or Permanently valid.
Set a Check Code. The link next to the box, shown as 随机生成 ("generate randomly") in the English interface, fills in a random code. With a check code, visitors must enter it to view the answer; without one, anyone who has the link can open it.
Click Create Link, then copy the link and send it to the people who need it.
Share with other users: choose other users of the system. They will see the answer on their own Share tab.
Figure 4-5. Sharing an answer
Note: An outside link can be opened without signing in. Choose the validity period and check code carefully so that data does not leak.
4.5Moving, changing the owner and deleting
4.5.1Moving an answer to a project
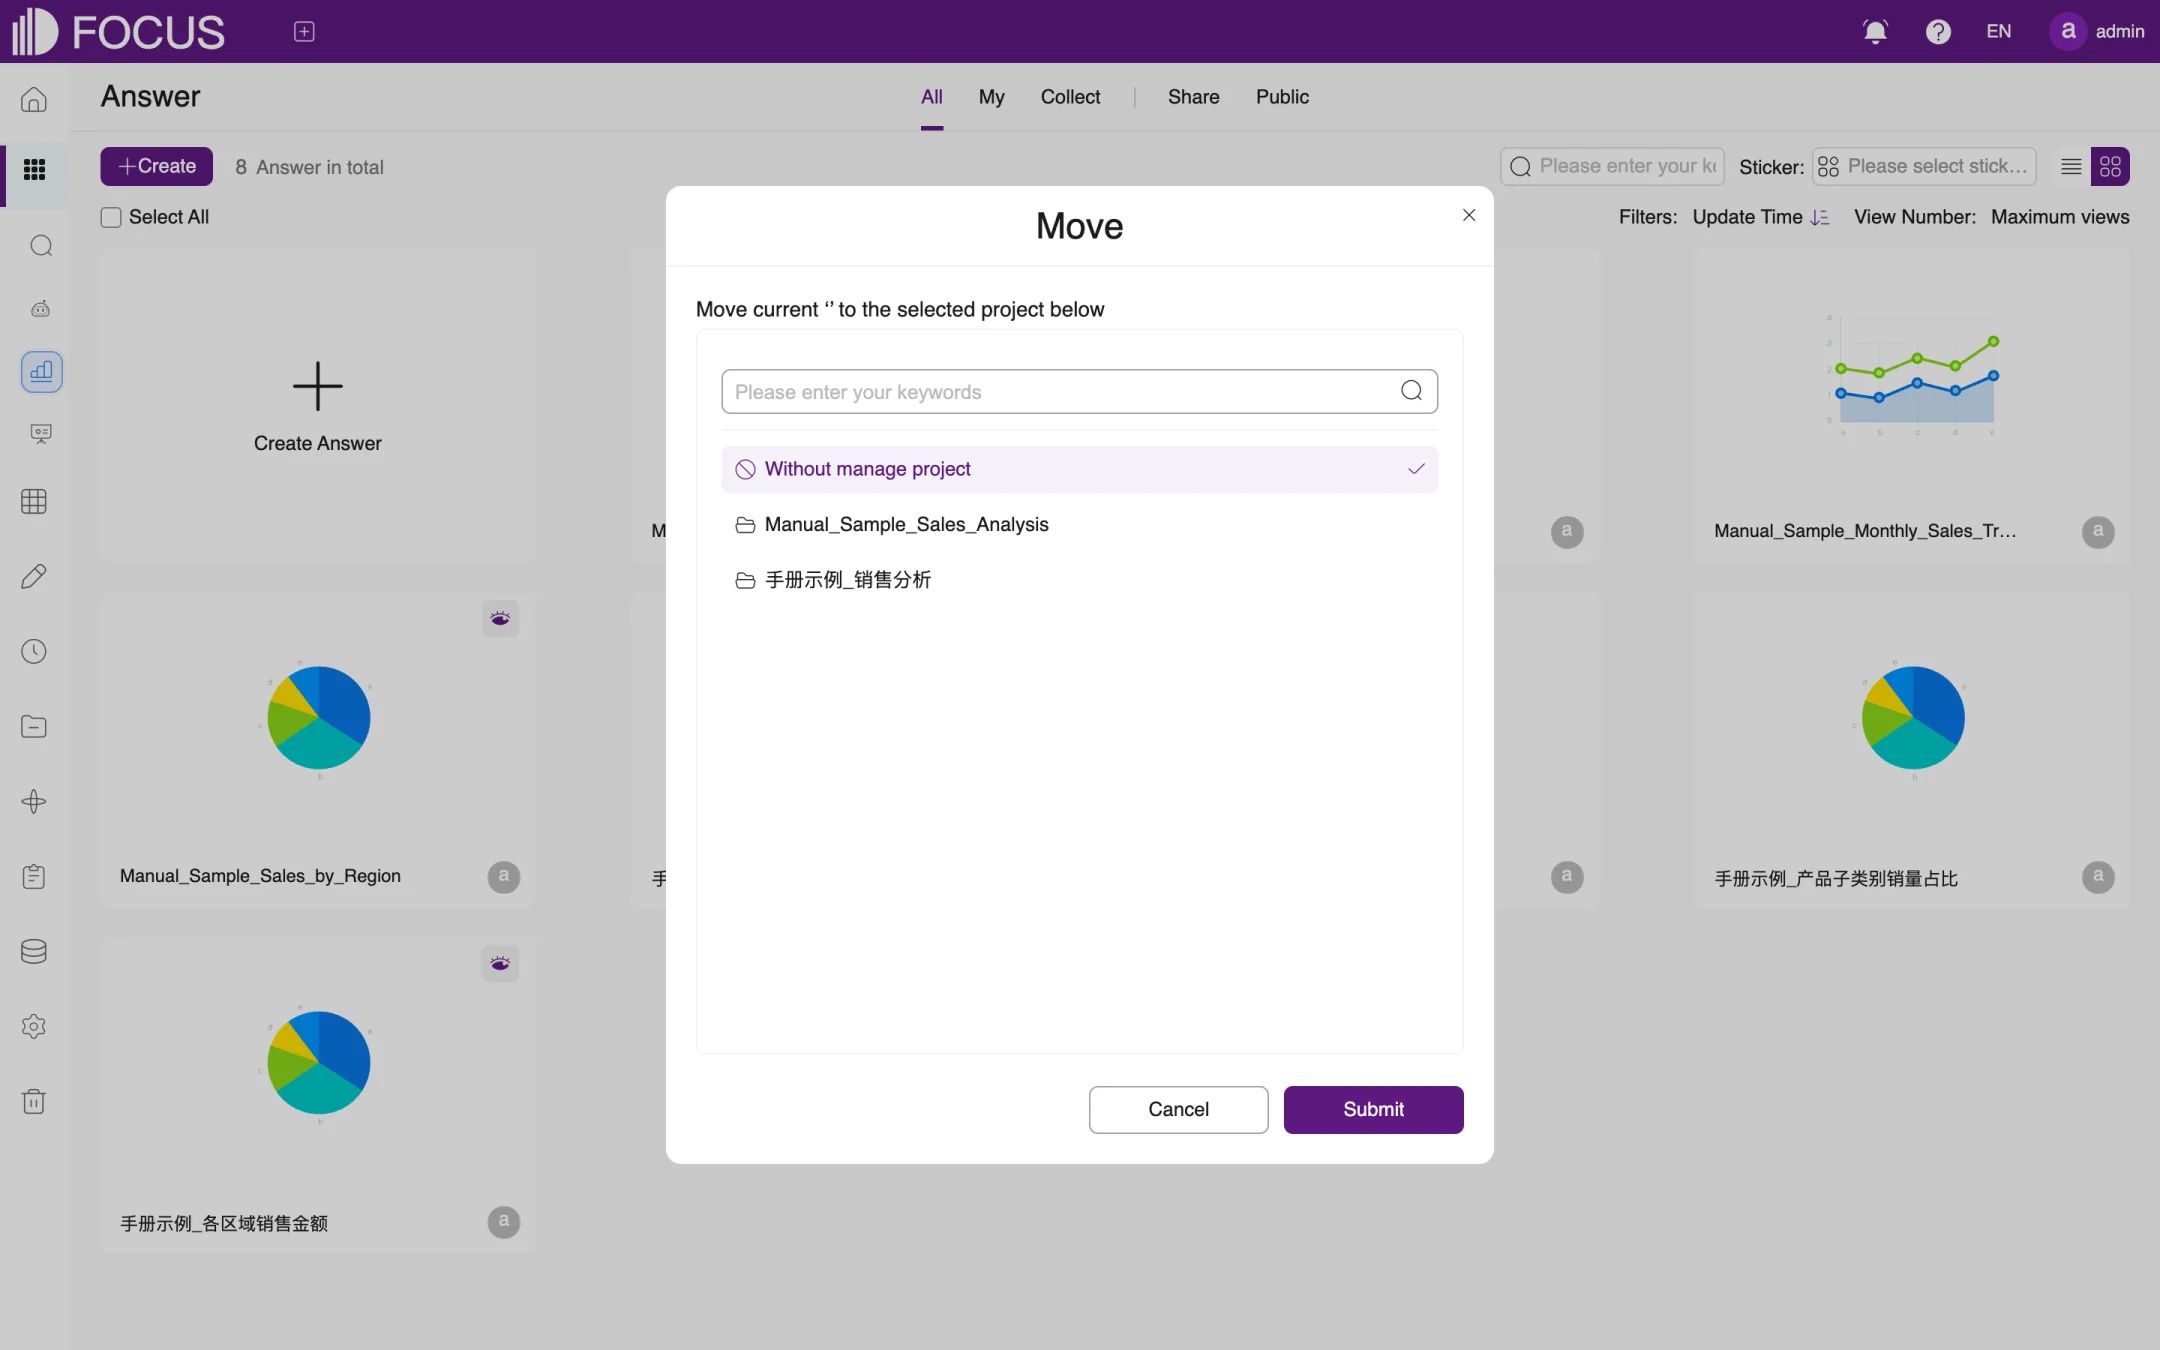
Click the Move button to open the Move dialog, as shown in Figure 4-6. Select the target project in the list and click Submit. For how to create projects, see Chapter 9.
Figure 4-6. Moving an answer
4.5.2Changing the owner
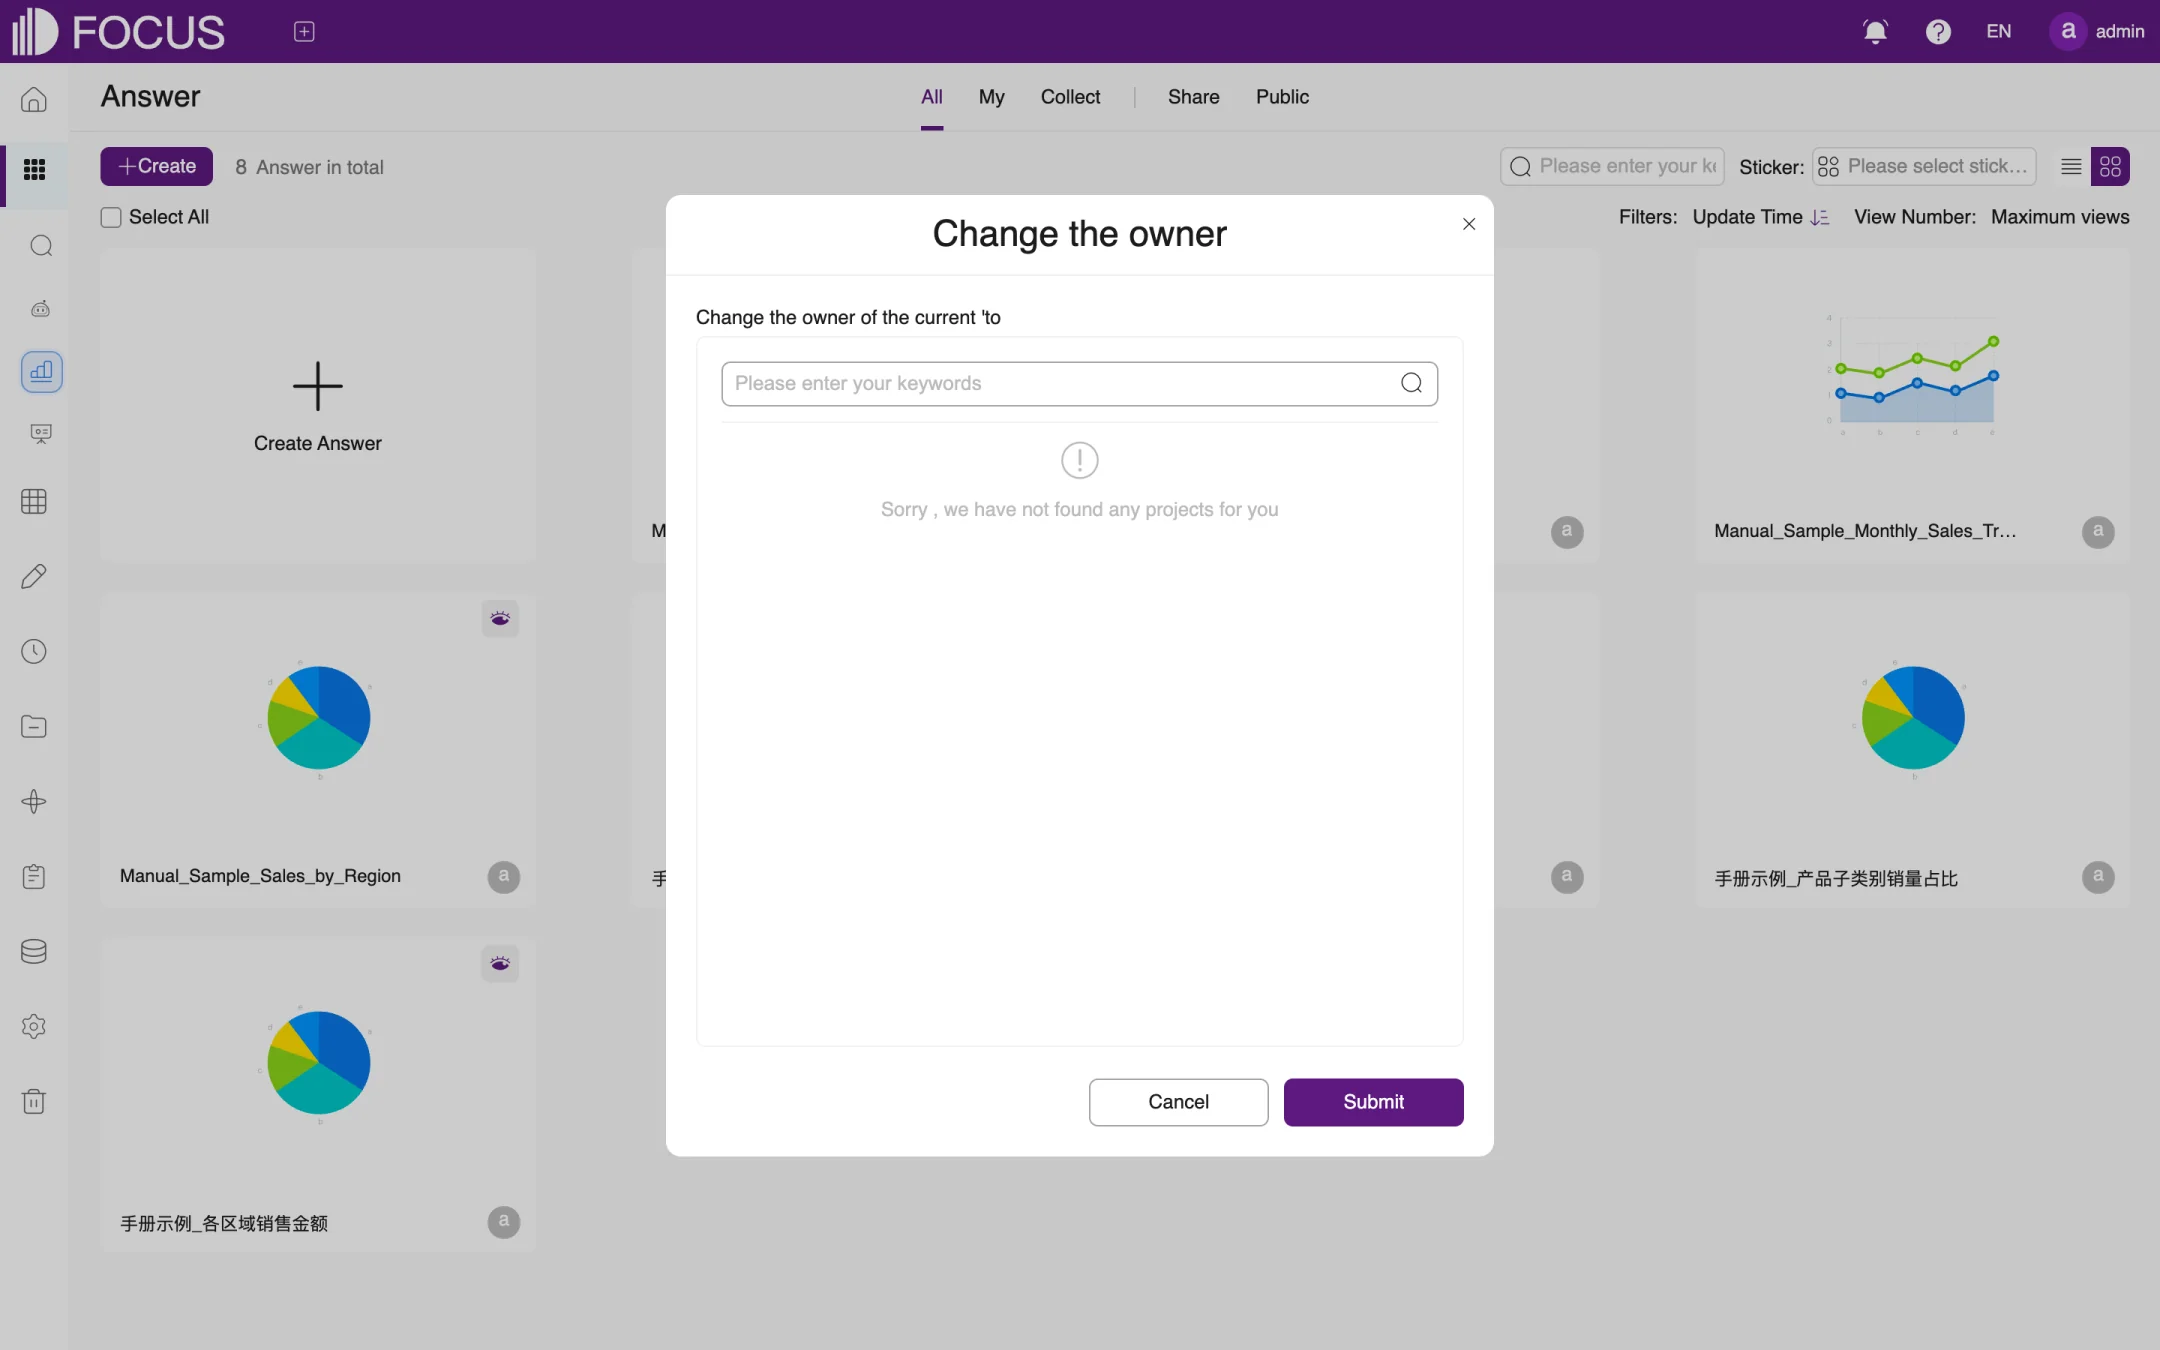
Click the Change owner button. In the Change the owner dialog, search for and select the new owner, then click Submit, as shown in Figure 4-7. From then on, the new owner manages the answer.
Figure 4-7. Changing the owner
4.5.3Deleting an answer
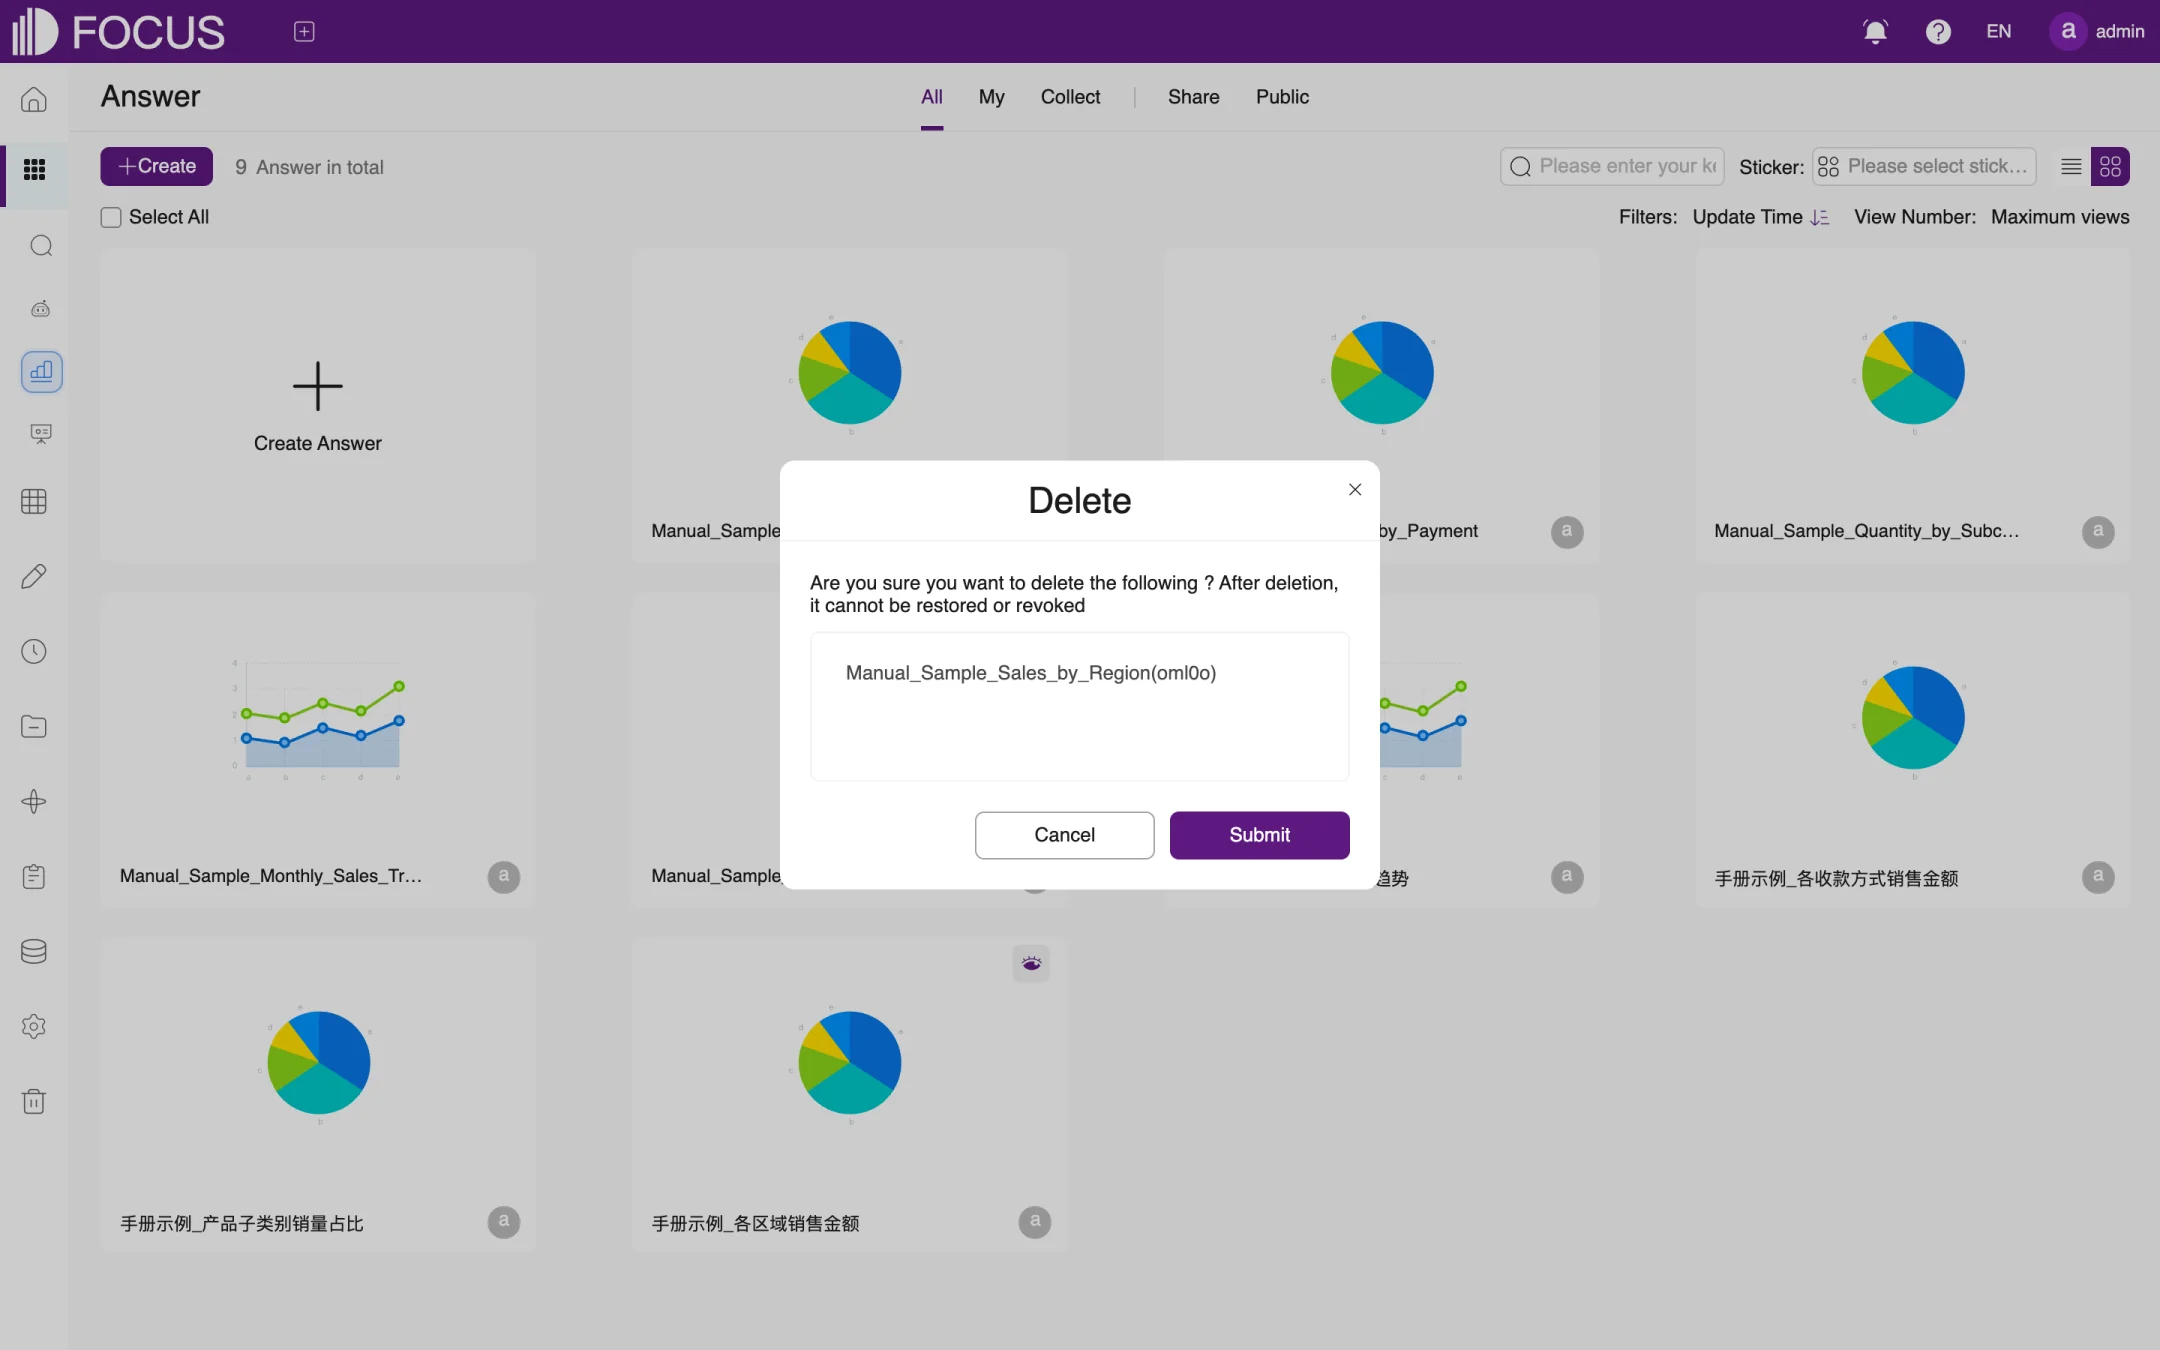
Click the Delete button. A confirmation dialog lists the answer to be deleted, as shown in Figure 4-8; in this example it is a copy of the sample answer made with the Copy button, Manual_Sample_Sales_by_Region(oml0o). Check the name and click Submit.
Figure 4-8. Deleting an answer
Caution: A deleted answer cannot be restored and does not go to Recycle. If the answer has been added to a pinboard, make sure the pinboard no longer needs it.
Chapter 5Pinboards
A pinboard combines answers, text, filters and other components on one page for day-to-day monitoring and reporting. This chapter uses the sample pinboard Manual_Sample_Ecommerce_Sales_Overview to show how to create, edit and view a pinboard.
In the left menu bar, expand BI Workspace and click Dashboards to open the pinboard list.
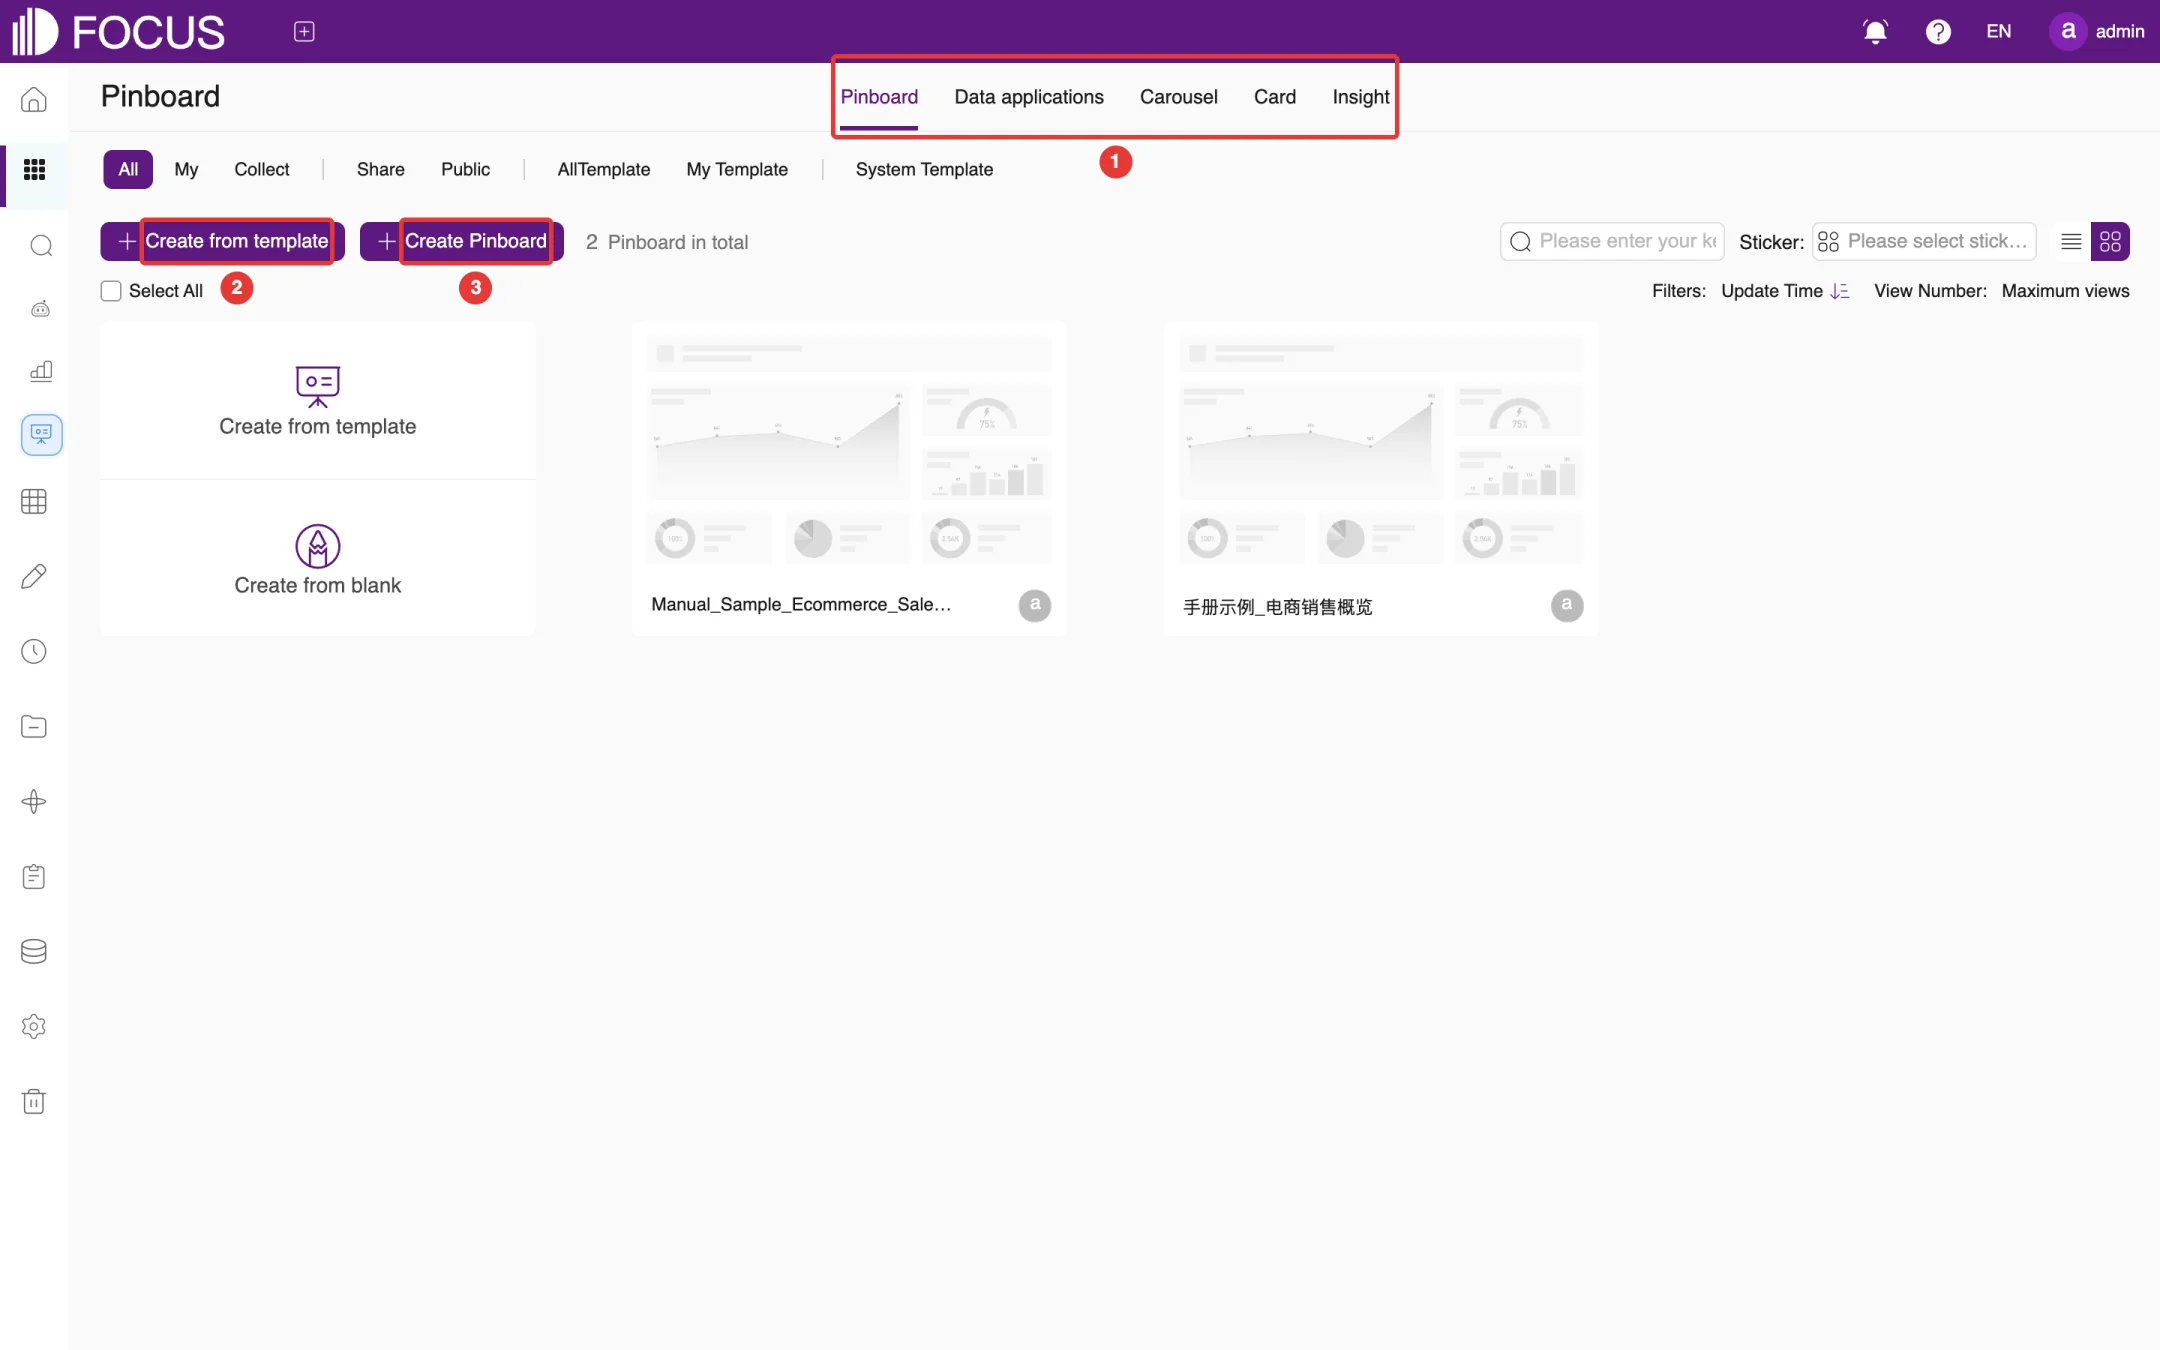
① Type tabs: Pinboard, Data applications, Carousel, Card and Insight; the last four are described in Section 5.5. Below the tabs, All, My, Collect, Share and Public filter the pinboards, and AllTemplate, My Template and System Template show pinboard templates.
② Create from template: creates a pinboard from an existing template.
③ Create Pinboard: creates a blank pinboard.
Figure 5-1. The pinboard list
As with answers, hover over a pinboard card to share, collect, copy, move or delete the pinboard; see Chapter 4. Deleted pinboards go to Recycle and can be restored from there.
5.2Creating a pinboard
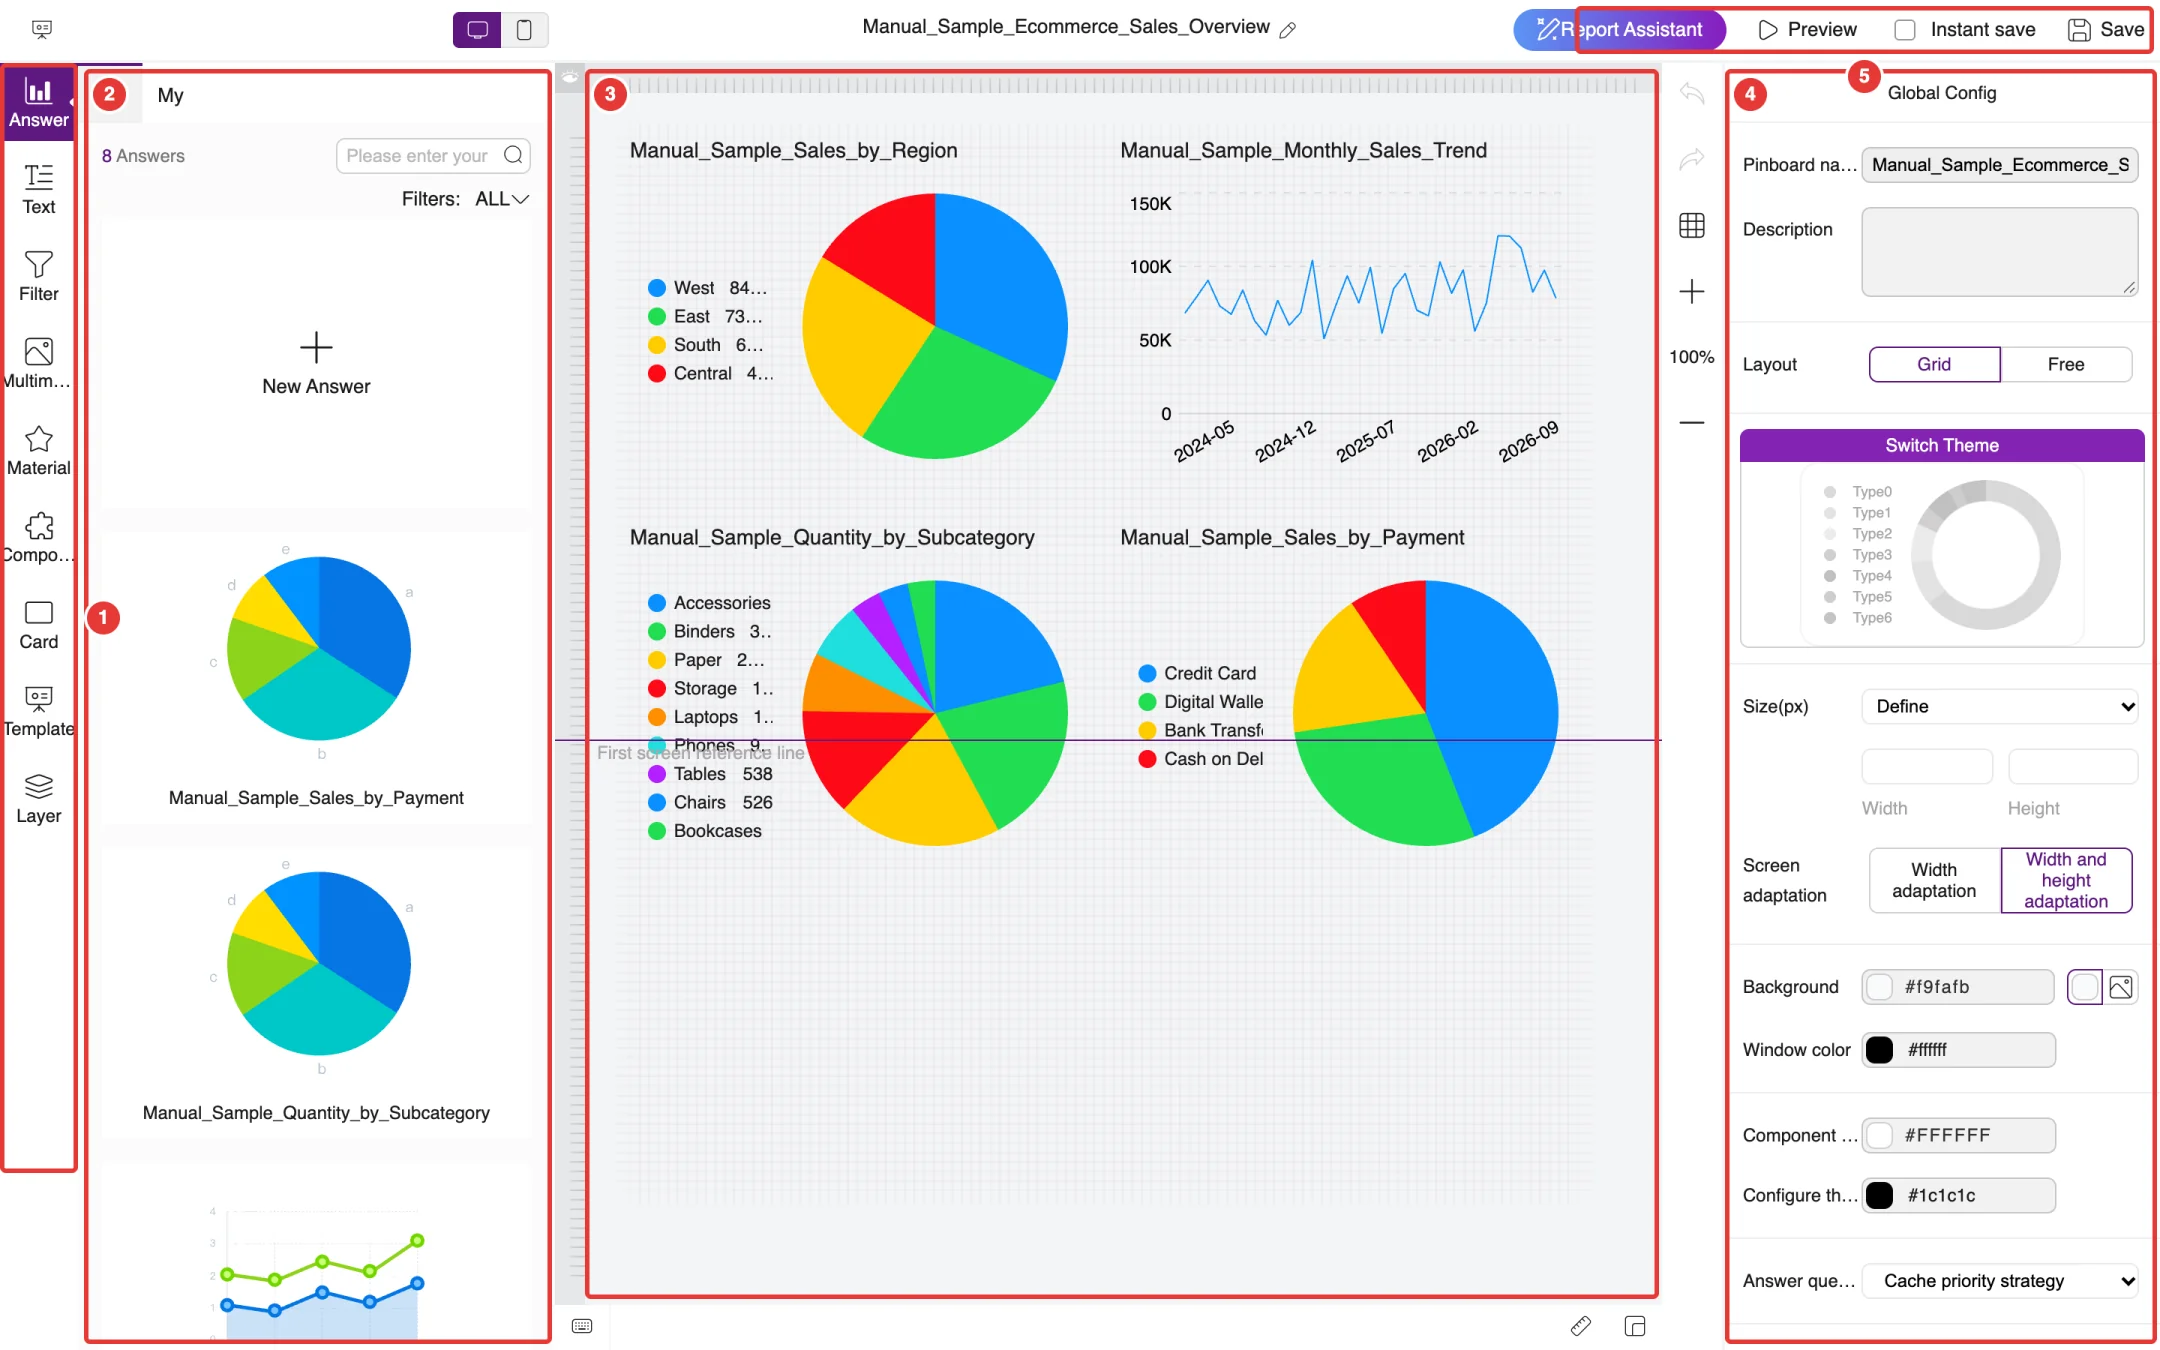
In the pinboard list, click Create Pinboard. The system creates a new, unnamed pinboard and opens it in the pinboard editor, as shown in Figure 5-2.
Under Global Config on the right, enter the Pinboard name, for example Manual_Sample_Ecommerce_Sales_Overview. You can also add a Description.
Drag the answers you need from the answer list on the left onto the canvas in the middle. Each answer you drag in adds a chart component to the canvas.
Adjust the size and position of the components; see Section 5.3.
Click Save at the top right.
The editor areas are:
① Component bar: Answer, Text, Filter, Multimedia, Material, Component, Card, Template and Layer. Click one to show the items available for it at ②.
② Item list: here it shows Answer, that is, the answers you can drag onto the pinboard. Click New Answer to go to search and save a new answer.
③ Canvas: the content of the pinboard. The horizontal First screen reference line marks how much of the pinboard is visible on the first screen when it opens.
④ Global Config: pinboard name, description, layout, theme, size, background colors, answer query strategy, timed refresh, thumbnail and more. You can also save the pinboard as a template here.
⑤ Top actions: Report Assistant (FocusGPT's report assistant), Preview, Instant save and Save. With Instant save checked, every change is saved automatically.
Figure 5-2. The pinboard editor
5.2.1Global Config settings
Setting
Description
Layout
Grid aligns components to a grid; Free lets you place components anywhere
Switch Theme
Chooses the color scheme of the pinboard (Type0 to Type6)
Size(px), Screen adaptation
Set the width and height of the pinboard, and whether it adapts to different screens by width (Width adaptation) or by width and height (Width and height adaptation)
Background, Window color, Component Background, Configure the component text color
Set the colors of each part; backgrounds can also use an image
Answer query strategy
Sets how the answers on the pinboard get their data, for example Cache priority strategy
Timed refresh
When checked, the pinboard refreshes its data automatically at the interval you set
Thumbnail
Upload or automatically generate the pinboard cover; jpg, png and gif are supported, with a 16:9 aspect ratio
Save as Template
Saves the current pinboard as a template, so you can later create pinboards from it with Create from template
5.3Editing components
5.3.1Size and position
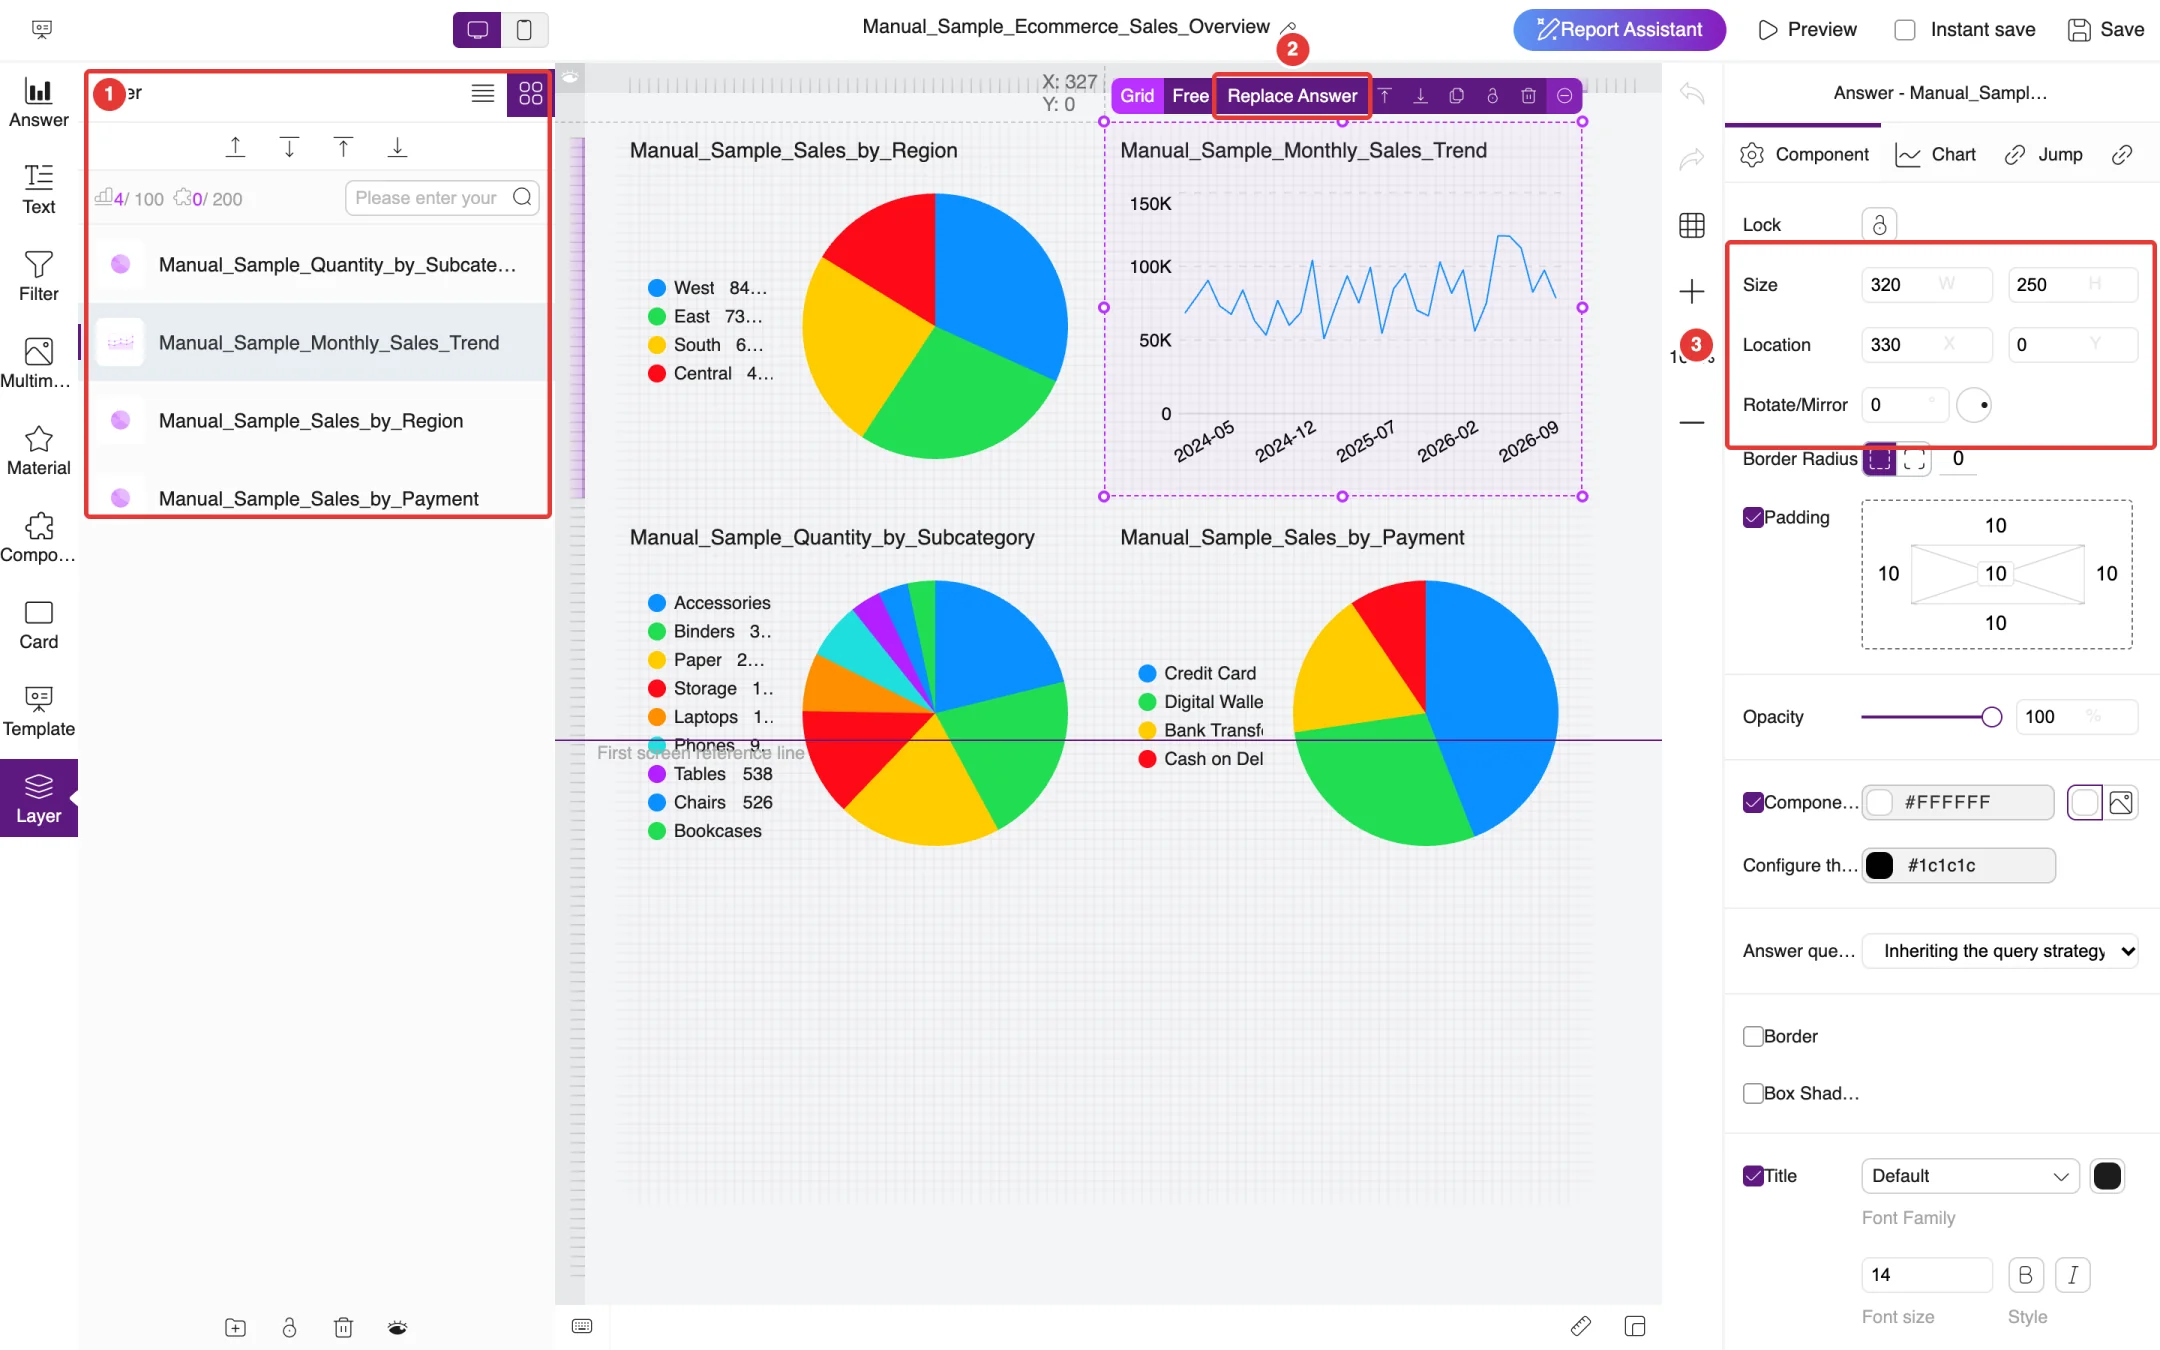
Click a component on the canvas to select it. If components overlap and are hard to click, click Layer in the component bar and select the component by name in the layer list. When a component is selected, the editor looks like Figure 5-3:
① Layer list: lists every component on the pinboard; click a name to select that component.
② Component toolbar: appears above the selected component. Use it to switch between Grid and Free placement, to Replace Answer, and to move the component up or down, copy, lock or delete it.
③ Component settings: the right-hand panel now shows the settings of this component. Under Size, W and H are the width and height; under Location, X and Y are the coordinates of the component's top-left corner on the canvas. Type a value and press Enter to apply it. You can also drag the handles around the component to resize it, or drag the component itself to move it.
Figure 5-3. Toolbar and settings of a selected component
The component settings also include Rotate/Mirror, Border Radius, Padding, Opacity, component background, Border, Box Shadow and Title style. Switch to the Chart tab to adjust how the chart is displayed, or to the Jump tab to set what happens when someone clicks the chart.
5.3.2Right-click menu
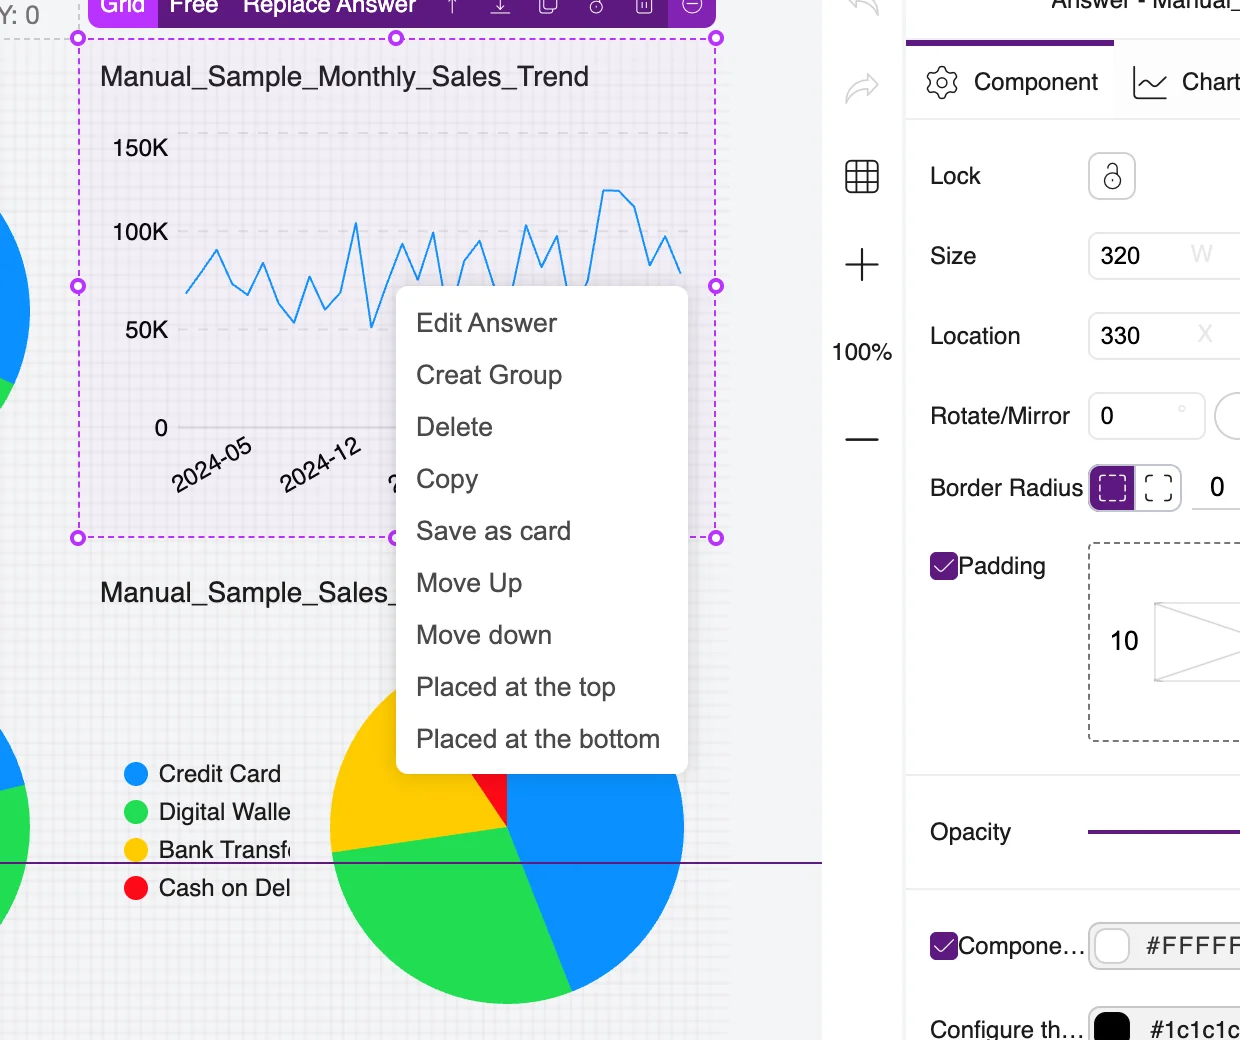
Right-click a component to open its shortcut menu, as shown in Figure 5-4:
Edit Answer: opens the answer so you can change it;
Creat Group (spelled this way on screen): groups several selected components together;
Delete and Copy;
Save as card: saves the component as a card that you can reuse on other pinboards;
Move Up, Move down, Placed at the top and Placed at the bottom: change the stacking order of the components.
Figure 5-4. Component right-click menu
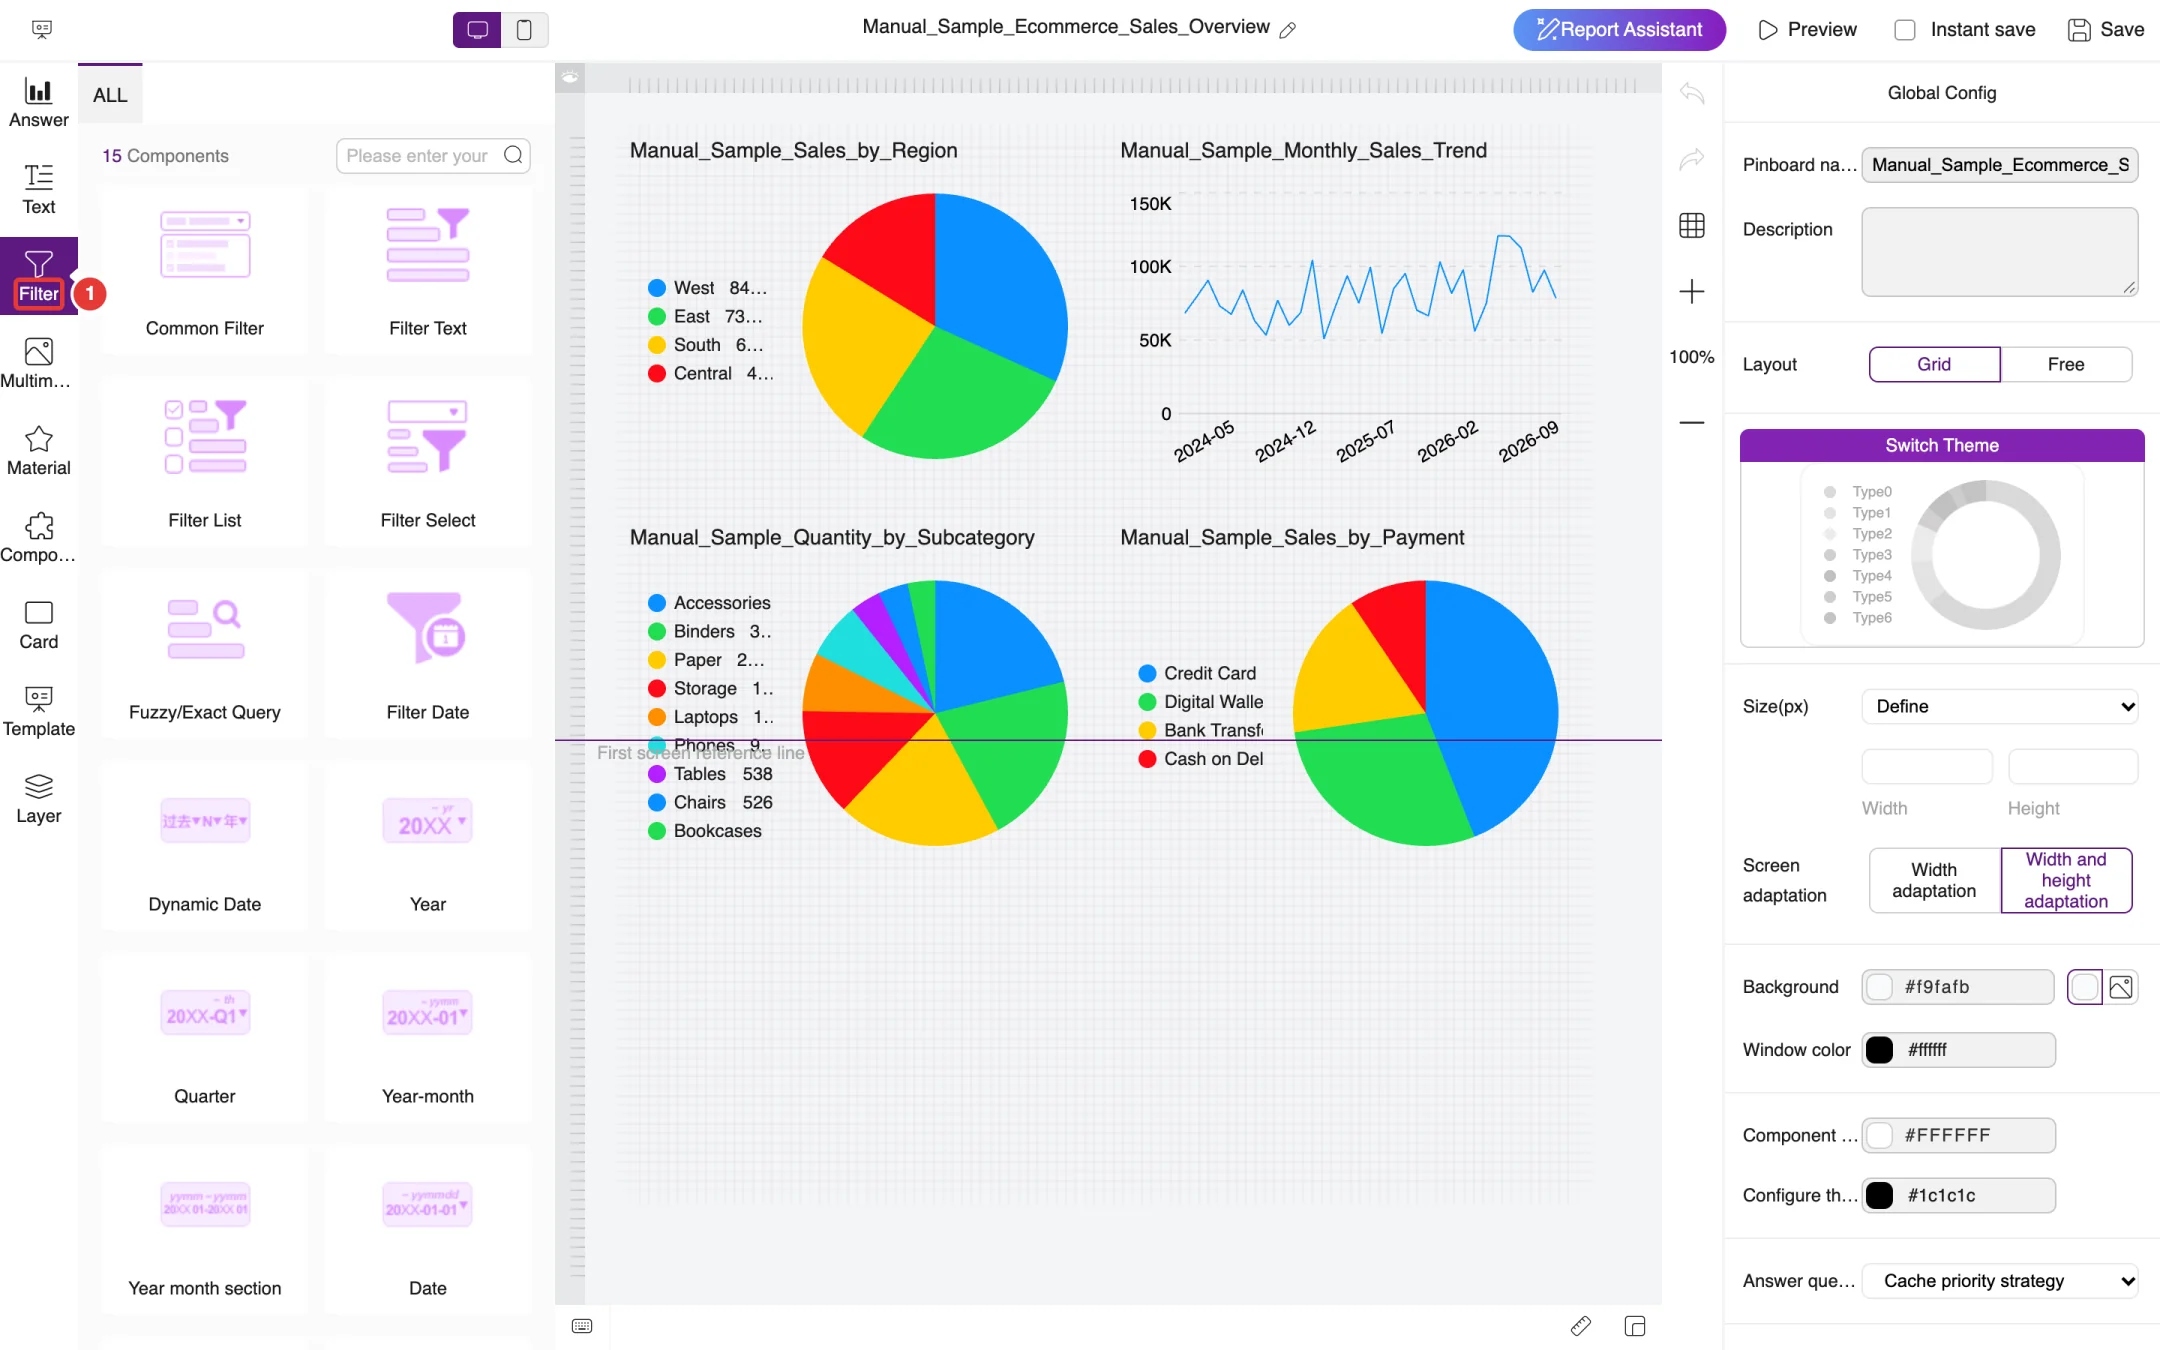
5.3.3Adding filters and other components
Click Filter in the component bar to add filters to the pinboard, as shown in Figure 5-5. There are 15 filter components, including Common Filter, Filter Text, Filter List, Filter Select, Fuzzy/Exact Query, Filter Date (date range), Dynamic Date, Year, Quarter, Year-month, Year month section and Date. Once a filter is added, people viewing the pinboard can use it to filter all the charts on the pinboard at once.
Figure 5-5. Filter components
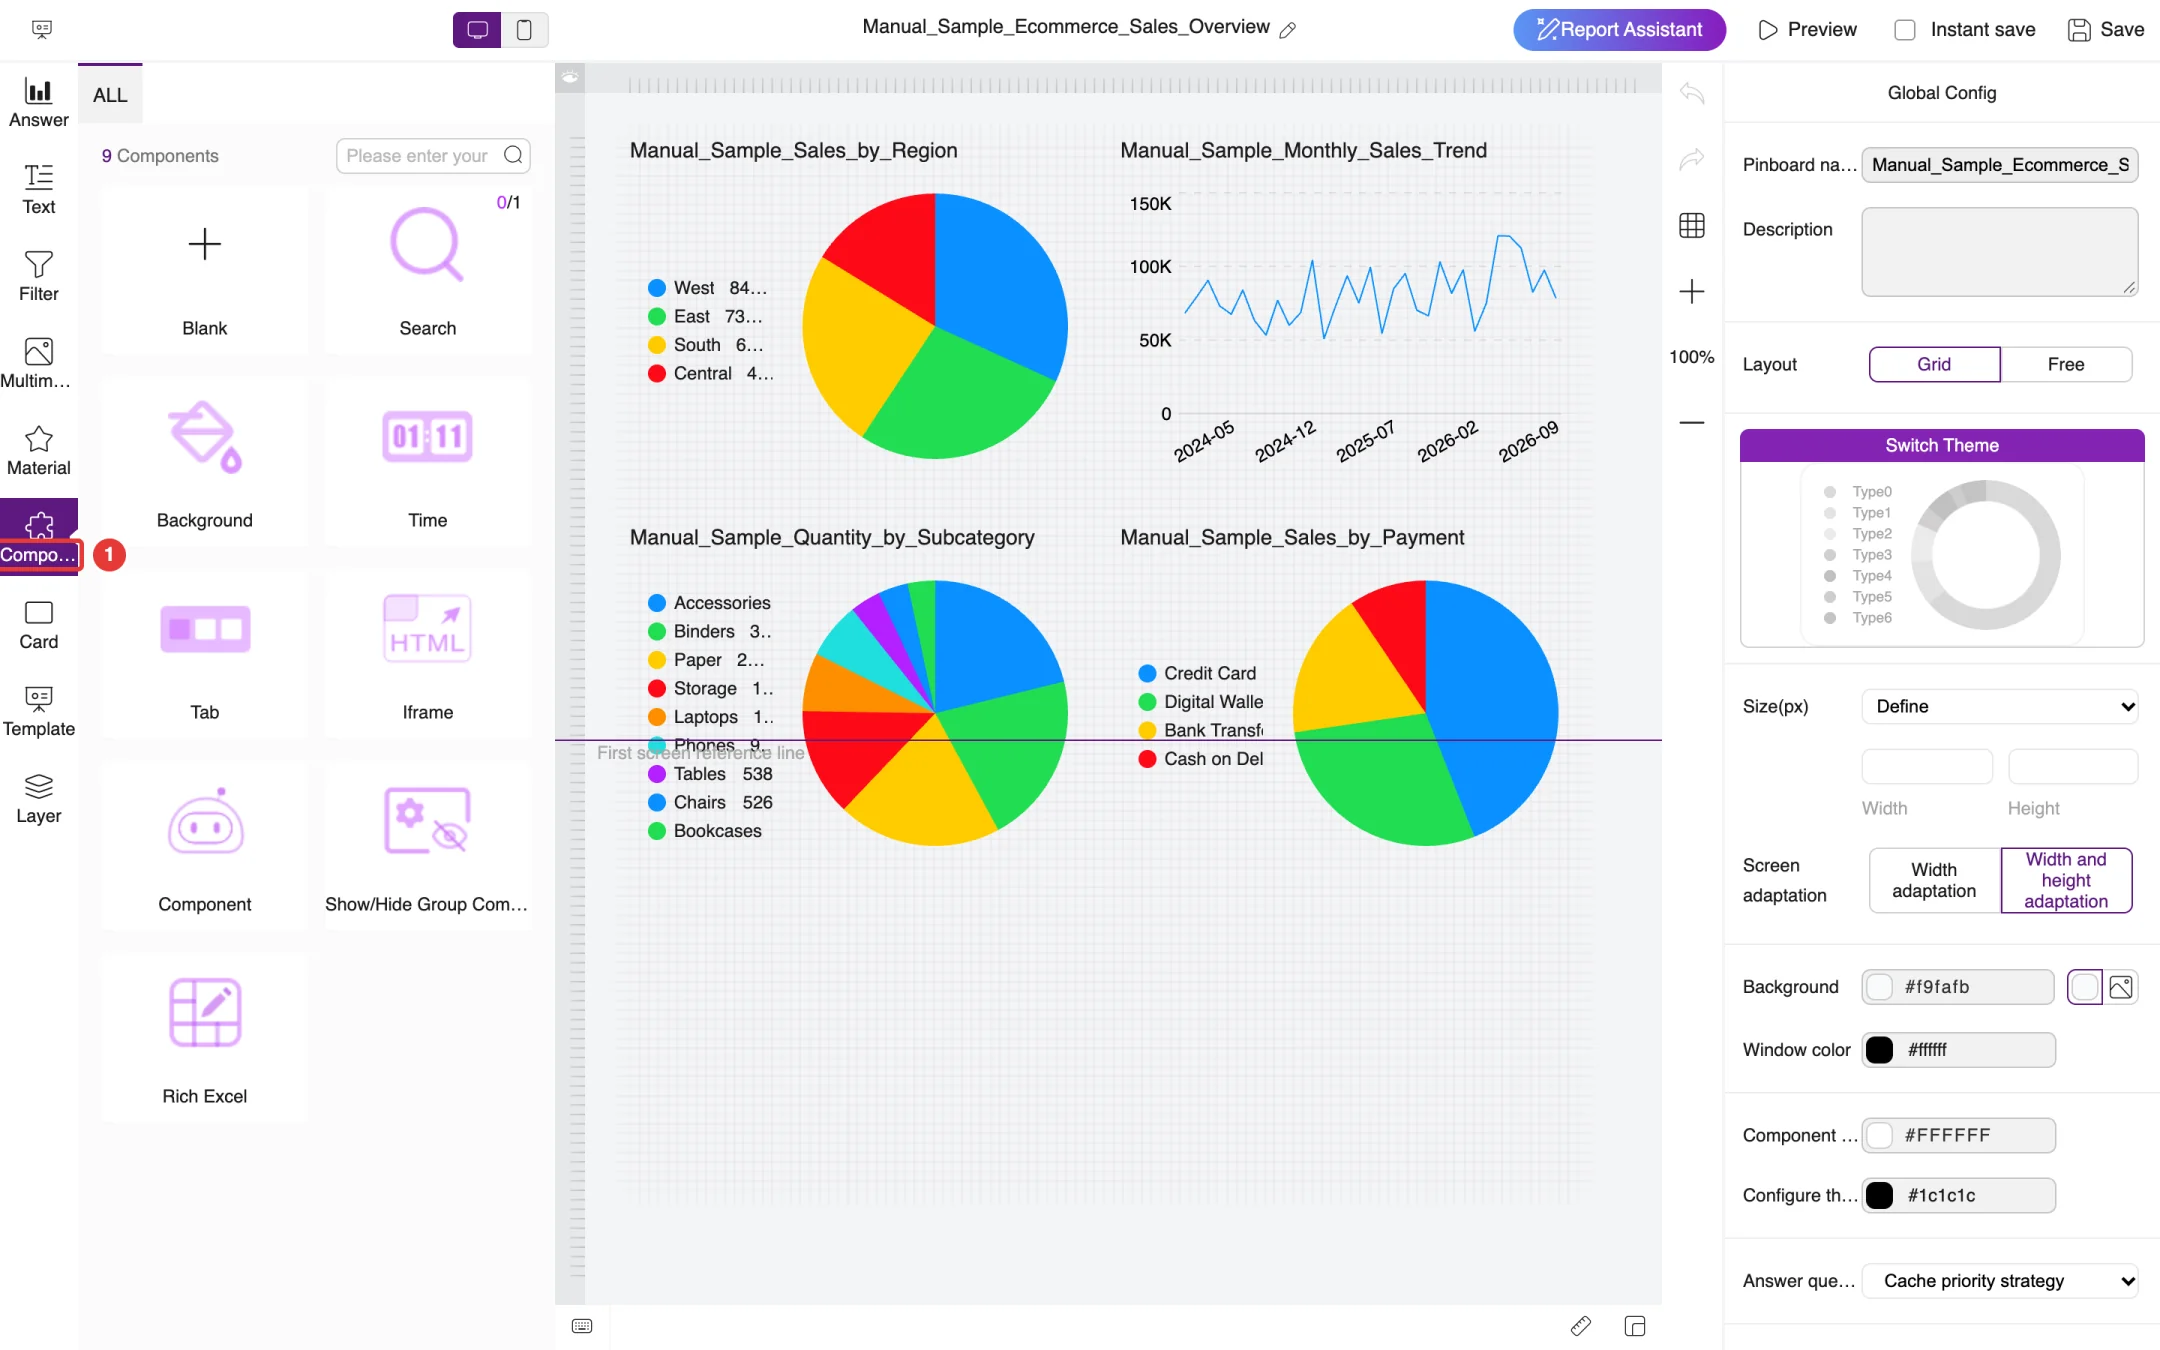
Click Component in the component bar to add a Blank component, a Search component, a custom Background, a Time display, a Tab control, an Iframe, the FocusGPT component (shown as Component with a robot icon), a Show/Hide Group Component or a Rich Excel table, as shown in Figure 5-6. Text, Multimedia and Material add text, images and videos, and decorative material respectively.
Figure 5-6. Other components
5.4Viewing a pinboard
Click a pinboard card in the pinboard list, or click Preview in the editor, to view the pinboard, as shown in Figure 5-7. The charts on the pinboard get their data according to the Answer query strategy in Global Config; if you need the latest data, turn on Timed refresh in Global Config. Click Back to List at the top left to return to the pinboard list.
Figure 5-7. Viewing a pinboard
5.5Data applications, carousels, cards and insights
The other tabs at the top of the pinboard list offer further ways to present data.
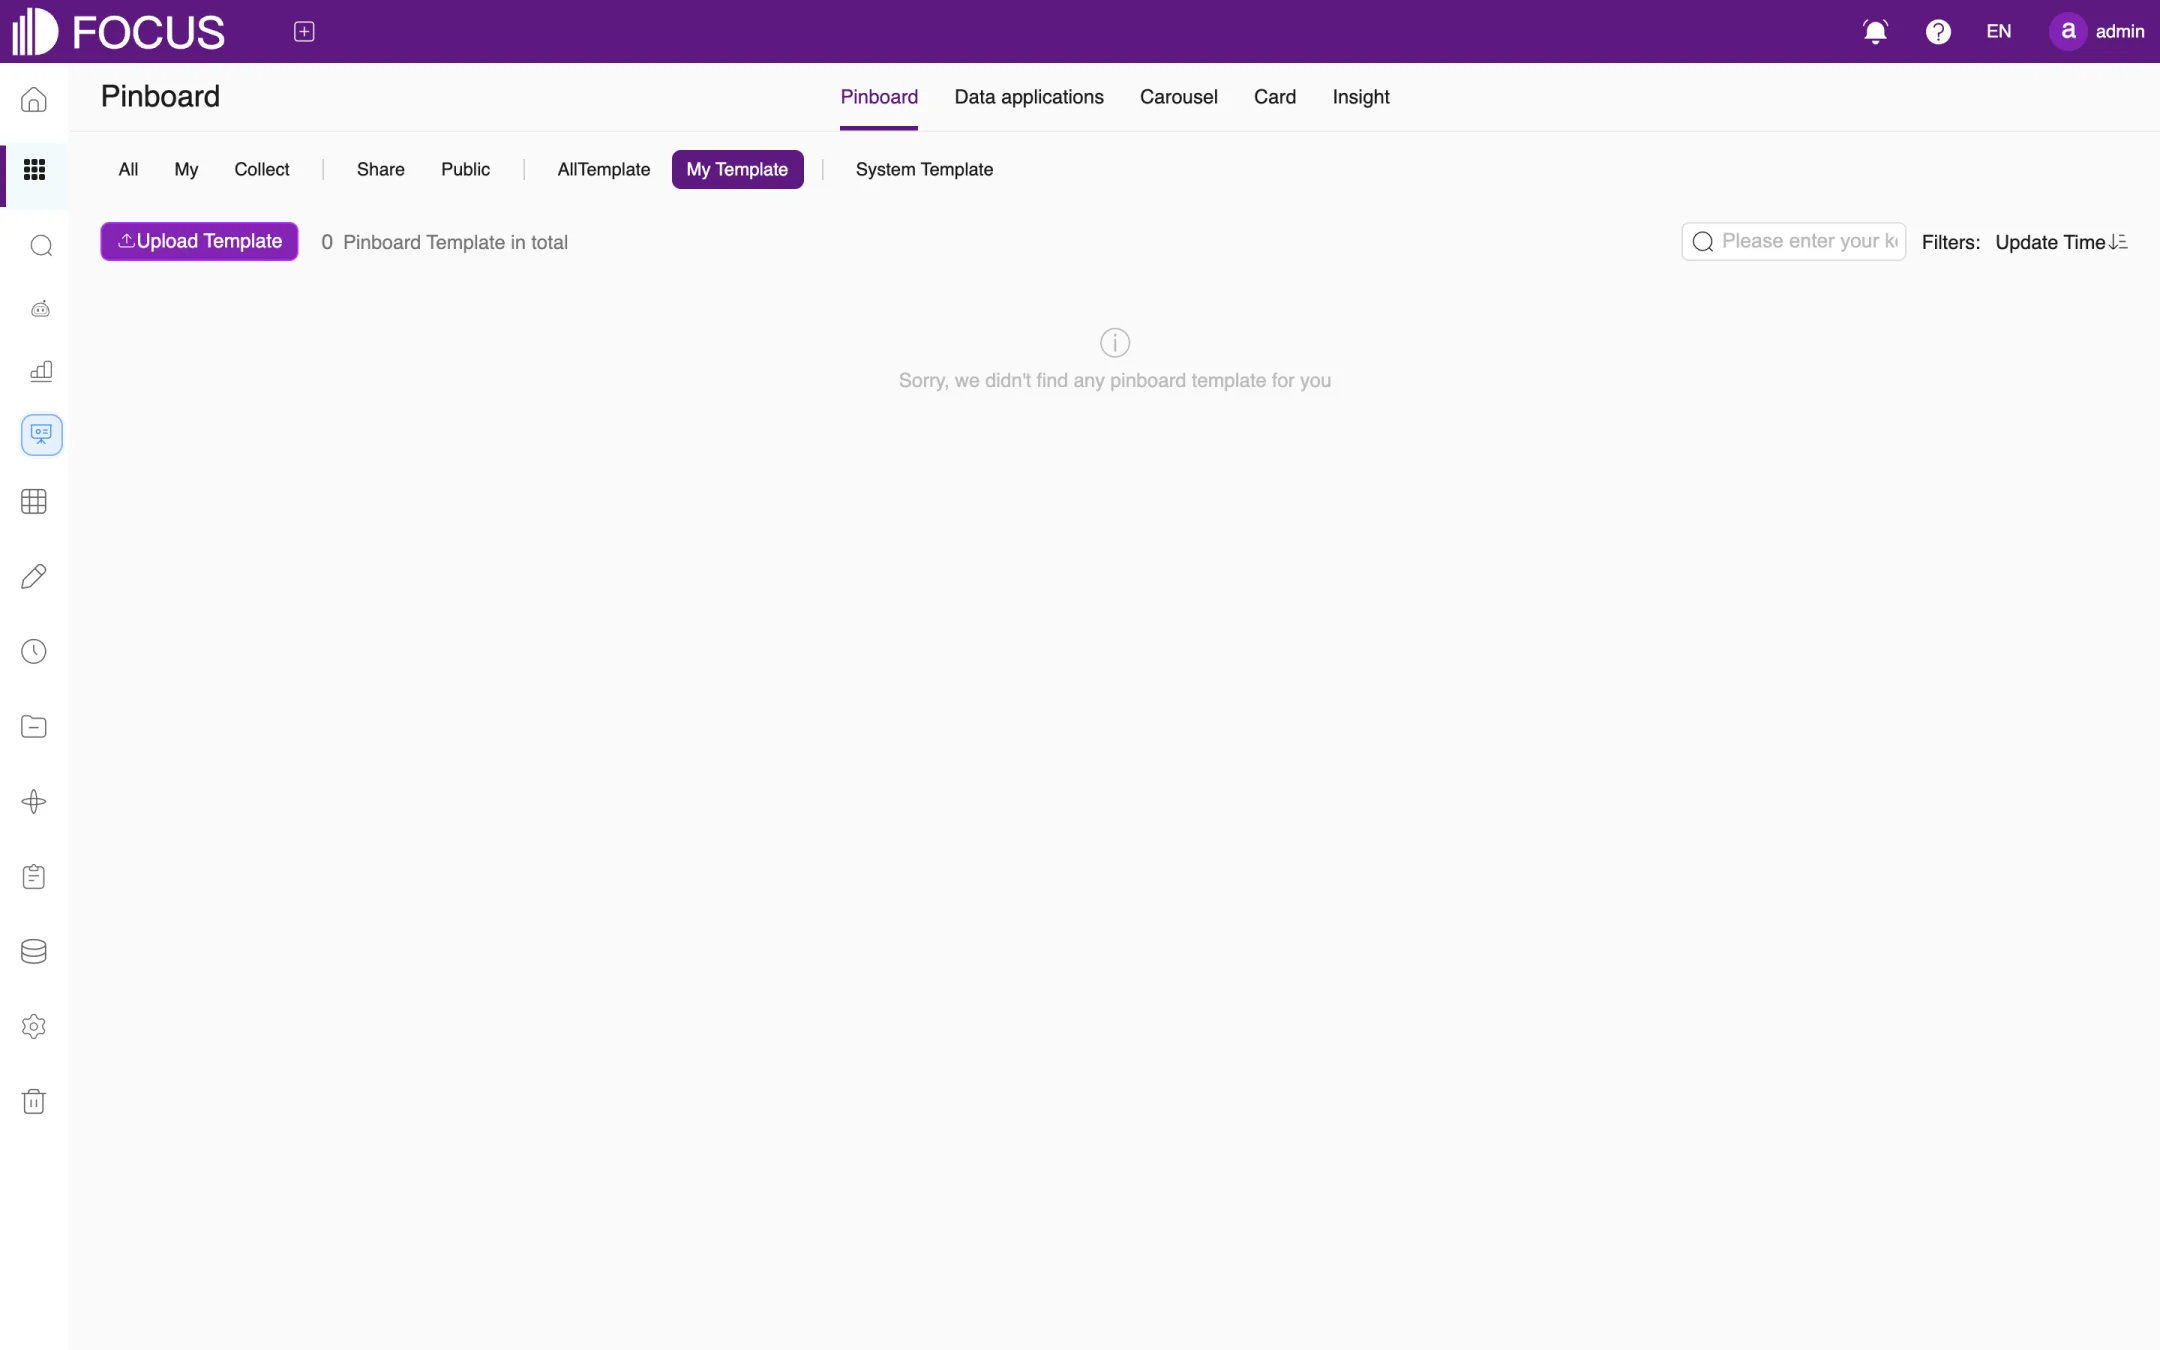
Templates: click Create from template to open the template page. System Template holds the templates that come with the product, and My Template holds the pinboards you saved with Save as Template. You can also click Upload Template to import a template file, as shown in Figure 5-8.
Figure 5-8. Pinboard templates
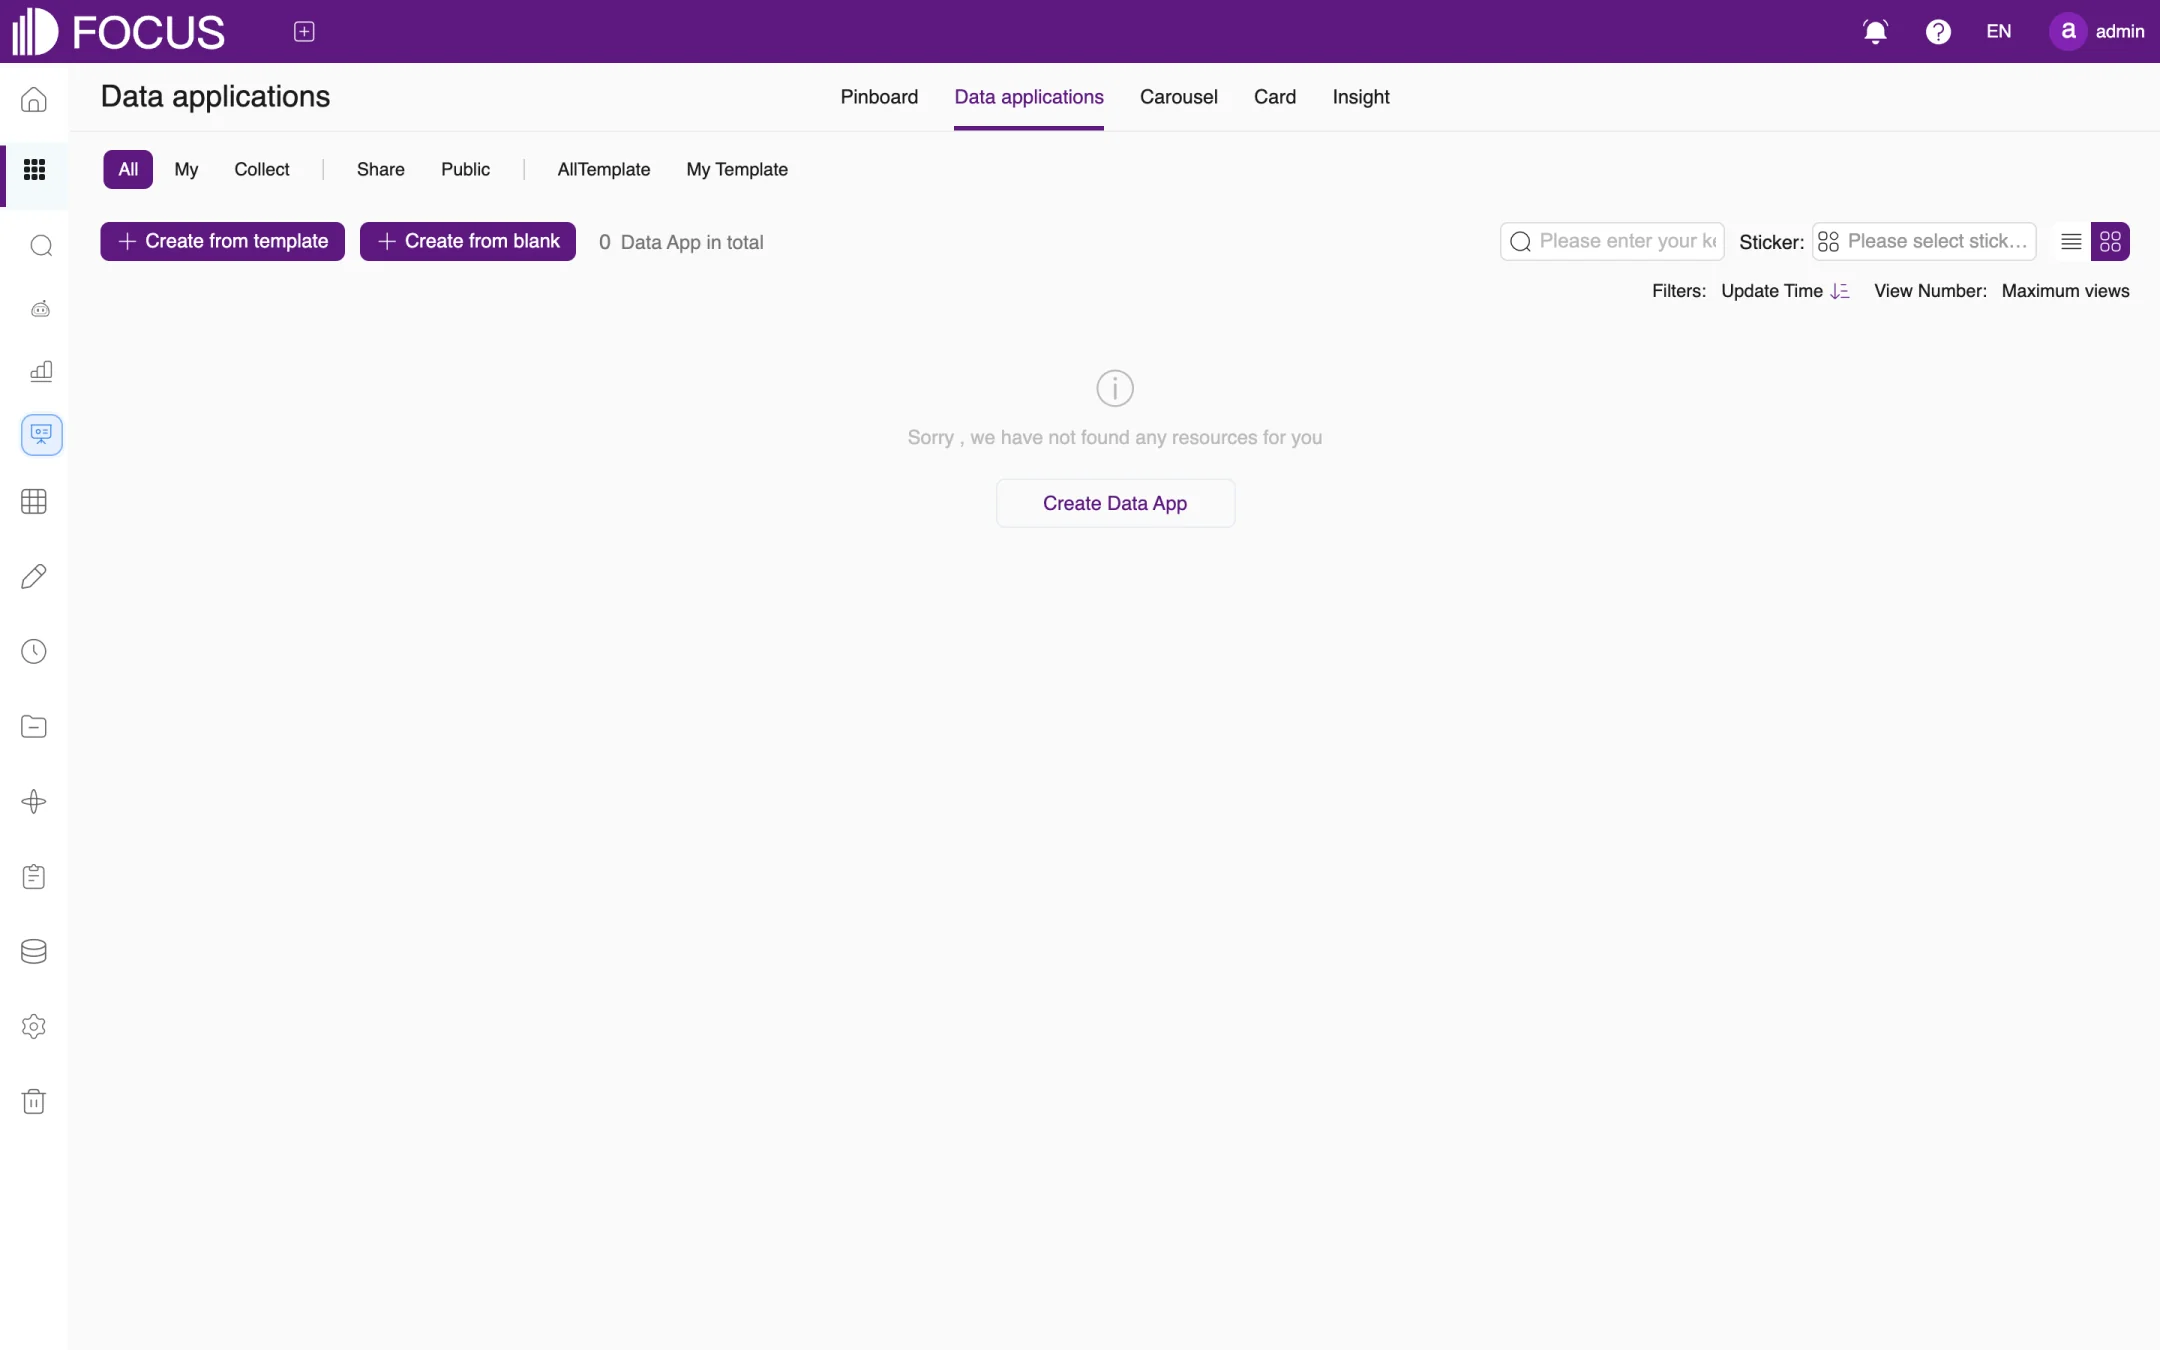
Data applications: organize several pinboards into an application with menus, for example a department portal or a system for a specific topic. Create one with Create from template or Create from blank, as shown in Figure 5-9.
Figure 5-9. Data applications
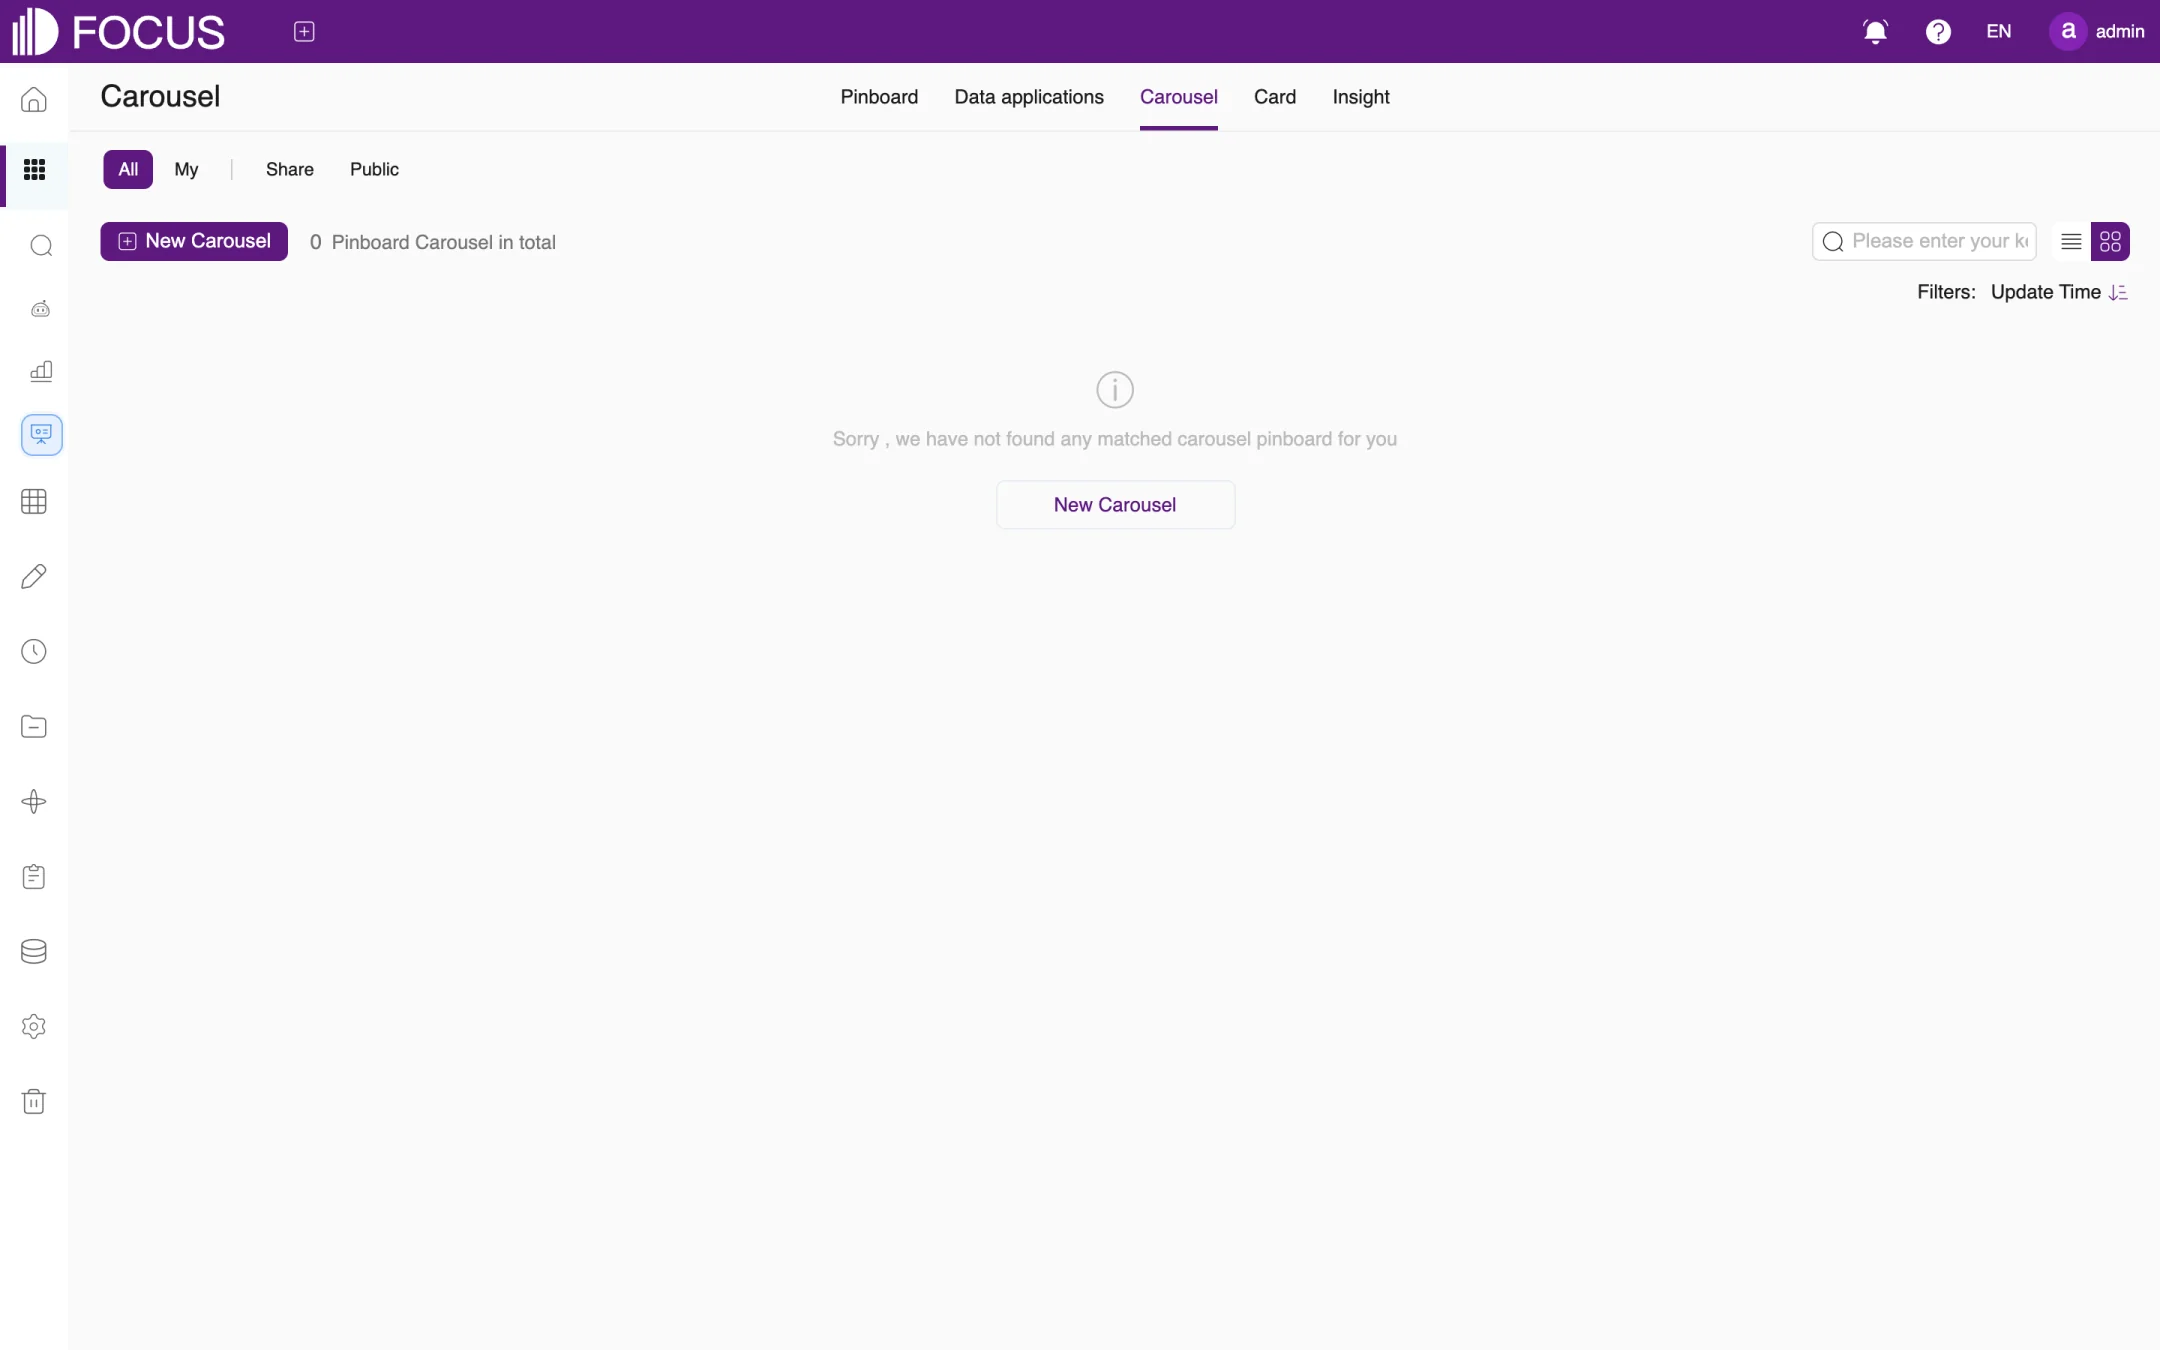
Carousel: plays several pinboards in turn on a large screen, in the order you set. Click New Carousel to create one, as shown in Figure 5-10.
Figure 5-10. Carousels
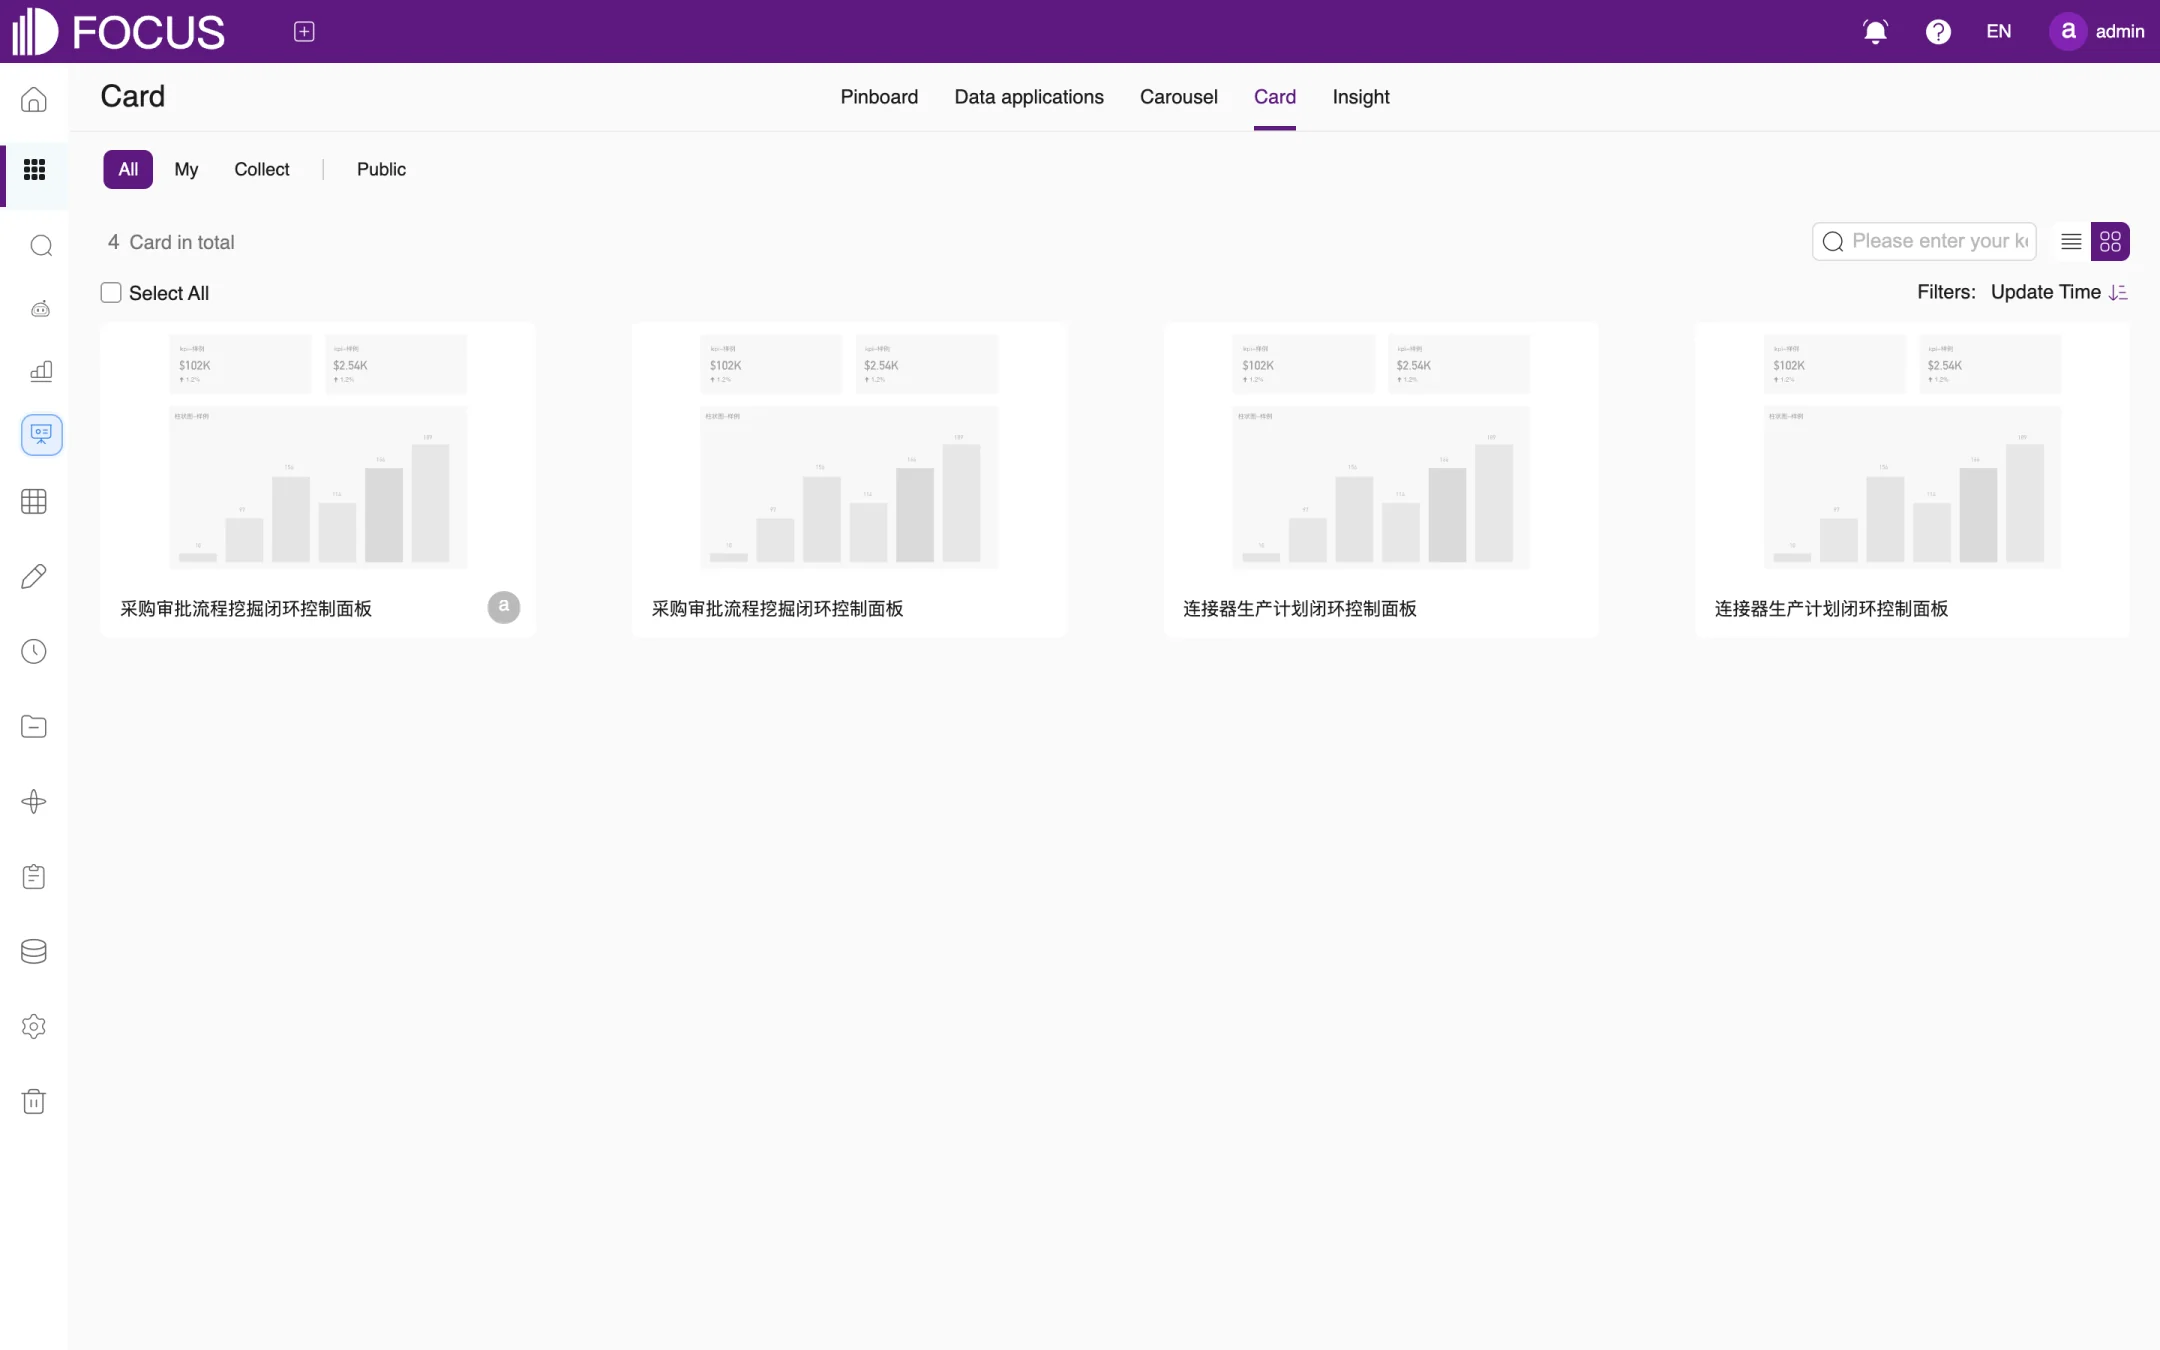
Card: components saved with Save as card from the right-click menu can be reused on different pinboards, as shown in Figure 5-11. The cards in this figure belong to the system's built-in demo content, so their names appear in Chinese.
Figure 5-11. Cards
Insight: view the insight pinboards generated by FocusGPT, as shown in Figure 5-12.
Figure 5-12. Insights
Chapter 6Tables
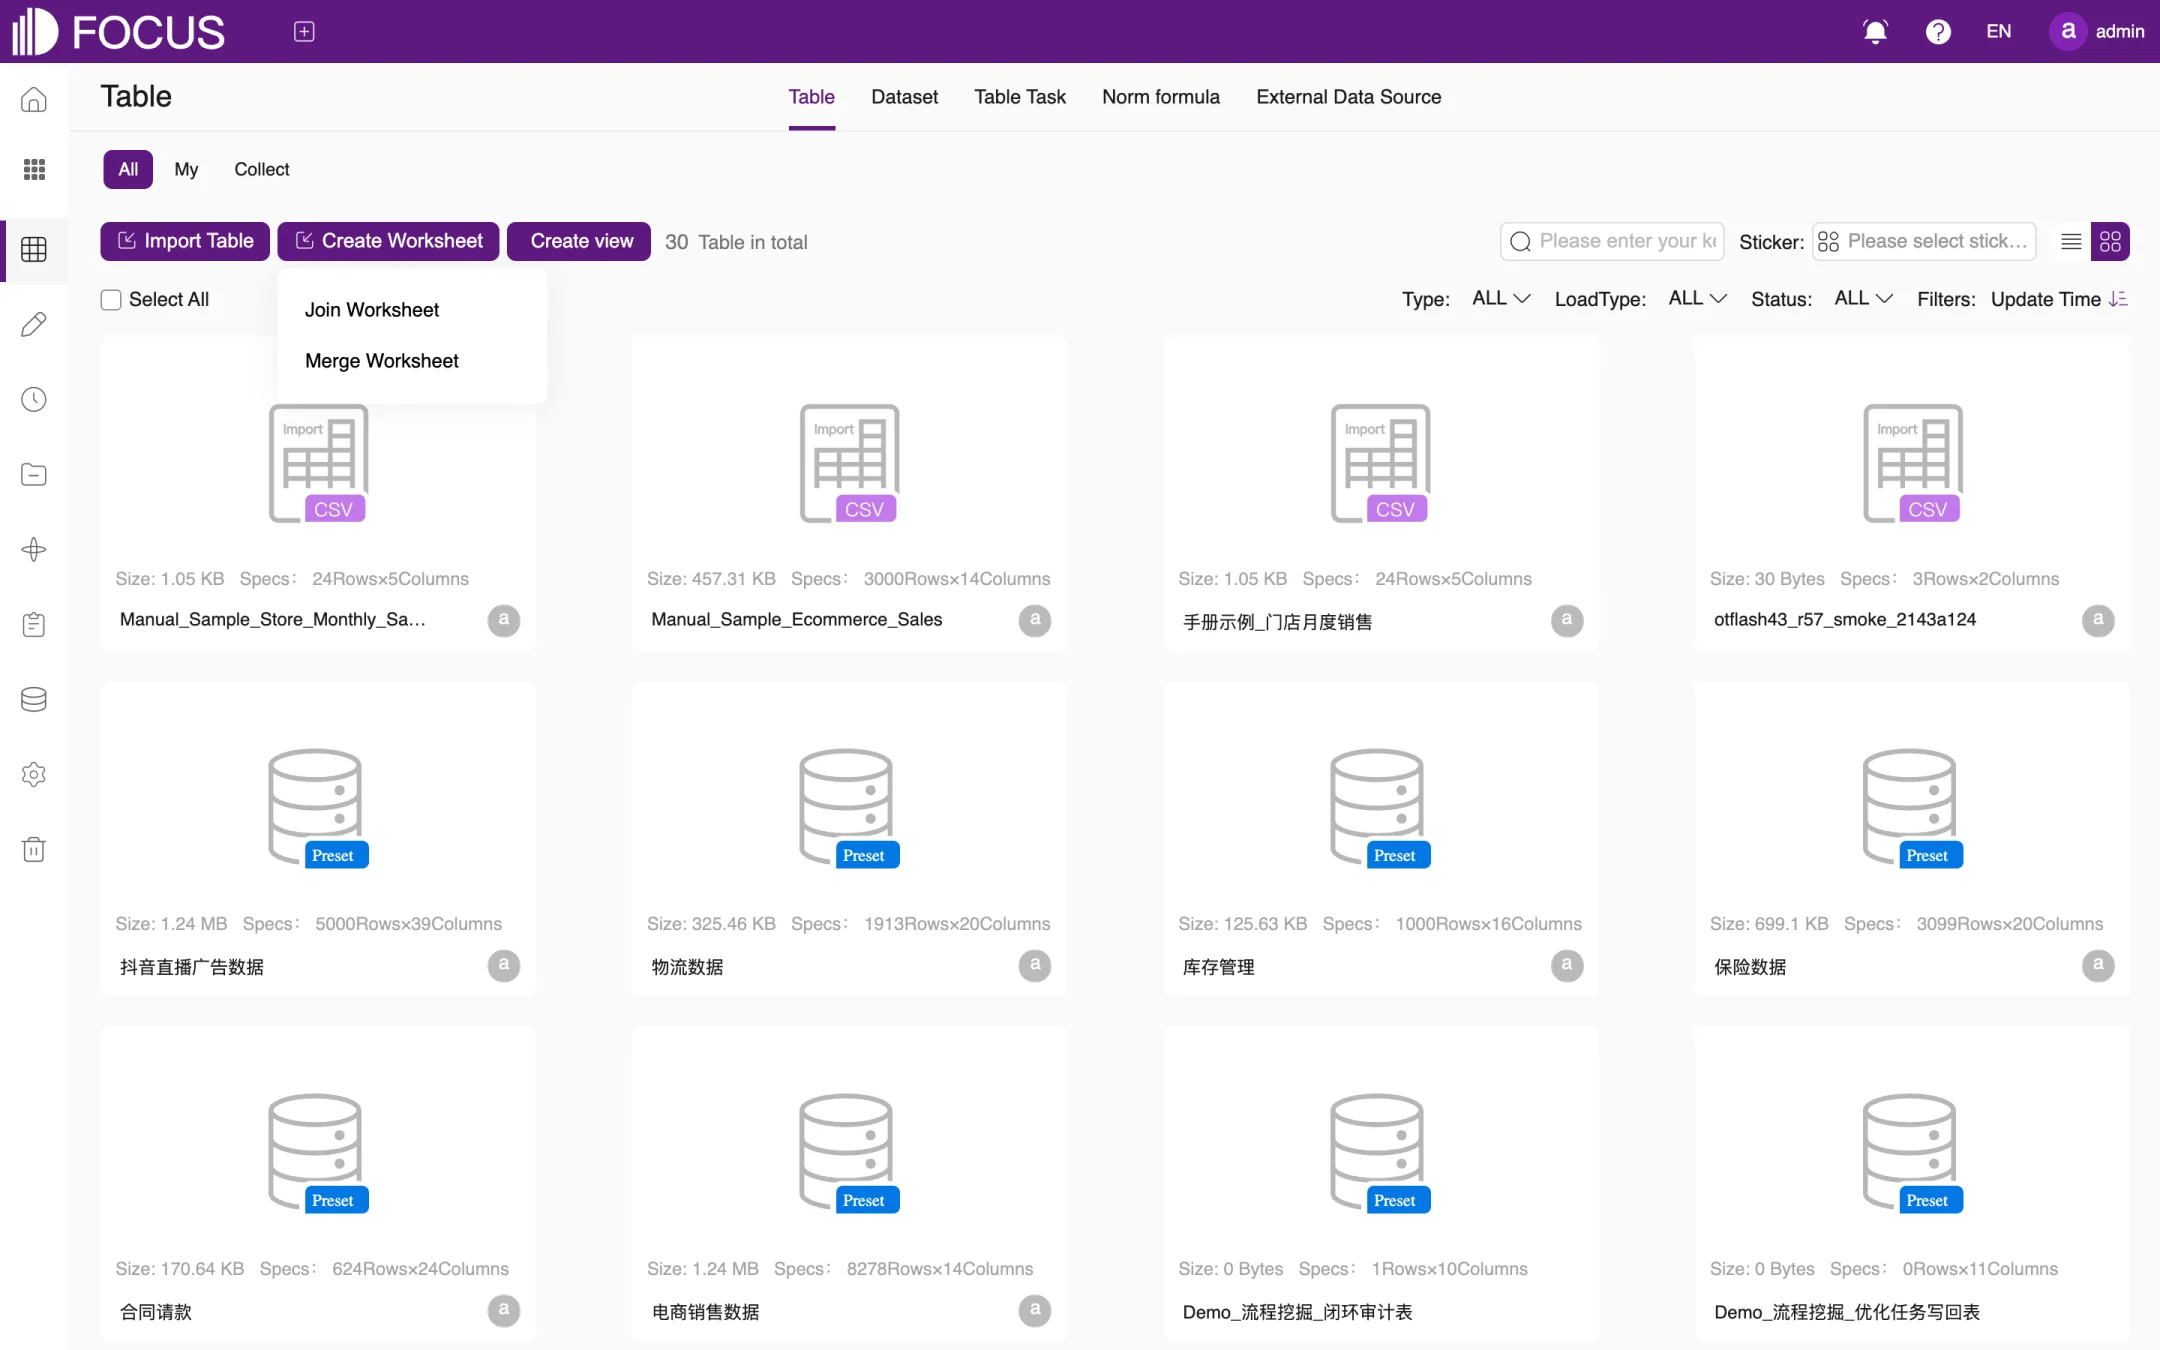
Tables are the data source for search, pinboards and Ontology. In Tables you can import local files or tables from a database, maintain each column's type and search properties, see which answers and pinboards use a table, and create worksheets, views and datasets from existing tables.
Click Tables in the left menu bar to open this module.
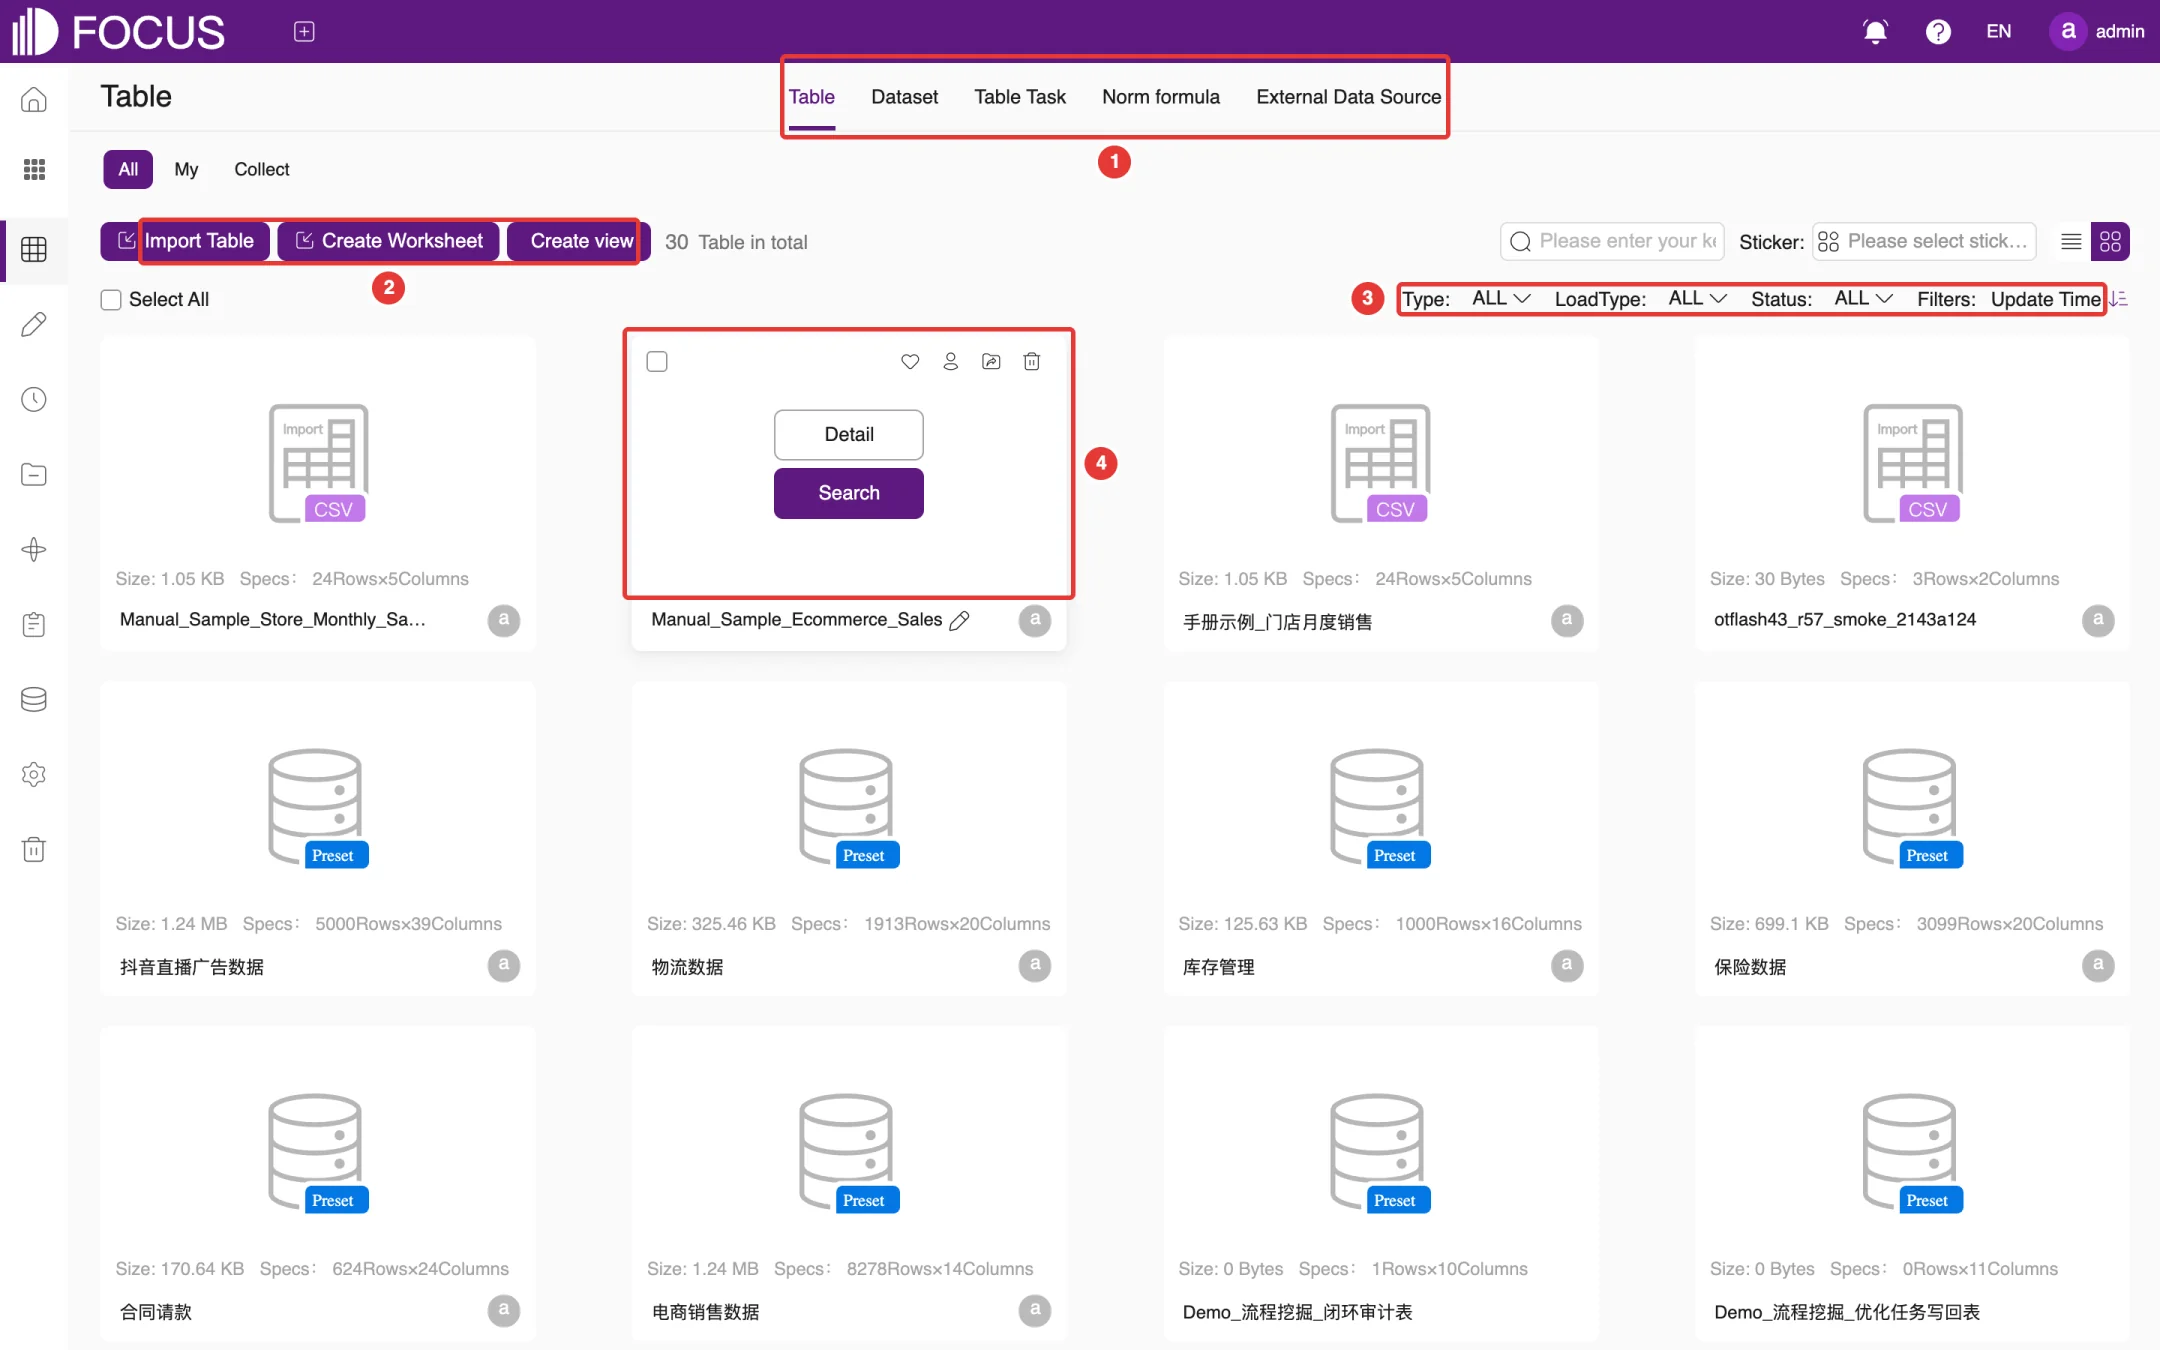
① Tabs: Table, Dataset, Table Task, Norm formula and External Data Source.
② Create buttons: Import Table, Create Worksheet and Create view.
③ Filters: filter by Type, LoadType and Status, and sort by Update Time. At the upper right you can also search by name or filter by Sticker (tag).
④ Card actions: hover over a table card to show the Detail and Search buttons. Click Detail to view and maintain the table structure; click Search to start a search with this table as the data source. The icons in the card's upper-right corner let you add the table to your favorites, change its owner, move it or delete it.
Figure 6-1. Table list
Each card shows the table's Size and Specs (rows × columns). Cards marked Preset are sample tables that come with the system; they are built-in demo data, so their names appear in Chinese.
6.2Import a table
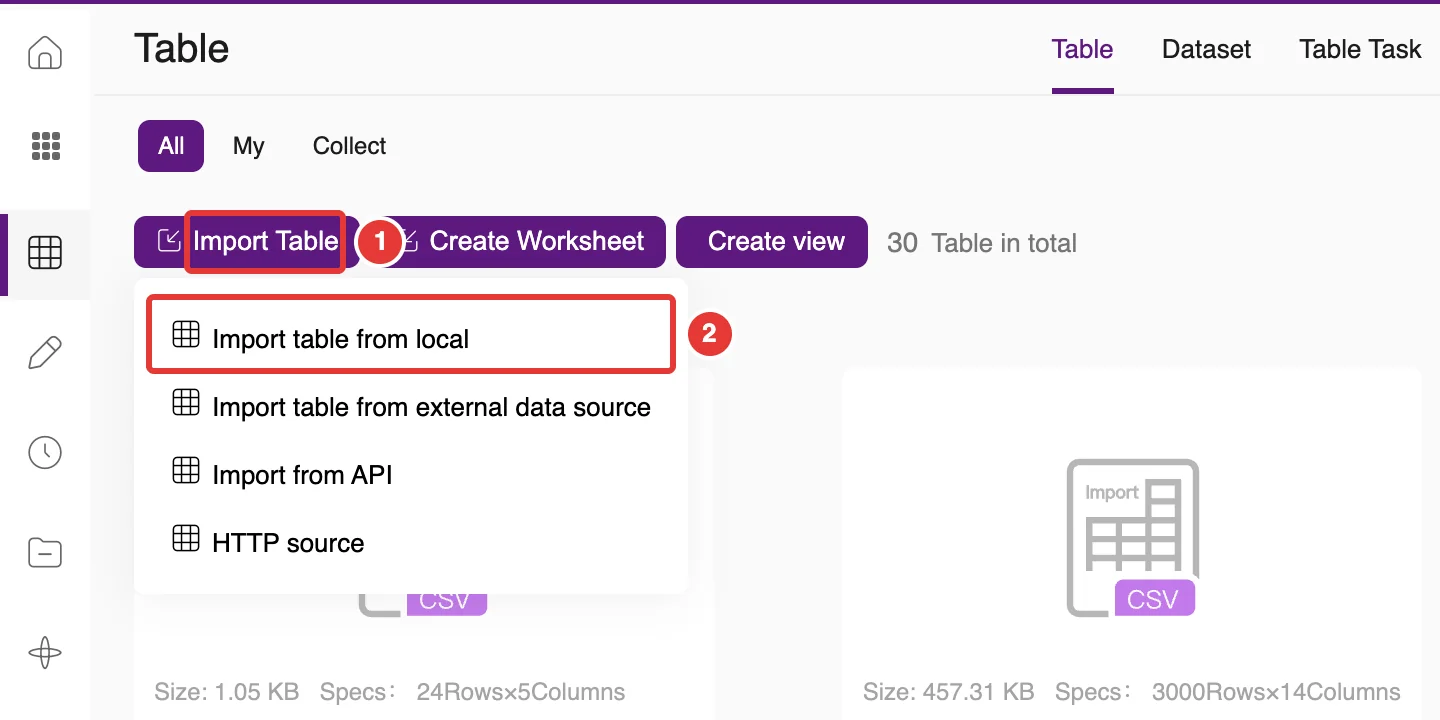
Click Import Table (①) to choose one of four import methods, as shown in Figure 6-2; ② marks the method used in the example below:
Import table from local: upload a CSV, Excel or JSON file;
Import table from external data source: choose tables from a connected database (see section 6.6);
Import from API: get data through an API;
HTTP source: set up data received over HTTP.
Figure 6-2. Ways to import a table
6.2.1Import a table from a local file
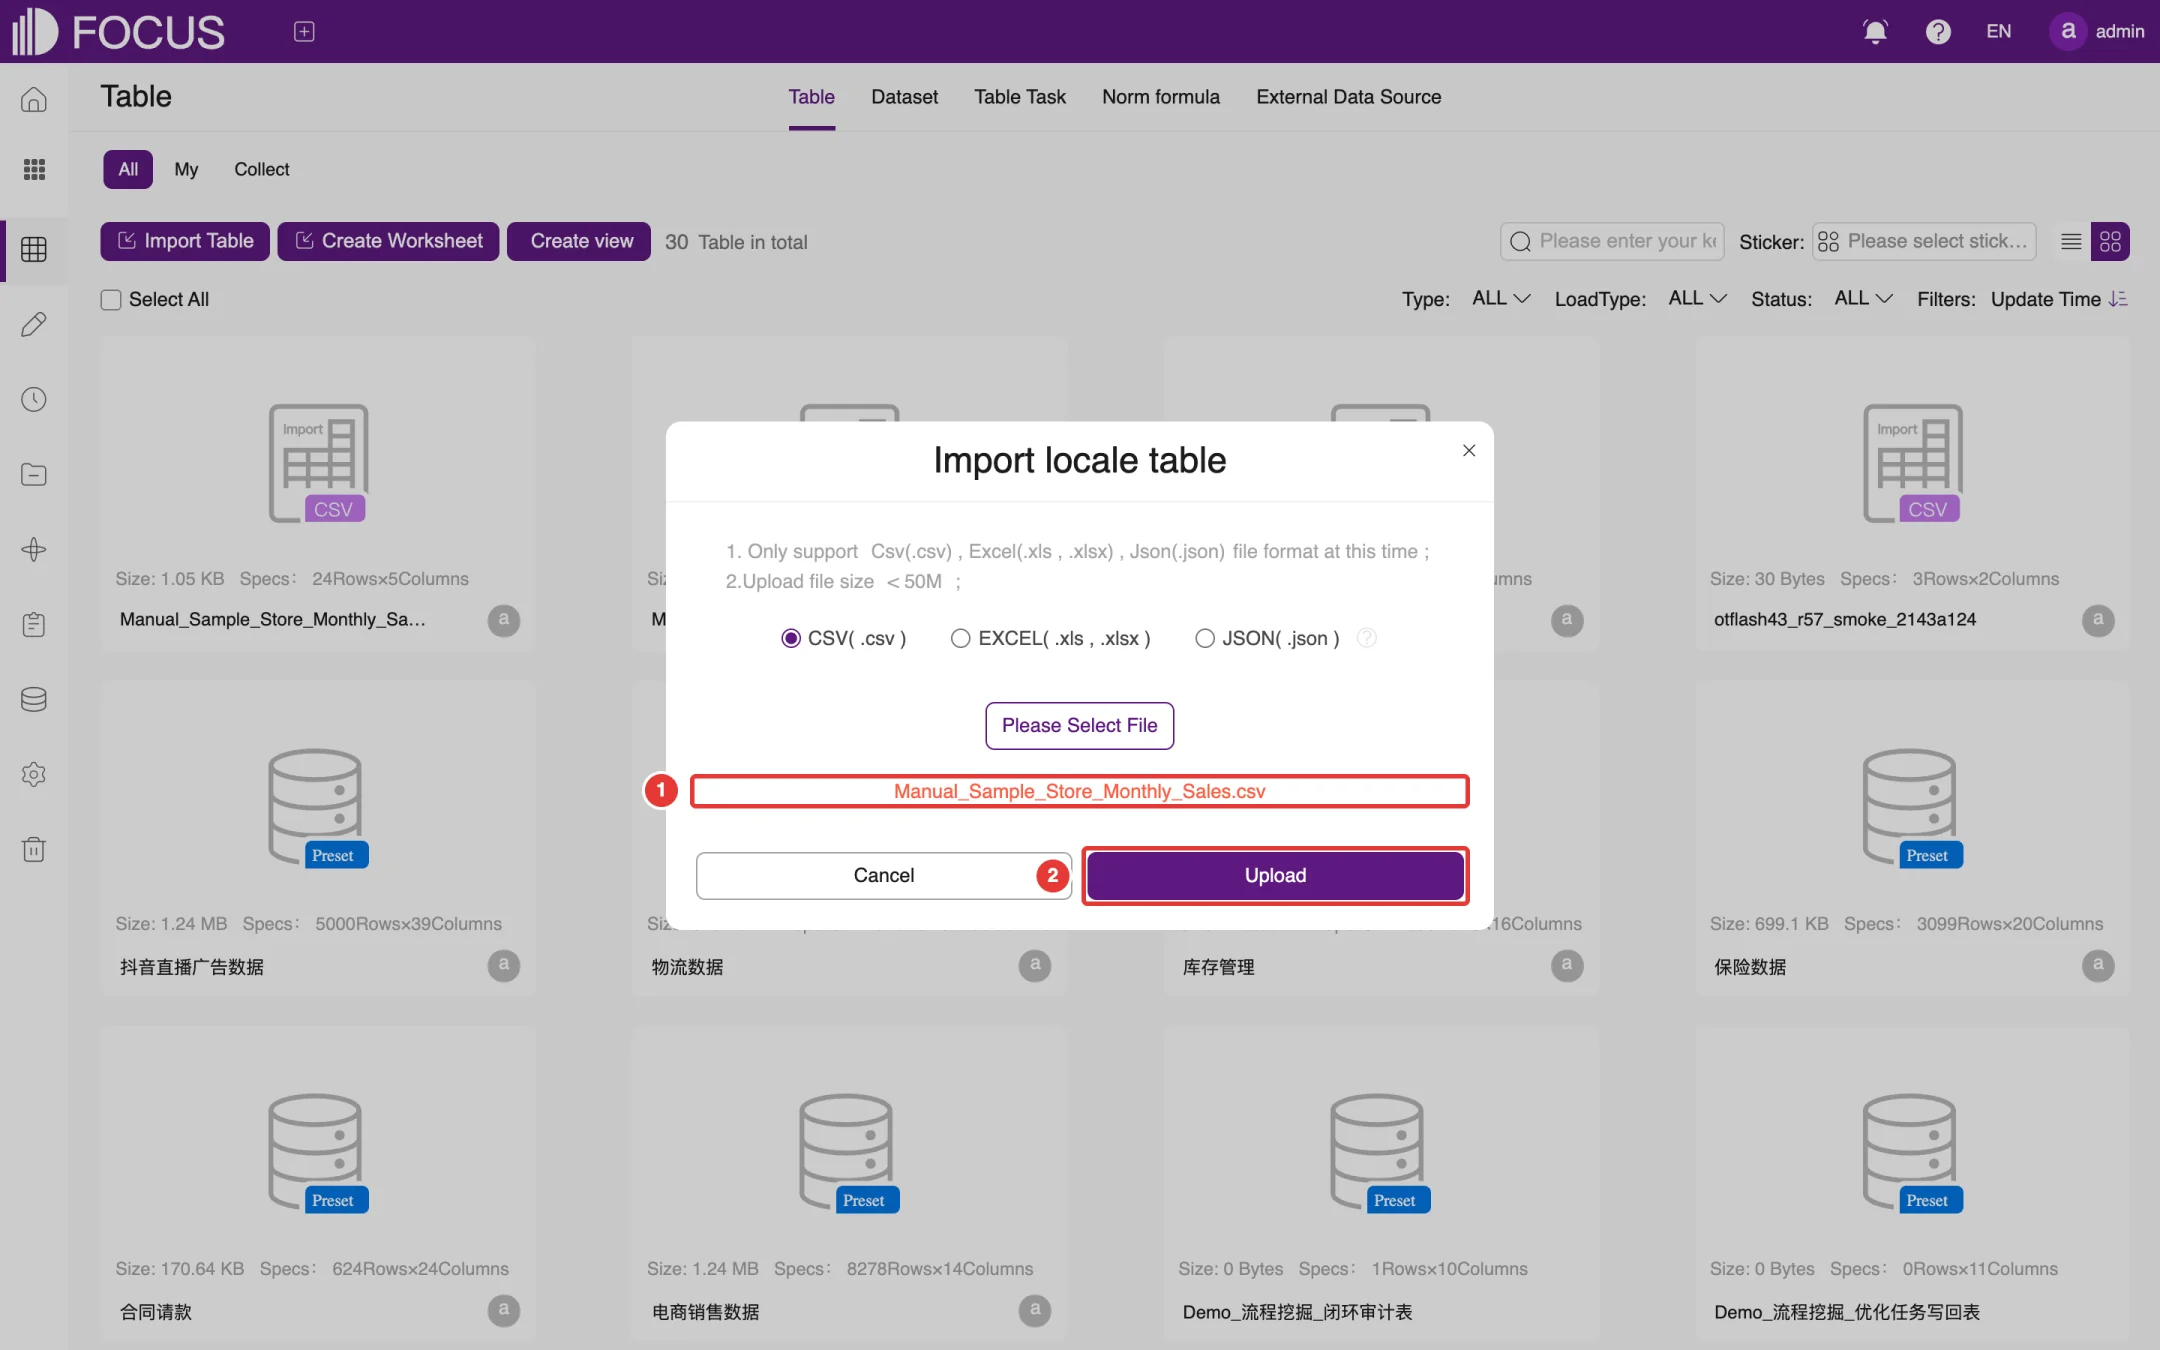
The following example imports the file Manual_Sample_Store_Monthly_Sales.csv:
Click Import Table and choose Import table from local to open the Import locale table dialog.
Choose the file format (CSV, EXCEL or JSON), click Please Select File and pick the local file. The file name appears at ①, as shown in Figure 6-3. The file must be smaller than 50 MB.
Click Upload (②).
Figure 6-3. Select a local file
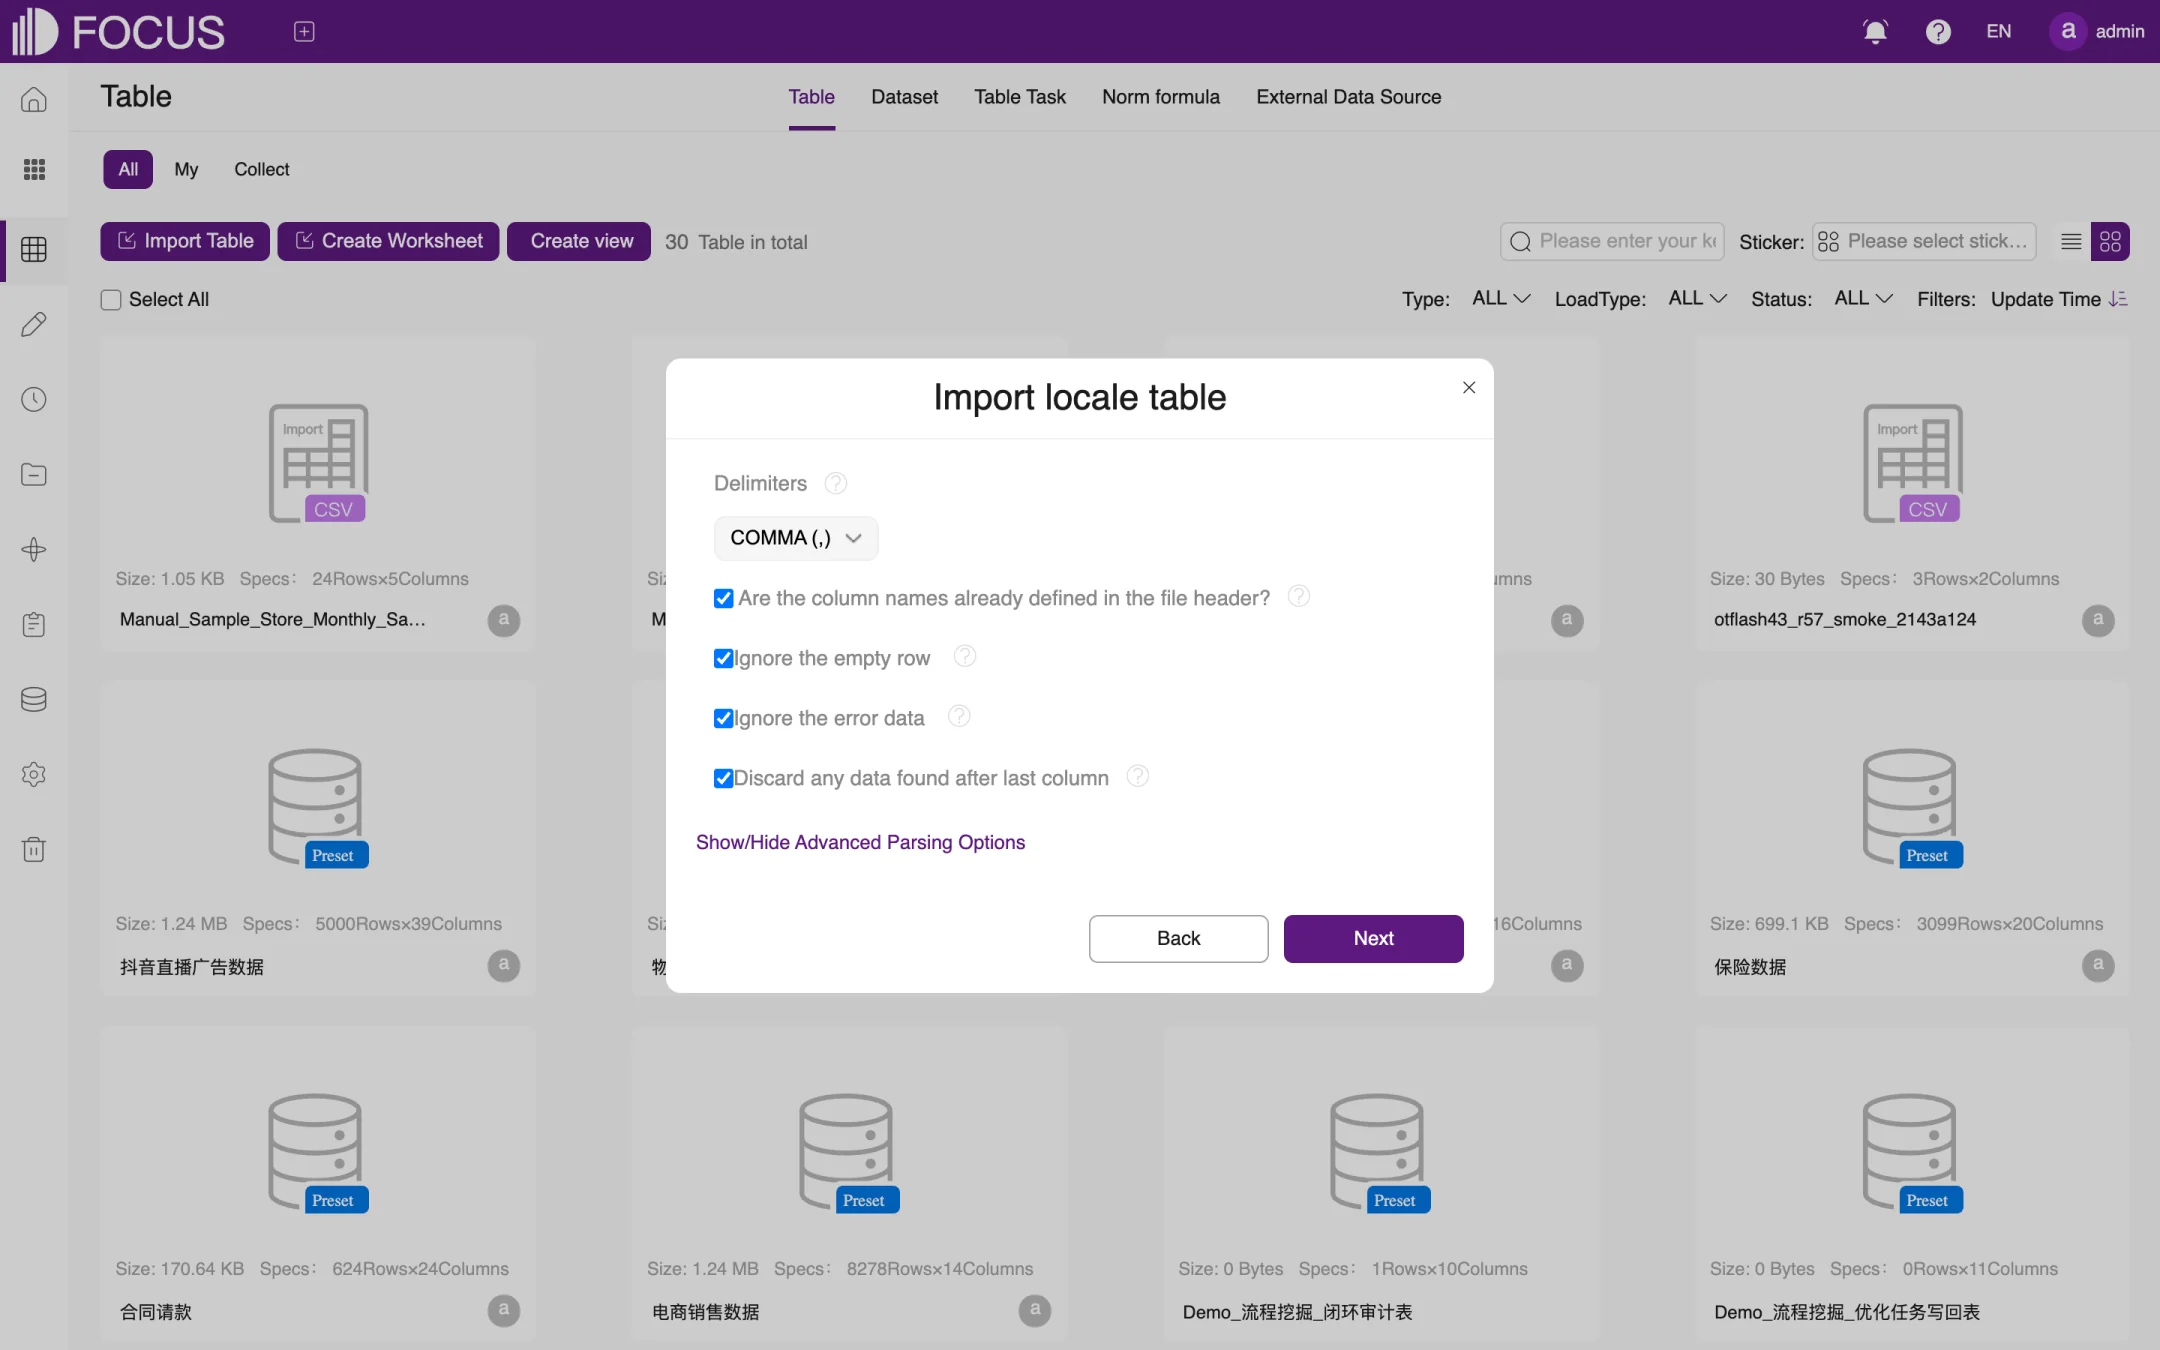
Set how the file is parsed, as shown in Figure 6-4: choose the Delimiters (usually COMMA (,) for CSV), confirm Are the column names already defined in the file header? (check it when the first row holds the column names), and choose whether to Ignore the empty row, Ignore the error data and Discard any data found after last column. Click Show/Hide Advanced Parsing Options for more options. When you are done, click Next.
Figure 6-4. Set parsing options
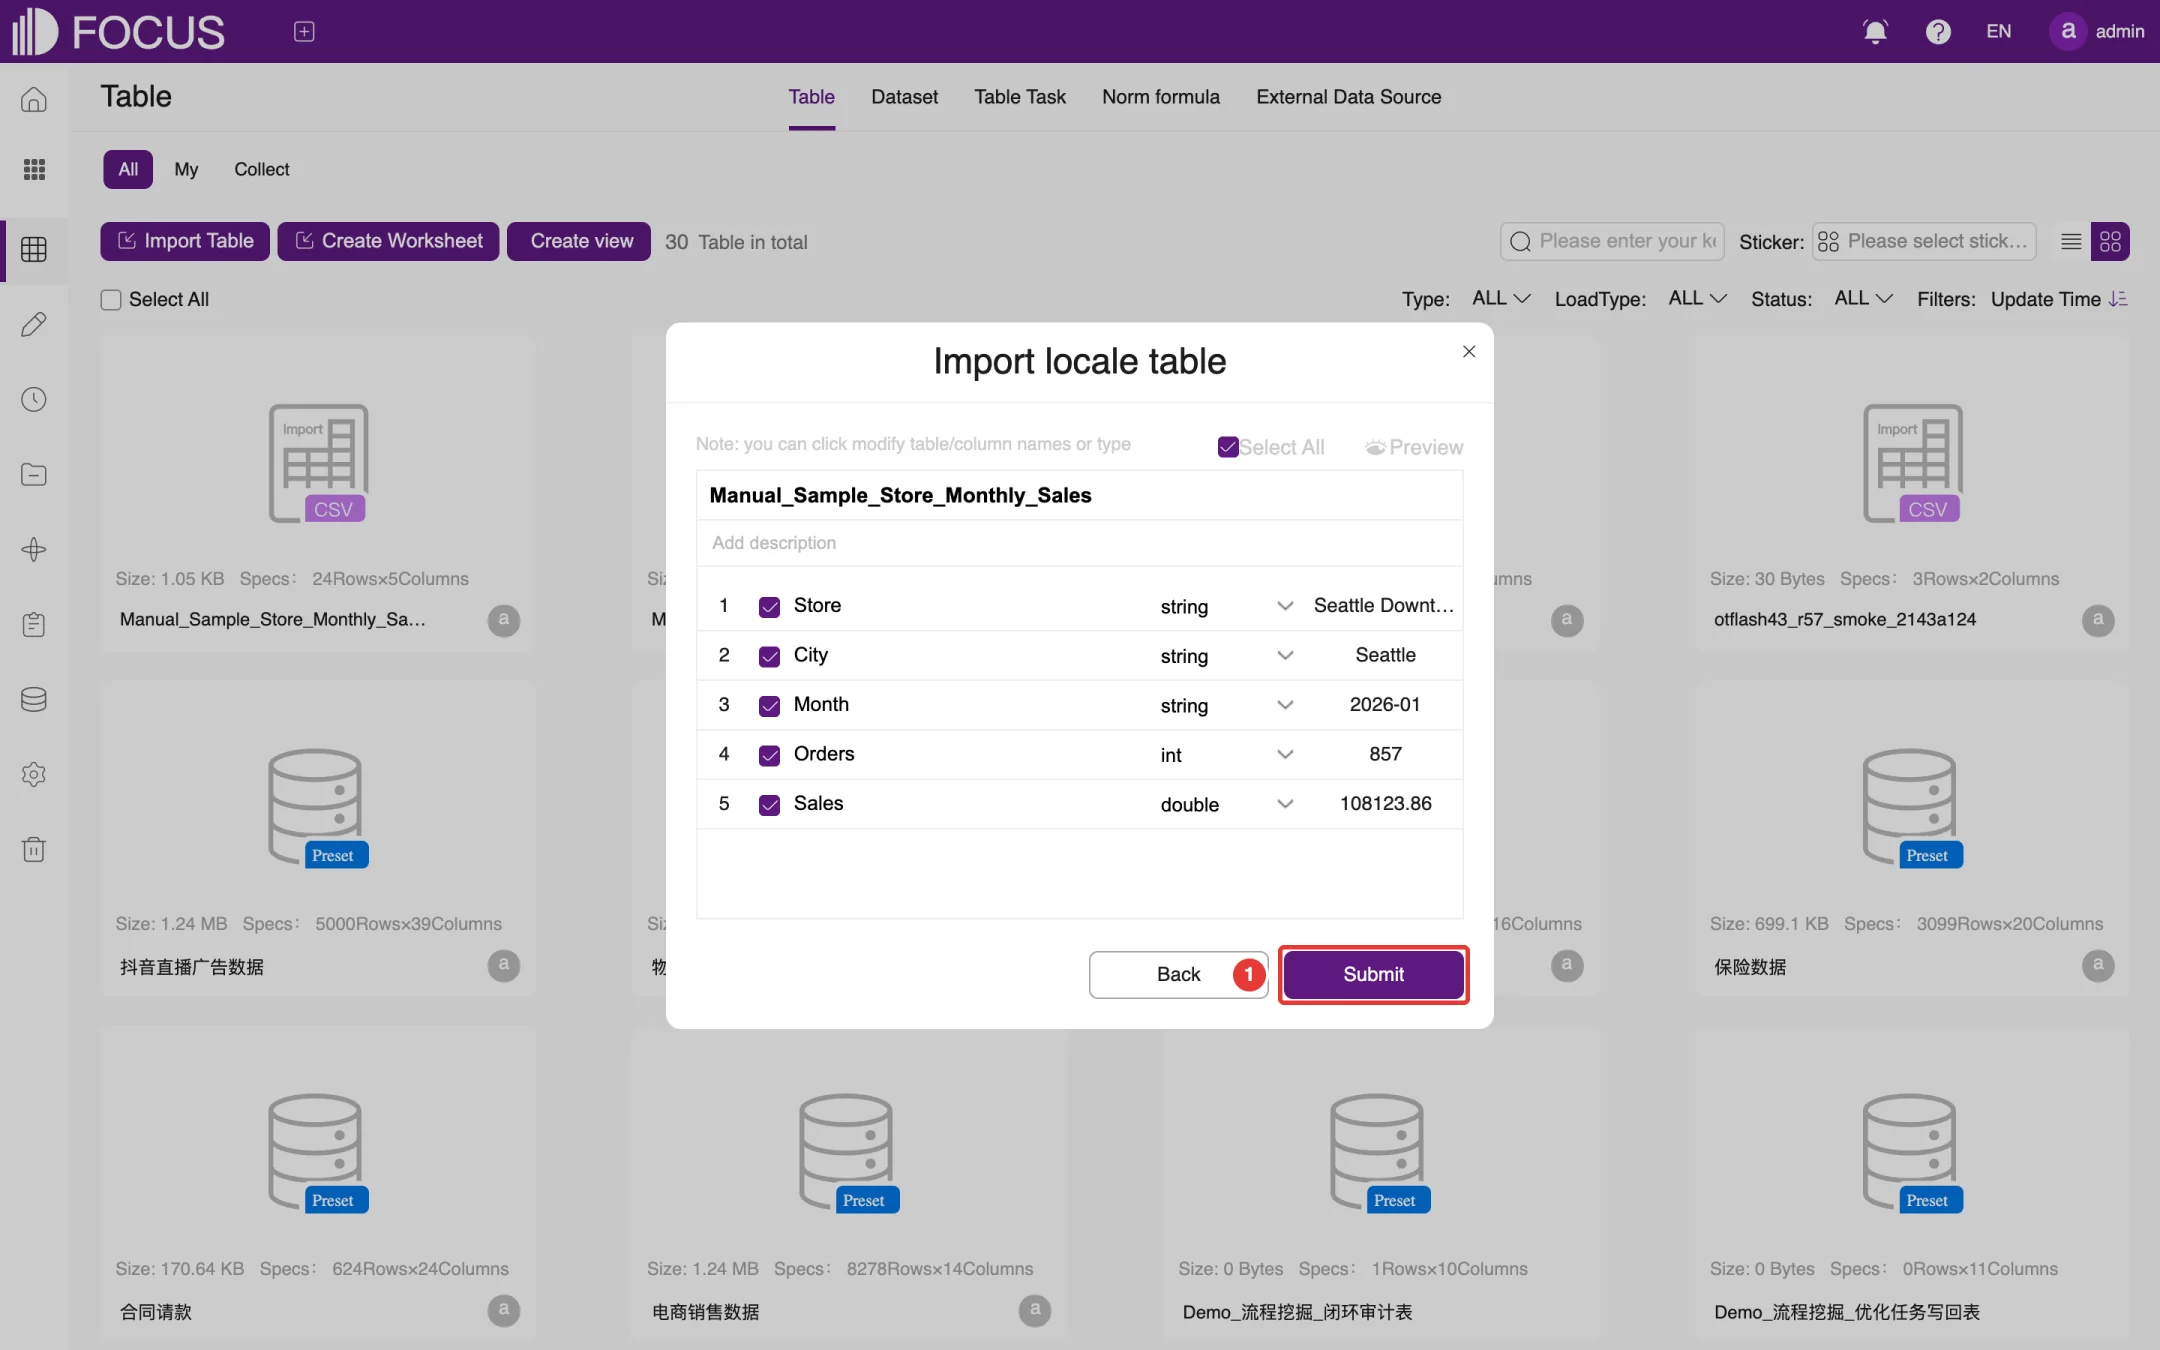
Check the table name and columns, as shown in Figure 6-5. You can change the table name and add a description. In the list, select the columns to import and adjust column names and data types (such as string, int or double); sample values are shown on the right. Click Preview to see how the imported data will look.
Click Submit (①) to finish the import.
Figure 6-5. Confirm the table name and columns
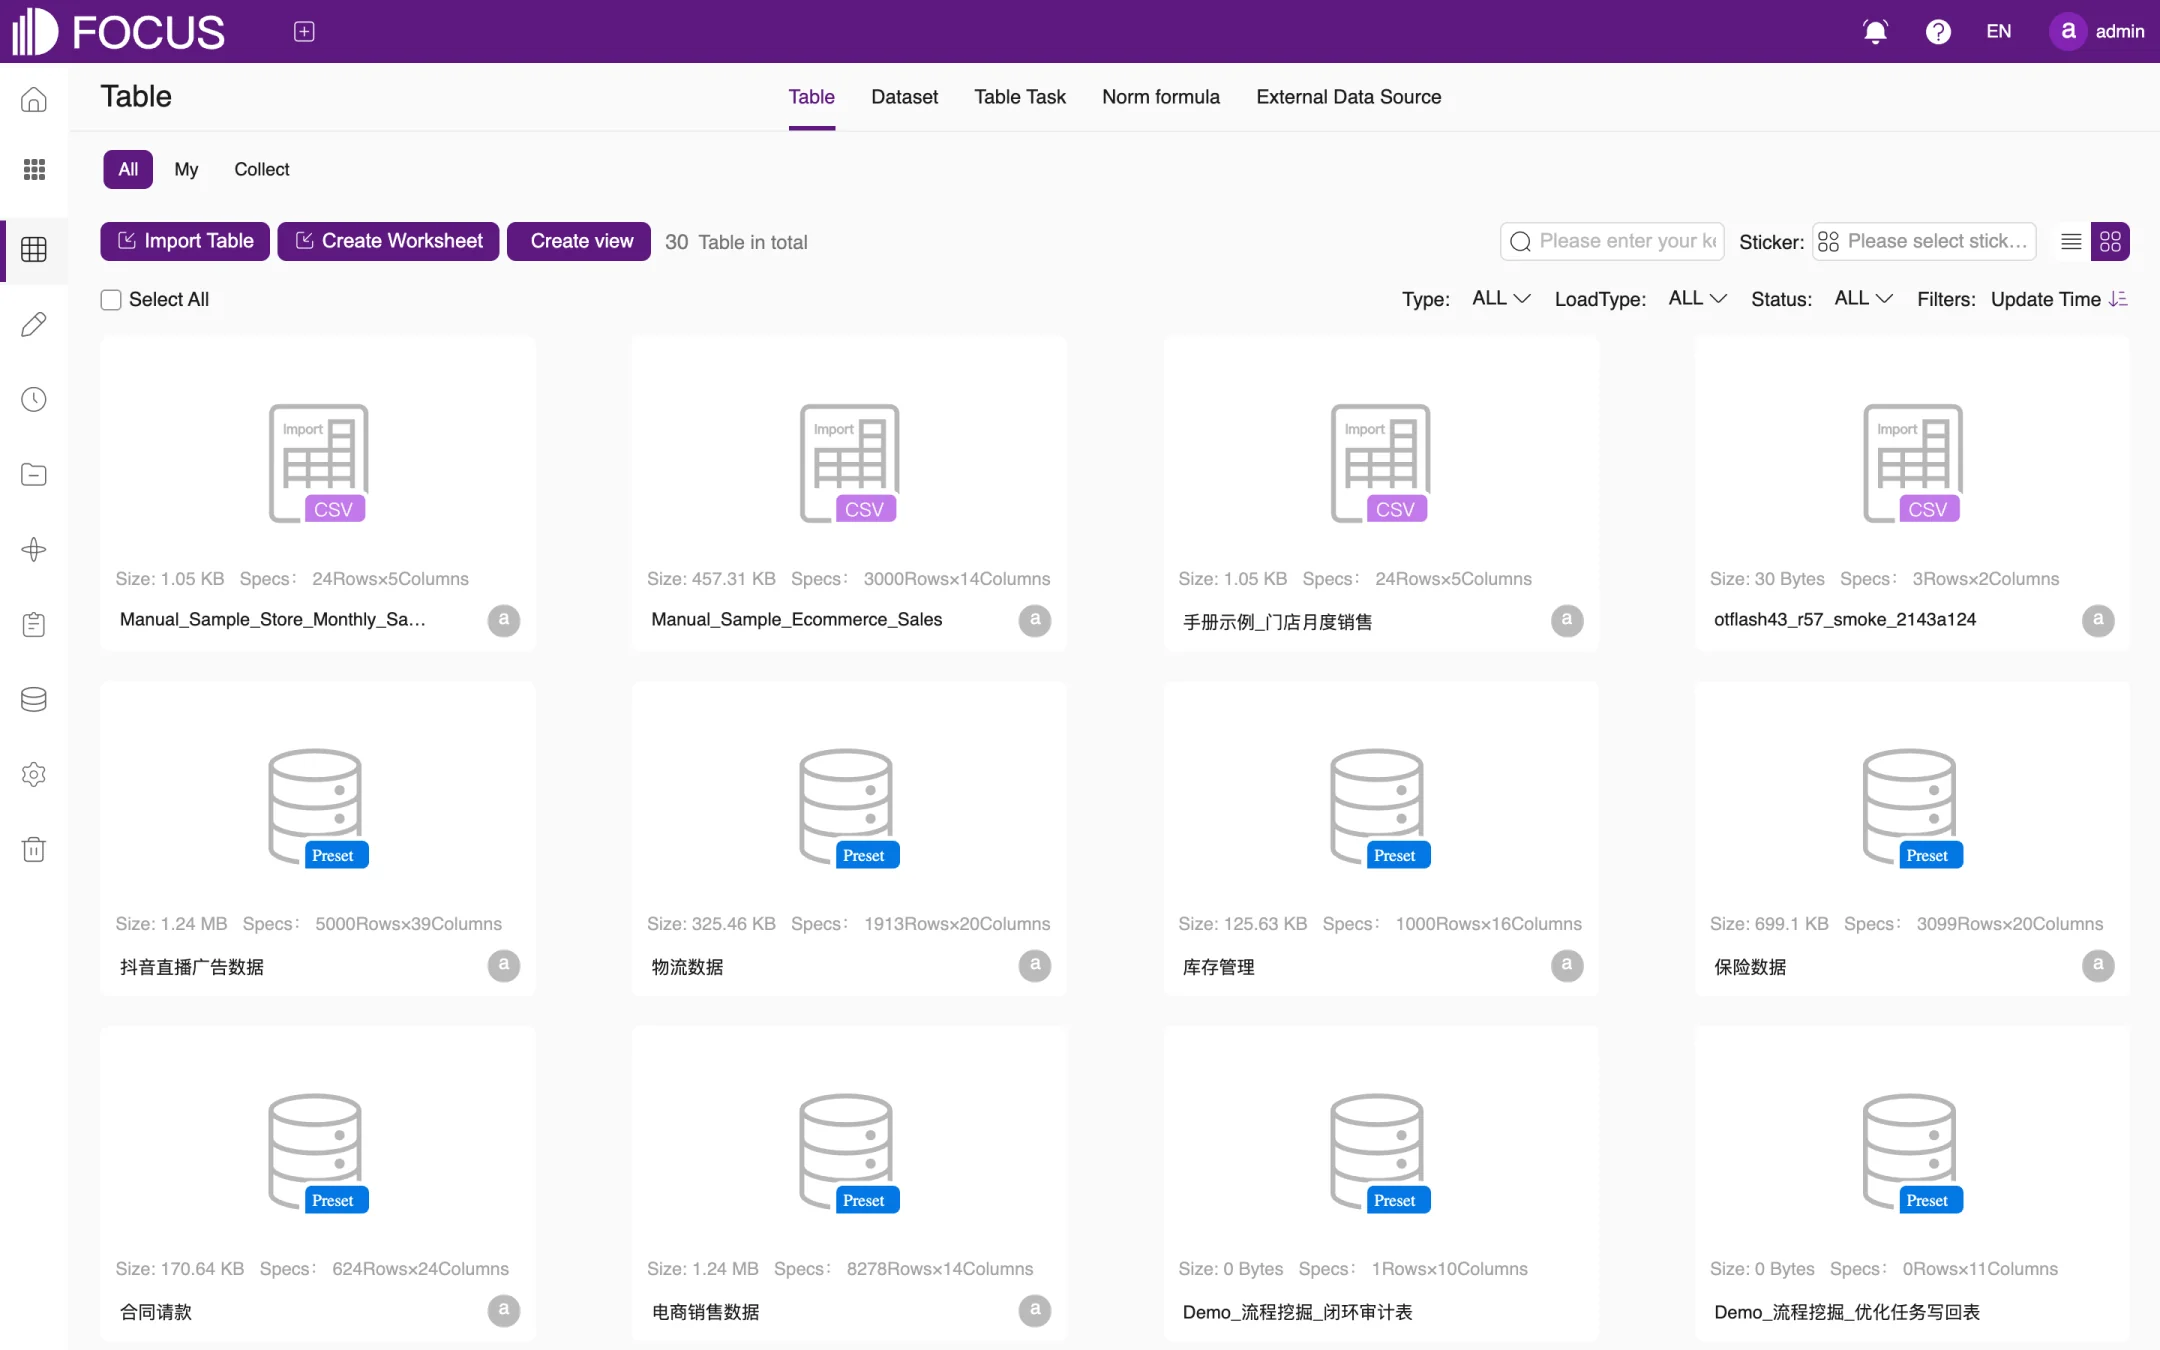
When the import is finished, the new table appears first in the table list, as shown in Figure 6-6.
Figure 6-6. Import finished
Note: If a column name is the same as a search keyword, the system renames the column on import by adding a sequence number (such as _1) so that it does not clash with the keyword. No column in this example clashes with a keyword, so Store, City, Month, Orders and Sales keep their names. You can change a column's display name in the table detail after import.
6.3Table detail
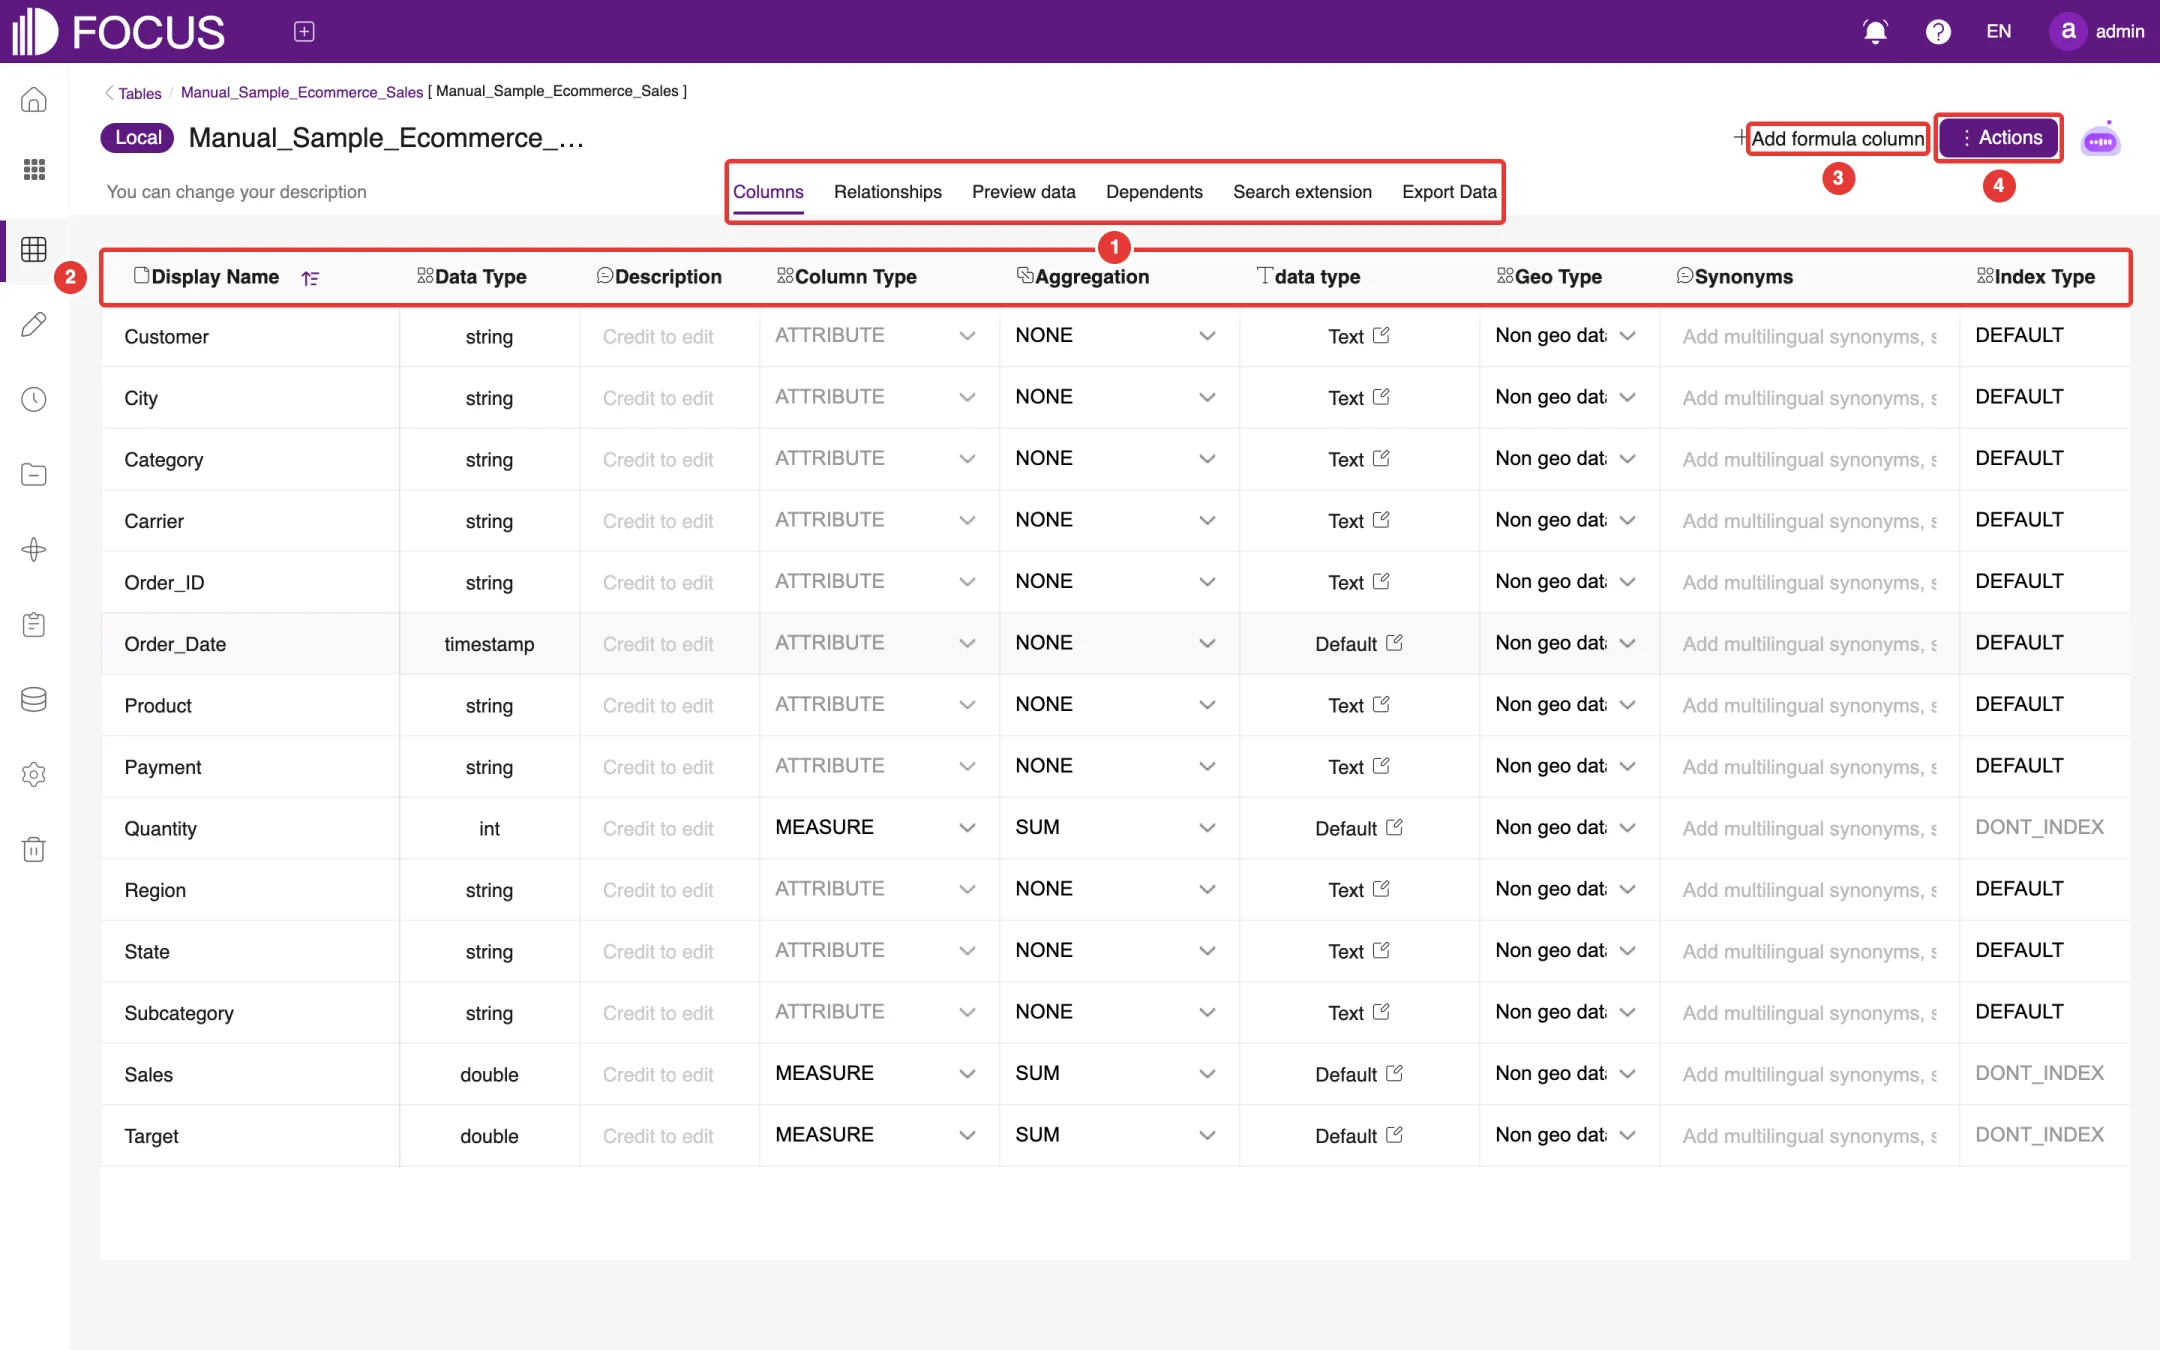
Click Detail on a table card to open the table detail page, as shown in Figure 6-7:
① Detail tabs: Columns, Relationships, Preview data, Dependents, Search extension and Export Data.
② Column settings: for each column, set the Display Name, Data Type, Description, Column Type, Aggregation, data format, Geo Type, Synonyms, Index Type and priority (1–100), and whether it is Visible To Model.
③ Add formula column: add a column calculated by a formula.
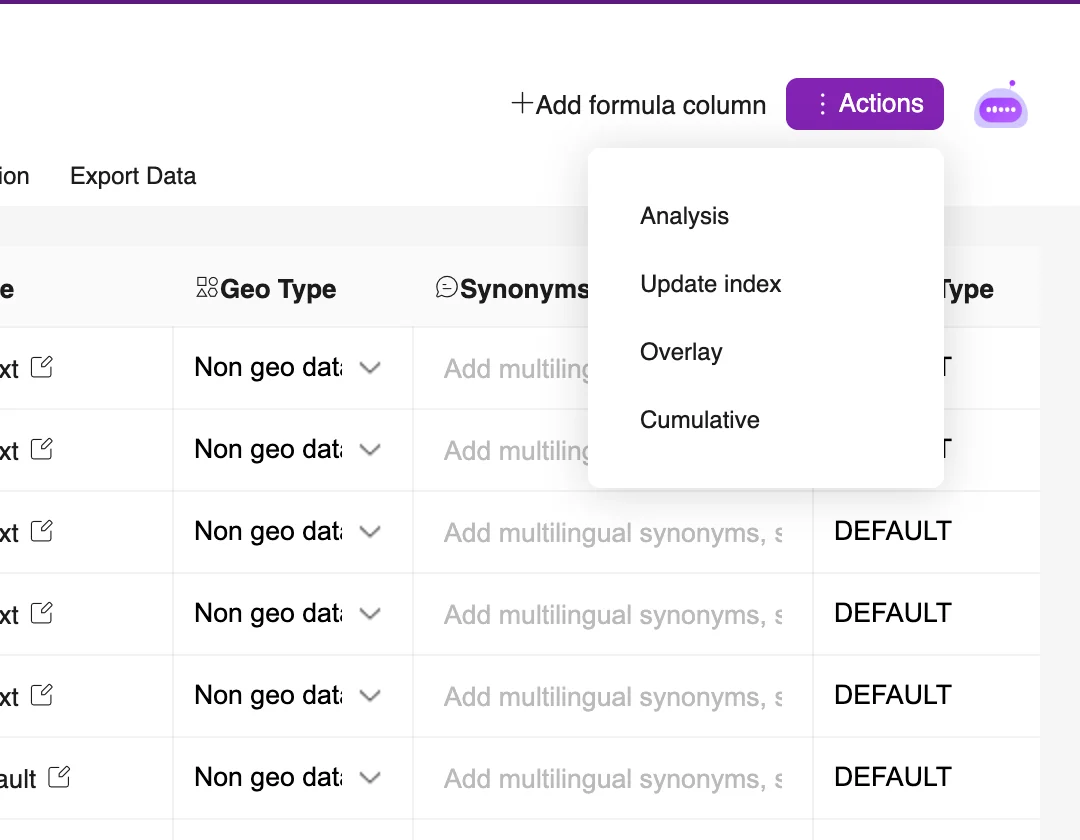
④ Actions: a menu of table-level actions, such as Analysis.
Figure 6-7. Table detail: Columns
6.3.1Columns
The column settings decide how the table behaves in search. The most common settings are:
Setting
Description
Display Name
The column name used in search; change it to the term your business users know
Column Type
ATTRIBUTE columns are used for grouping and filtering; MEASURE columns are aggregated
Aggregation
The default aggregation of a measure column, such as SUM
Data format
How numbers, dates and other values are displayed. In the English UI this column is headed data type (lowercase), next to Aggregation; do not confuse it with Data Type
Geo Type
Marks geographic columns such as states or cities so that searches can show them on a map
Synonyms
Adds synonyms for the column name, separated by commas; typing a synonym in a search also finds the column
Index Type
Whether to index the column's values for search suggestions (DEFAULT or DONT_INDEX)
Visible To Model
Whether FocusGPT and other large-model features may use the column
Click Actions in the upper-right corner to run actions on the whole table, such as Analysis, as shown in Figure 6-8.
Figure 6-8. Table Actions menu
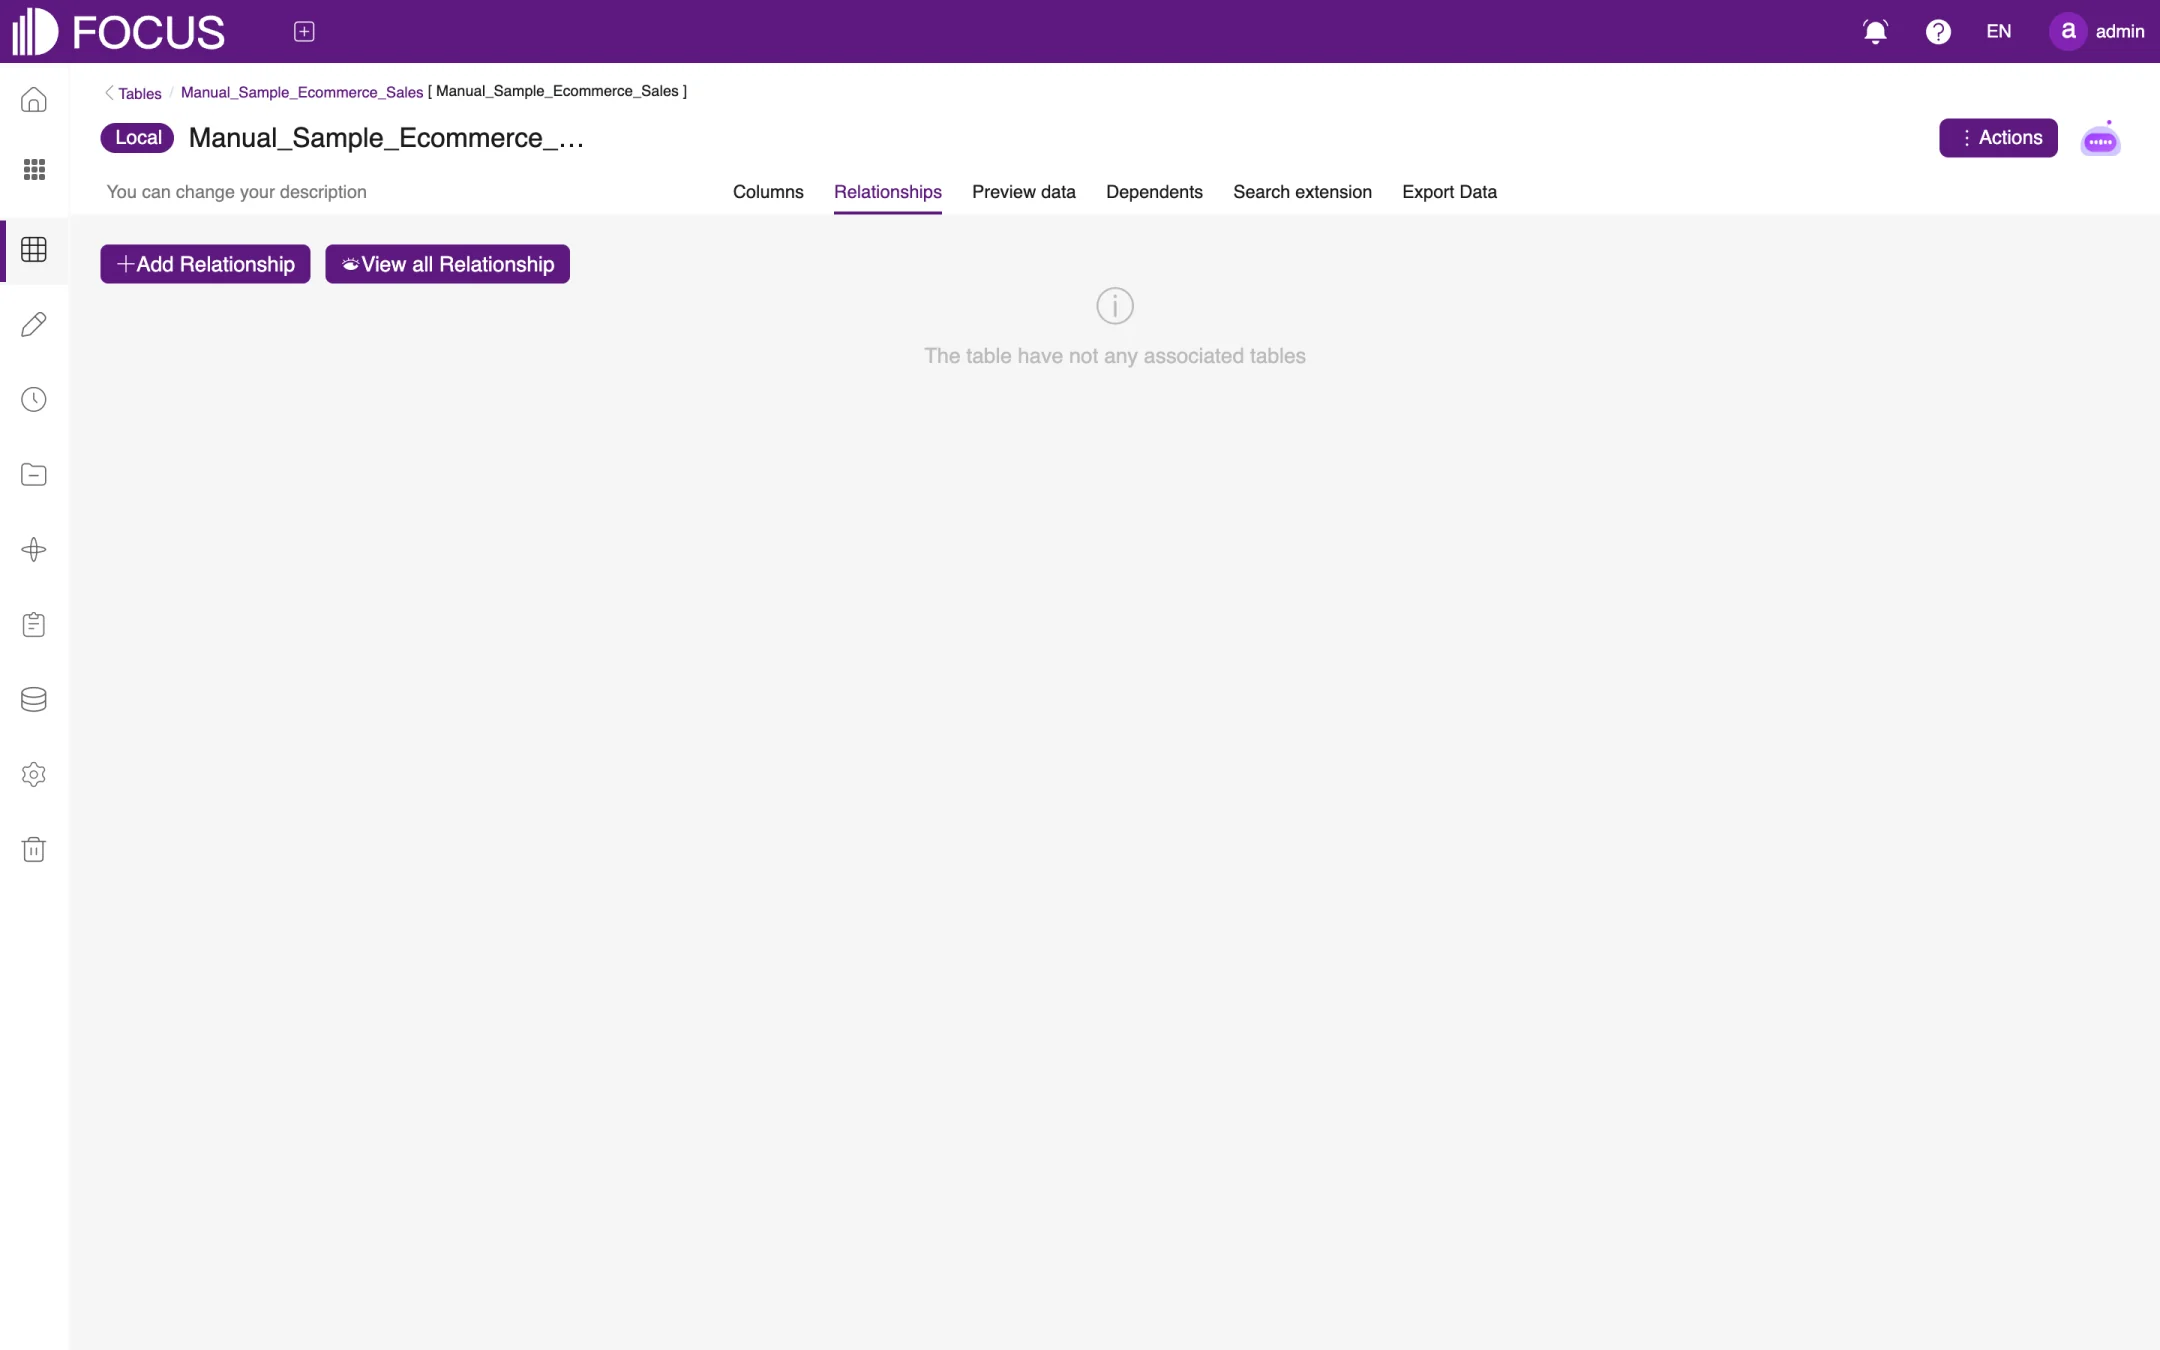
6.3.2Relationships
The Relationships tab links tables to one another. Once tables are related, a single search can use columns from several tables, as shown in Figure 6-9.
Figure 6-9. Relationships
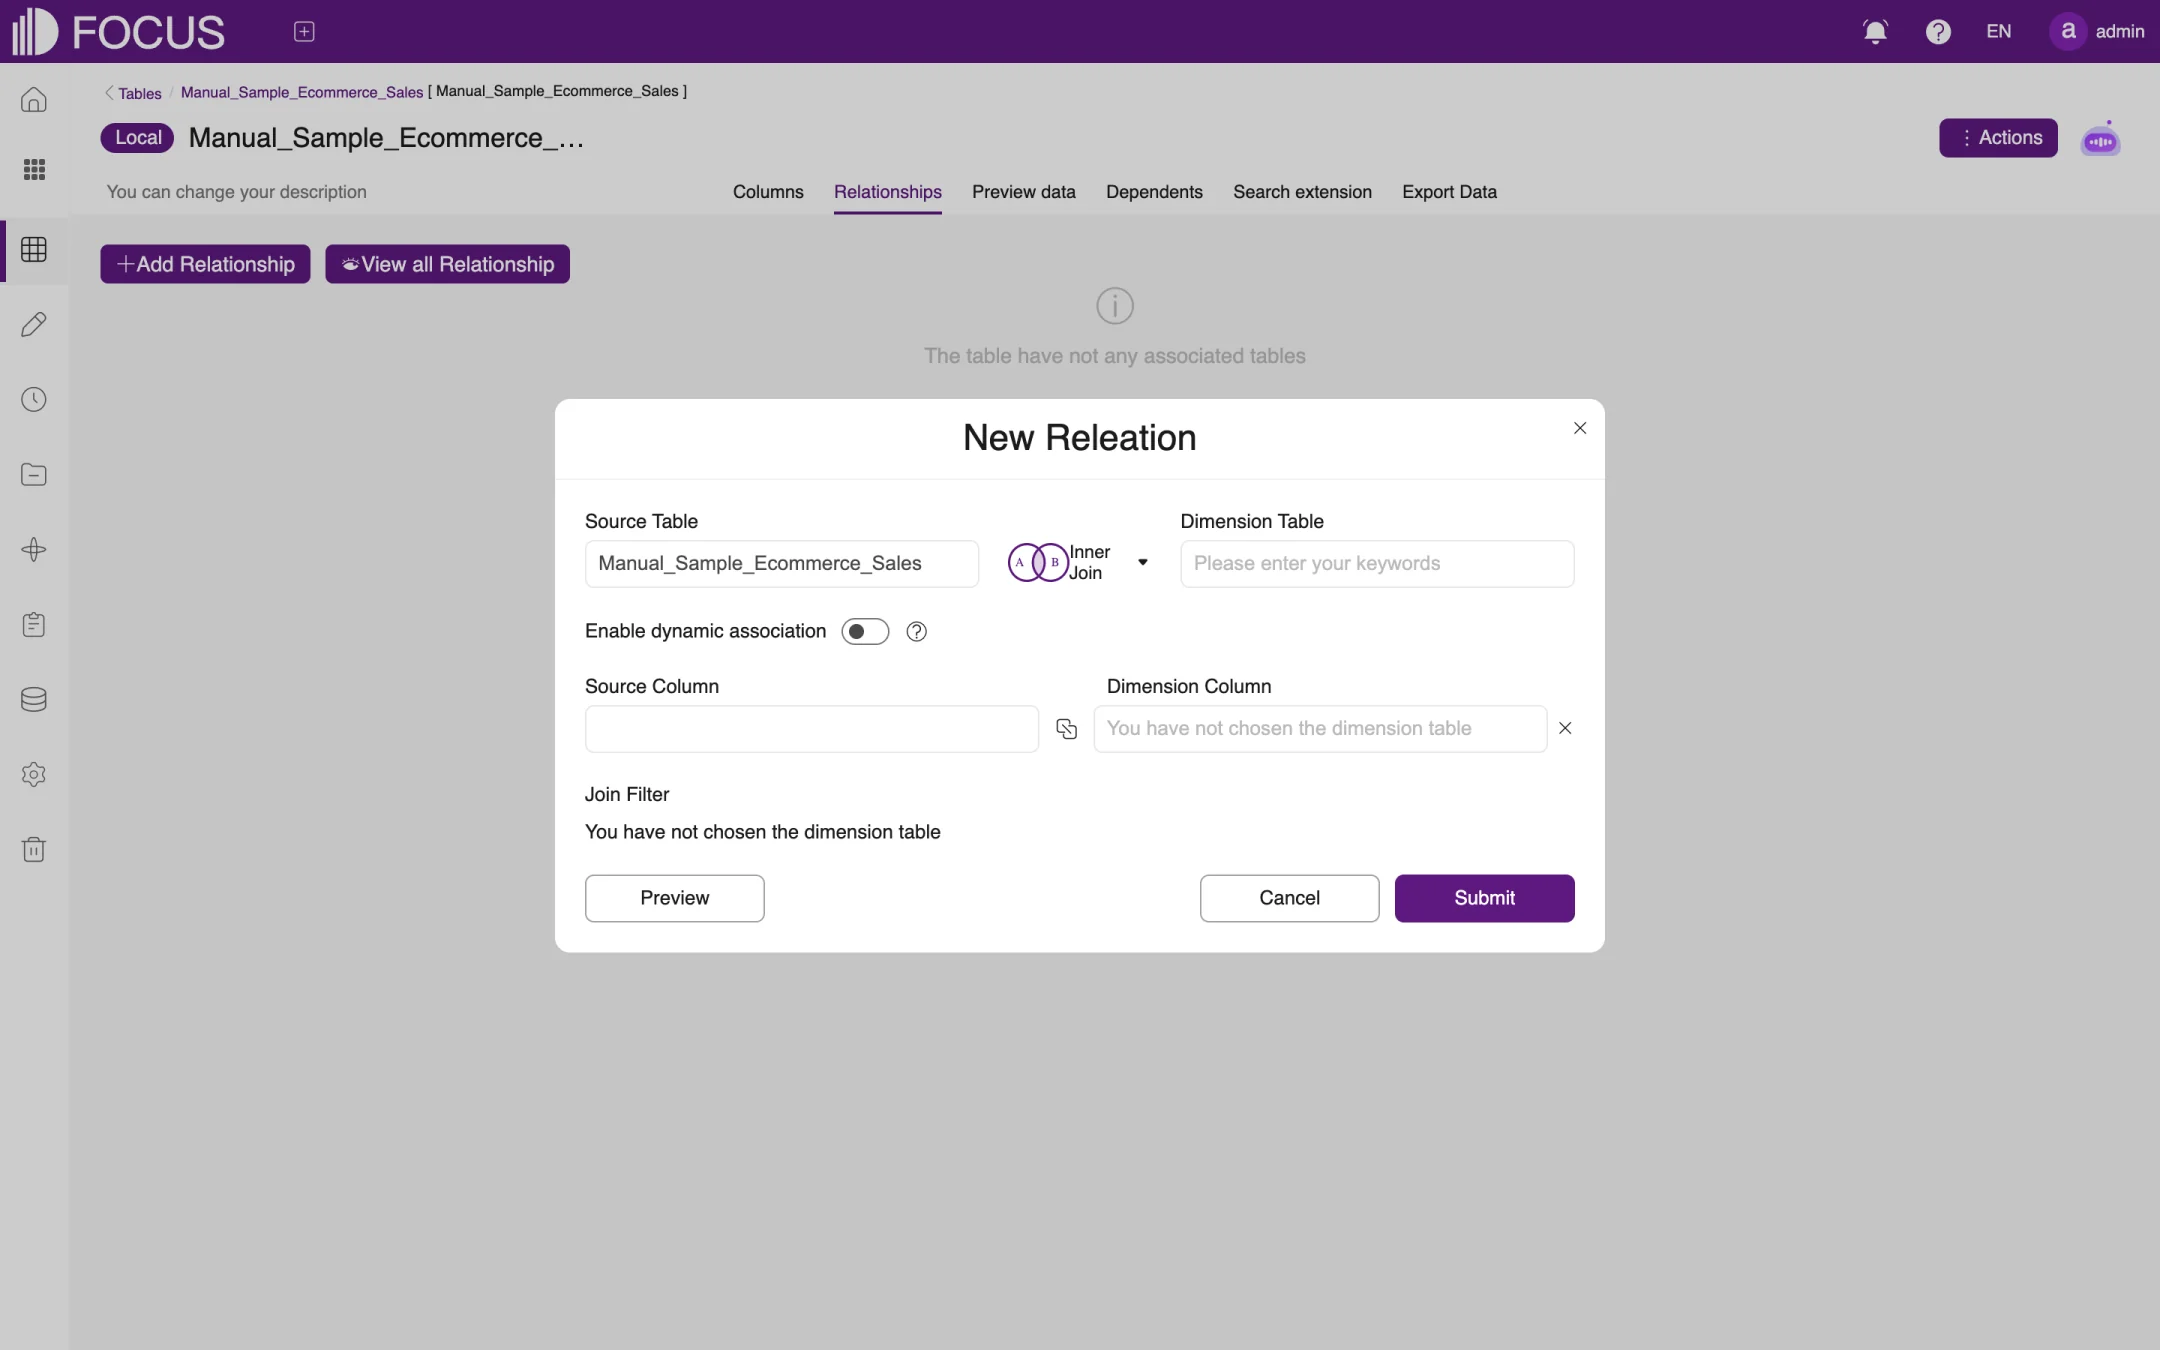
Click Add Relationship to open the relationship dialog (its title reads New Releation on screen), as shown in Figure 6-10:
The Source Table is the current table by default. Choose the join type (such as Inner Join), then choose the Dimension Table to relate to.
Choose the Source Column and the Dimension Column, that is, the columns used to match the two tables.
If needed, turn on Enable dynamic association or set a Join Filter.
Click Preview to check the result, then click Submit.
Figure 6-10. New relationship
Click View all Relationship to see the relationships of all tables in the system.
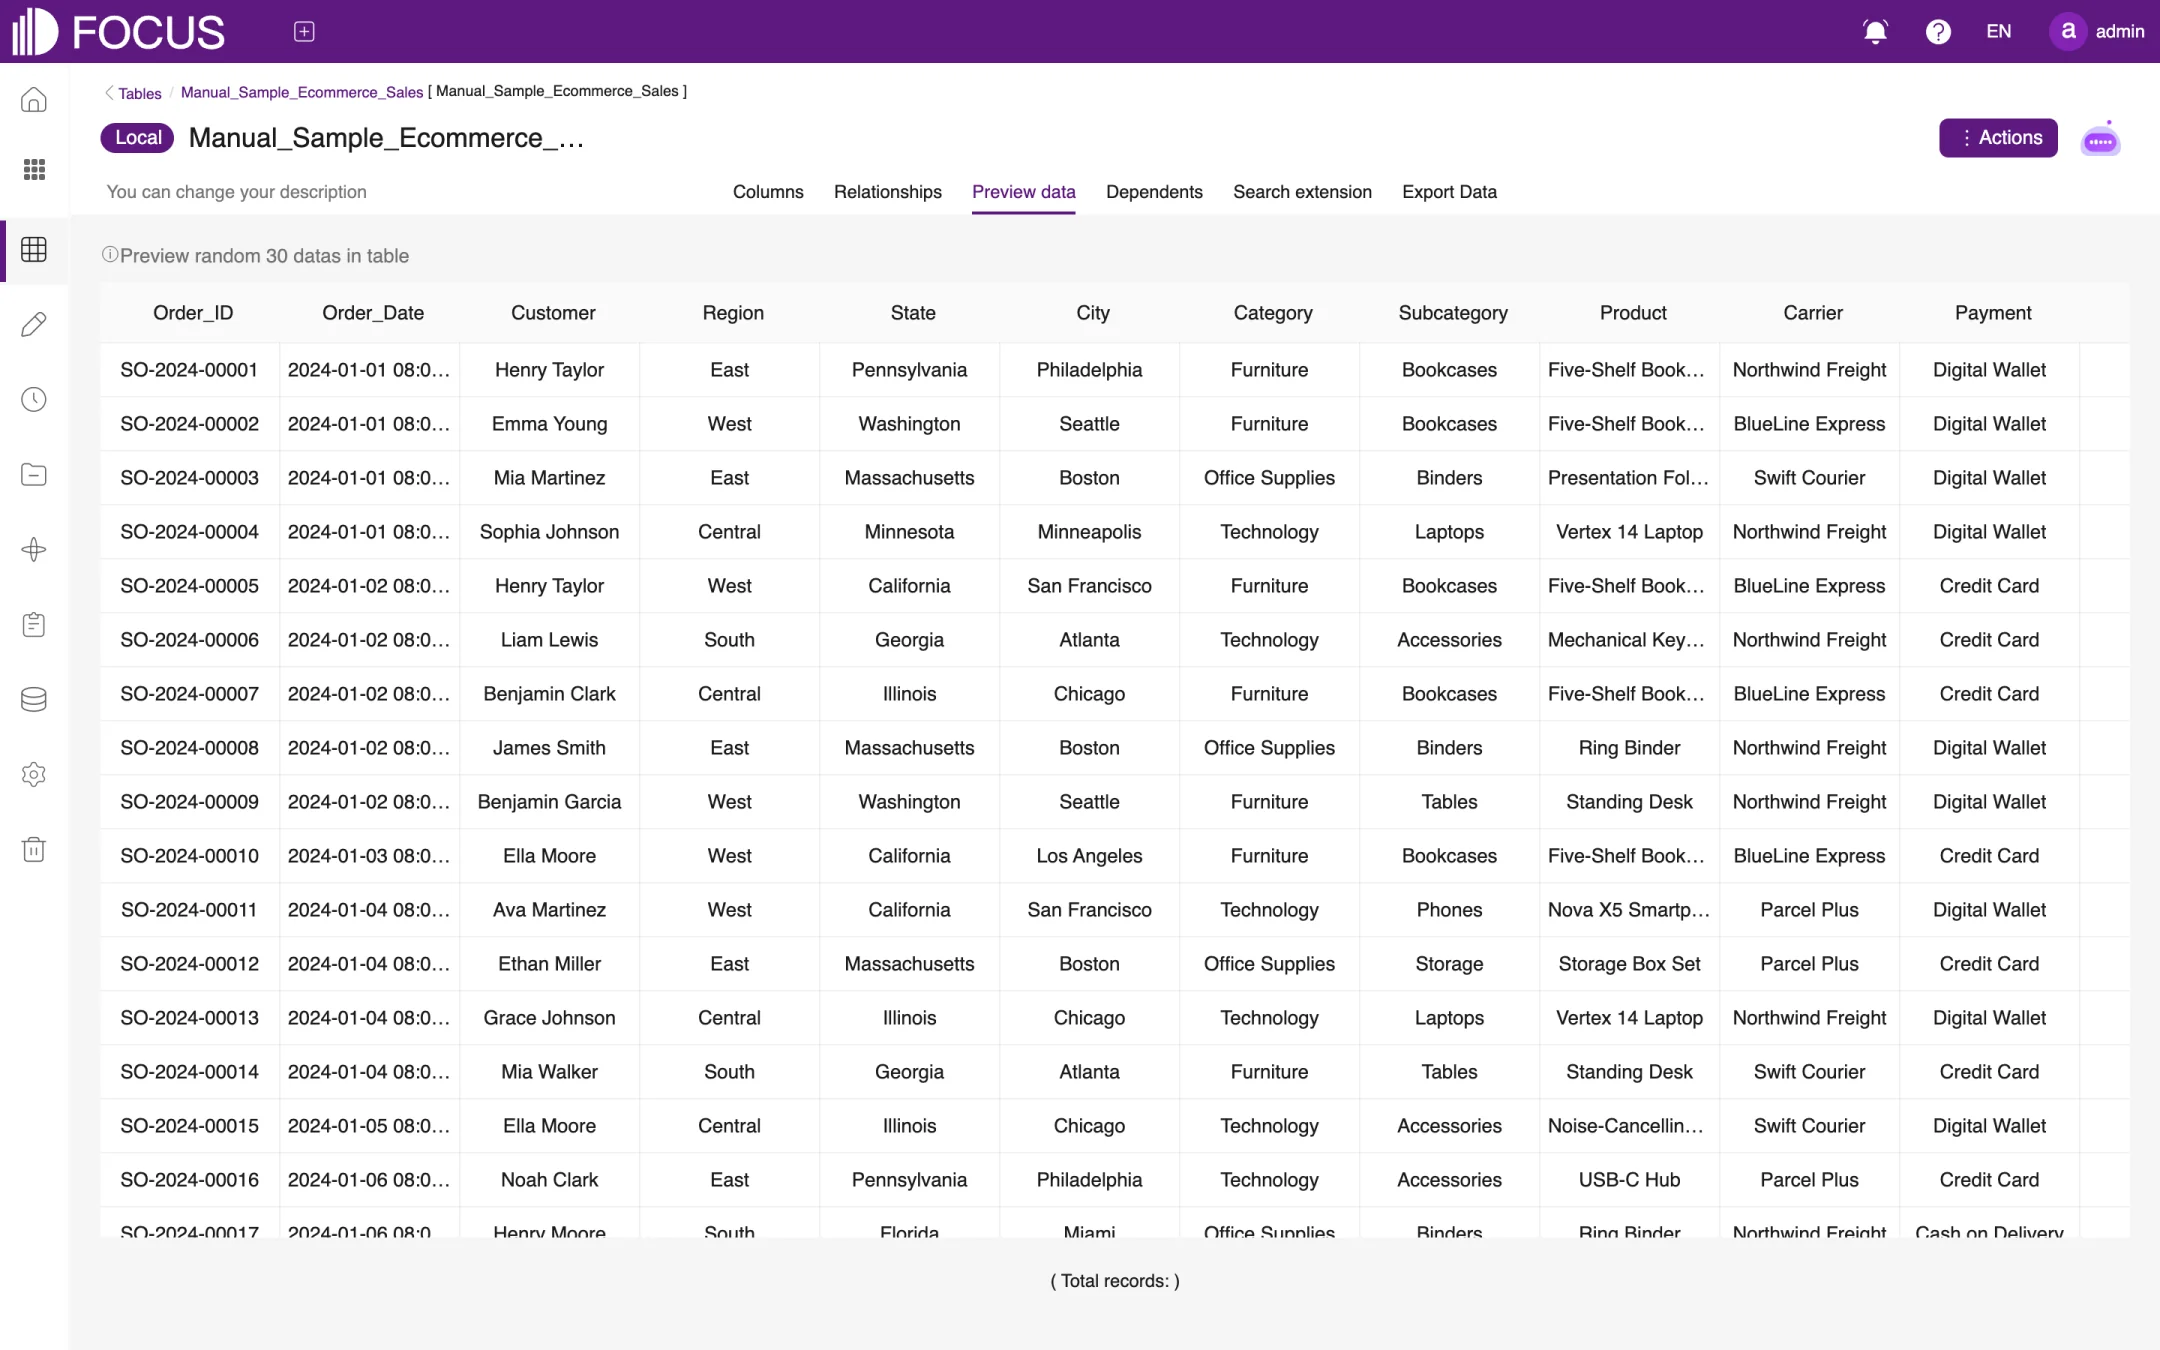
6.3.3Preview data
The Preview data tab shows 30 randomly selected rows of the table, as shown in Figure 6-11. The Total records line at the bottom is meant to show the total number of rows; in the figure it appears without a number.
Figure 6-11. Preview data
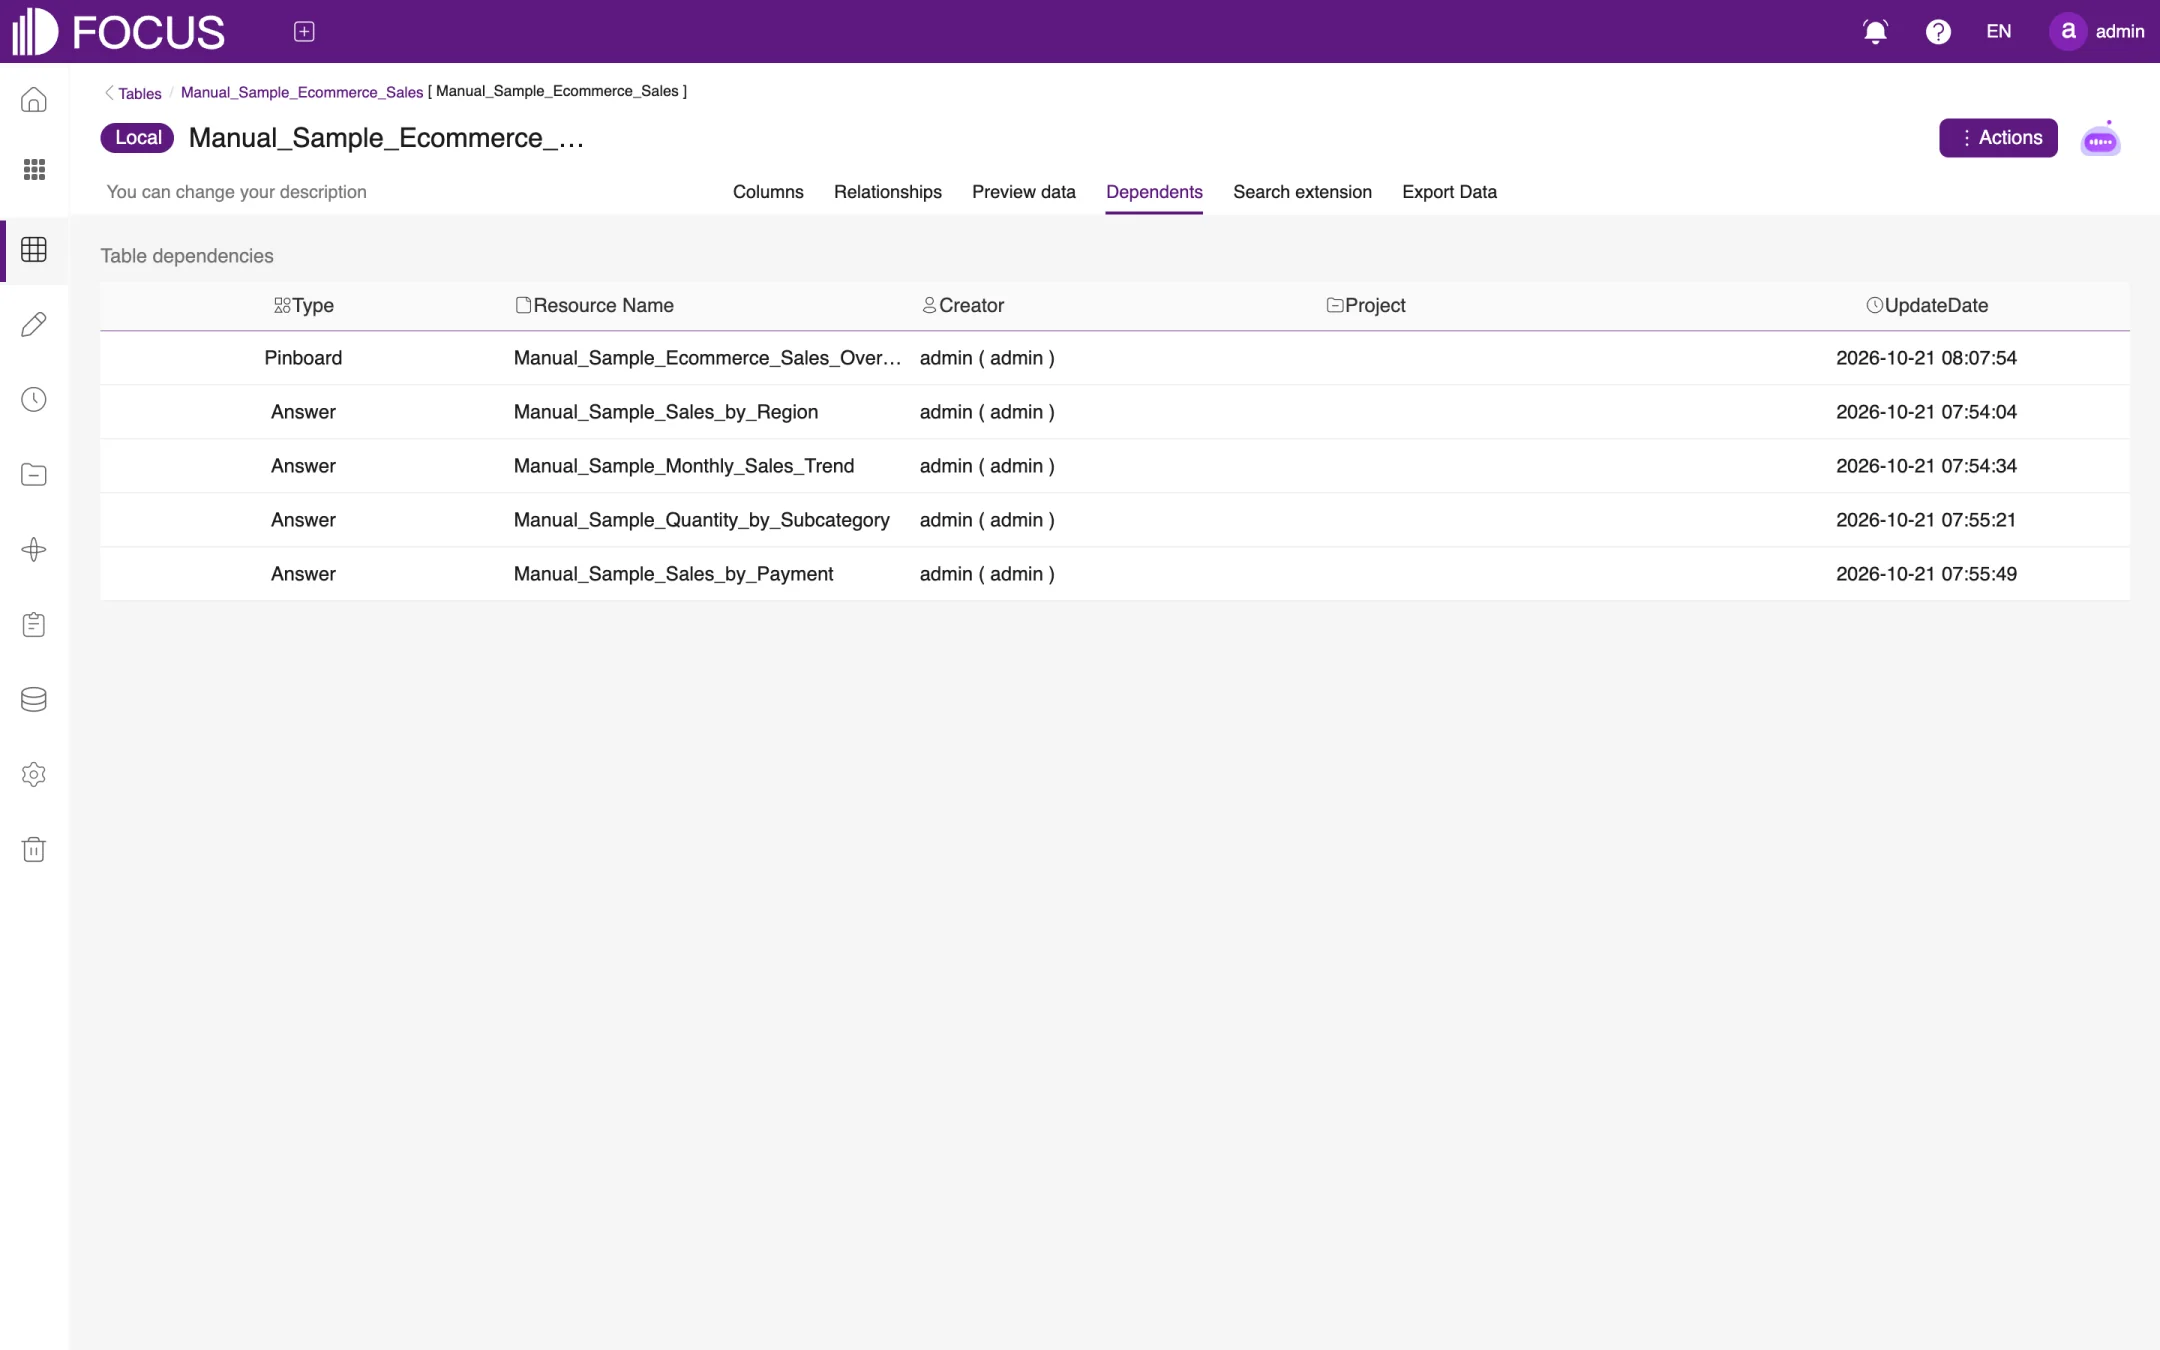
6.3.4Dependents
The Dependents tab lists the pinboards, answers and other resources that use this table, with their creator, project and update date, as shown in Figure 6-12. Before you change or delete a table, check here what it affects.
Figure 6-12. Dependents
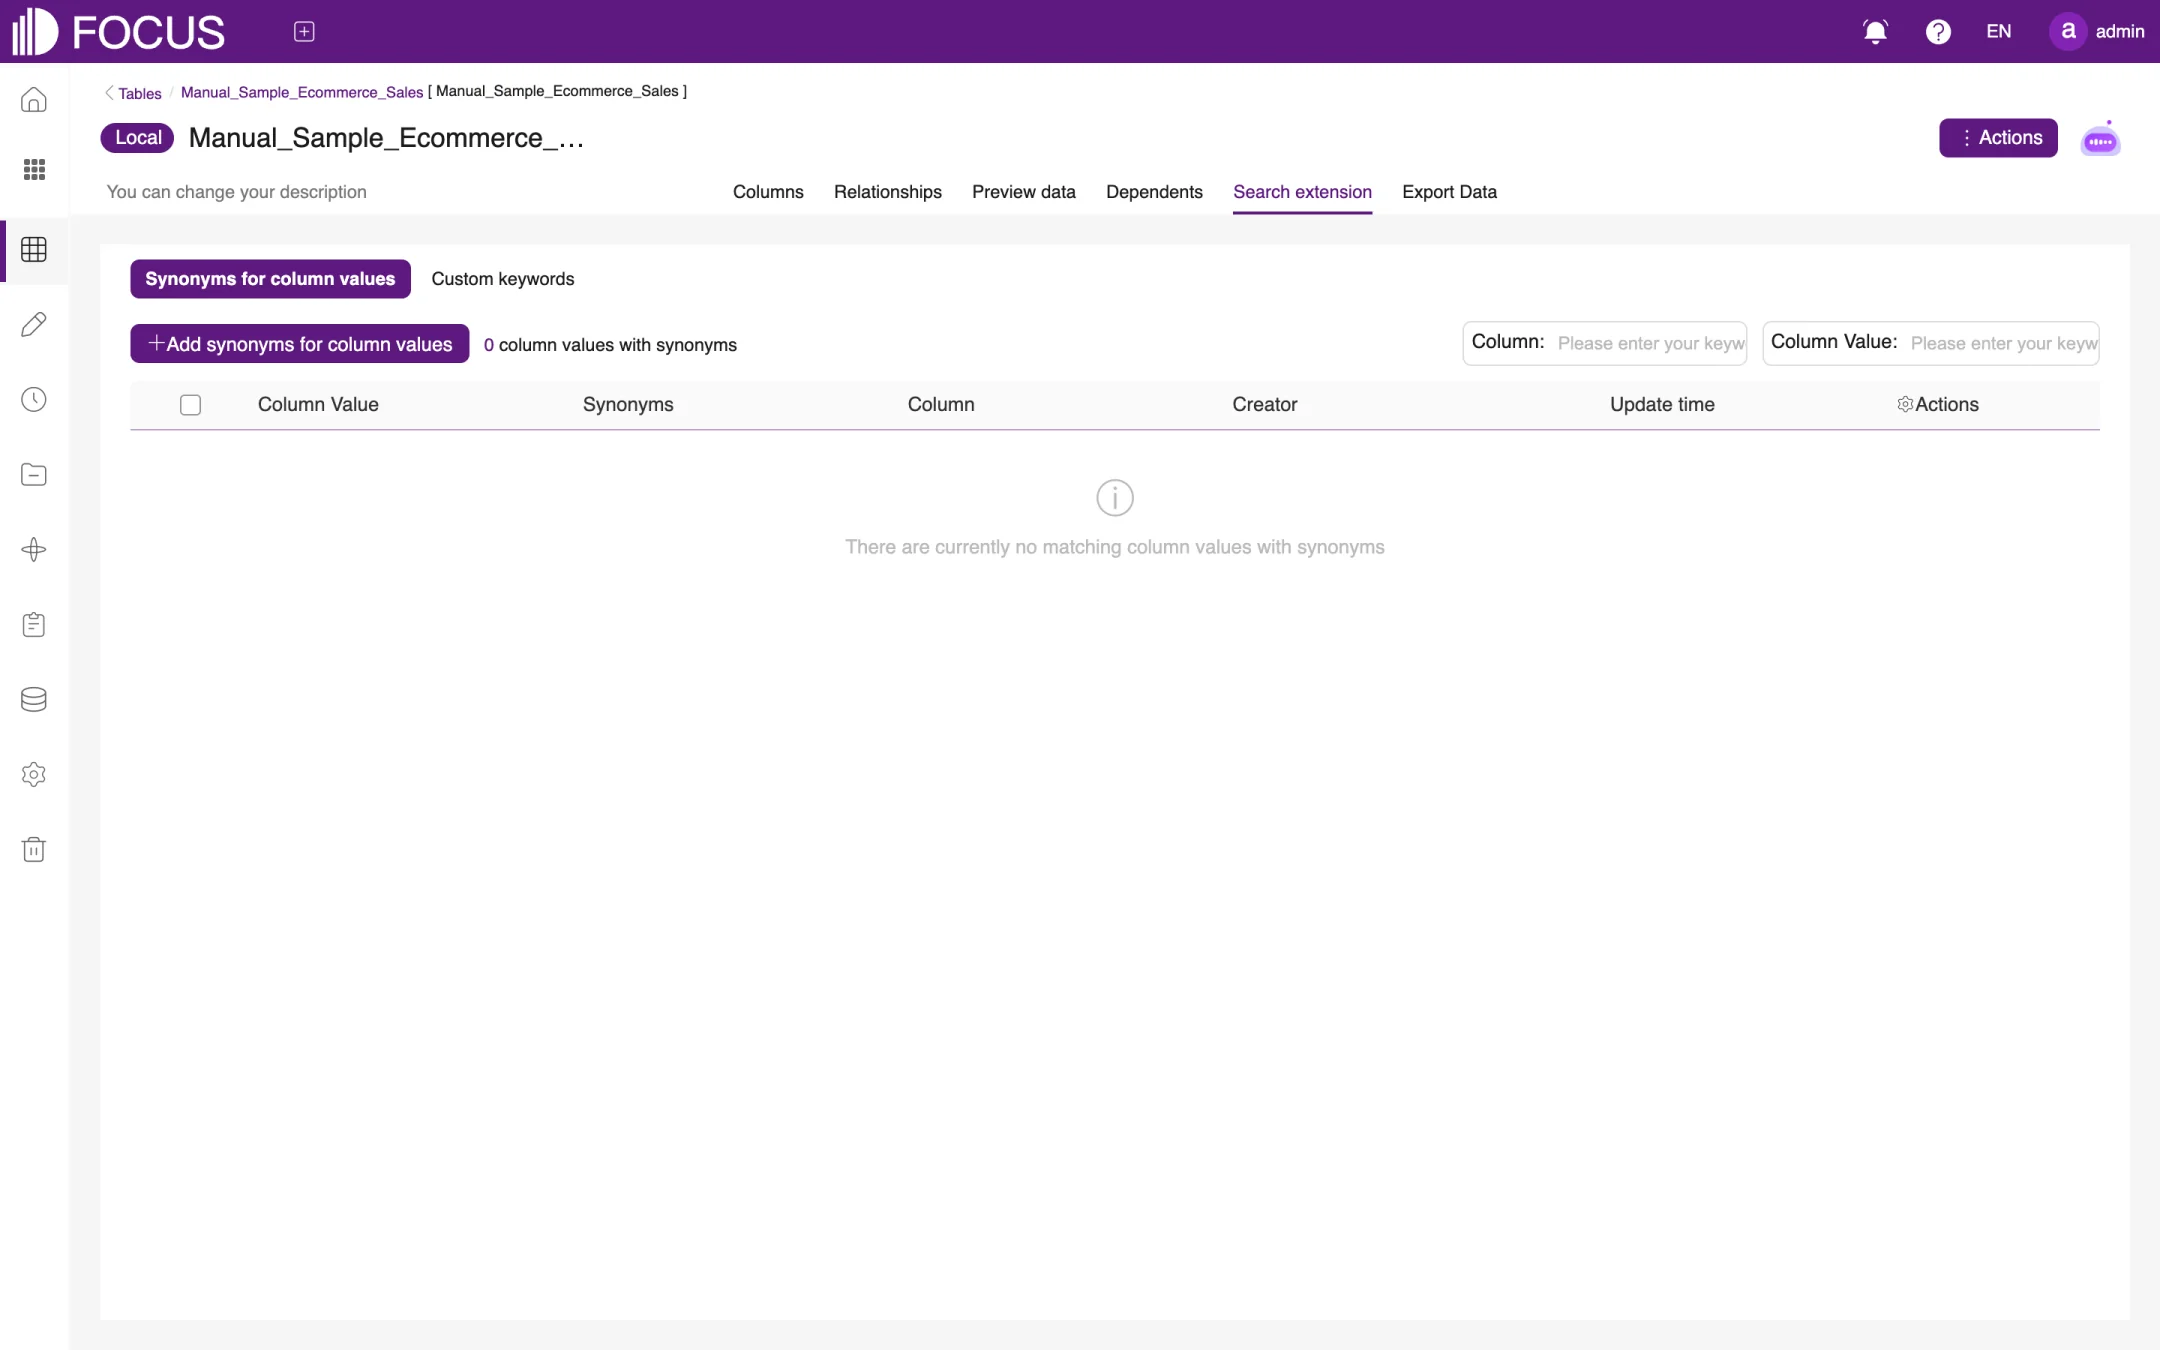
6.3.5Search extension
The Search extension tab teaches search your business terms, as shown in Figure 6-13:
Synonyms for column values: for example, give the Region value South the synonym Southern region; a search for Southern region then also matches South. Click Add synonyms for column values to add one.
Custom keywords: define search keywords for this table only.
Figure 6-13. Search extension
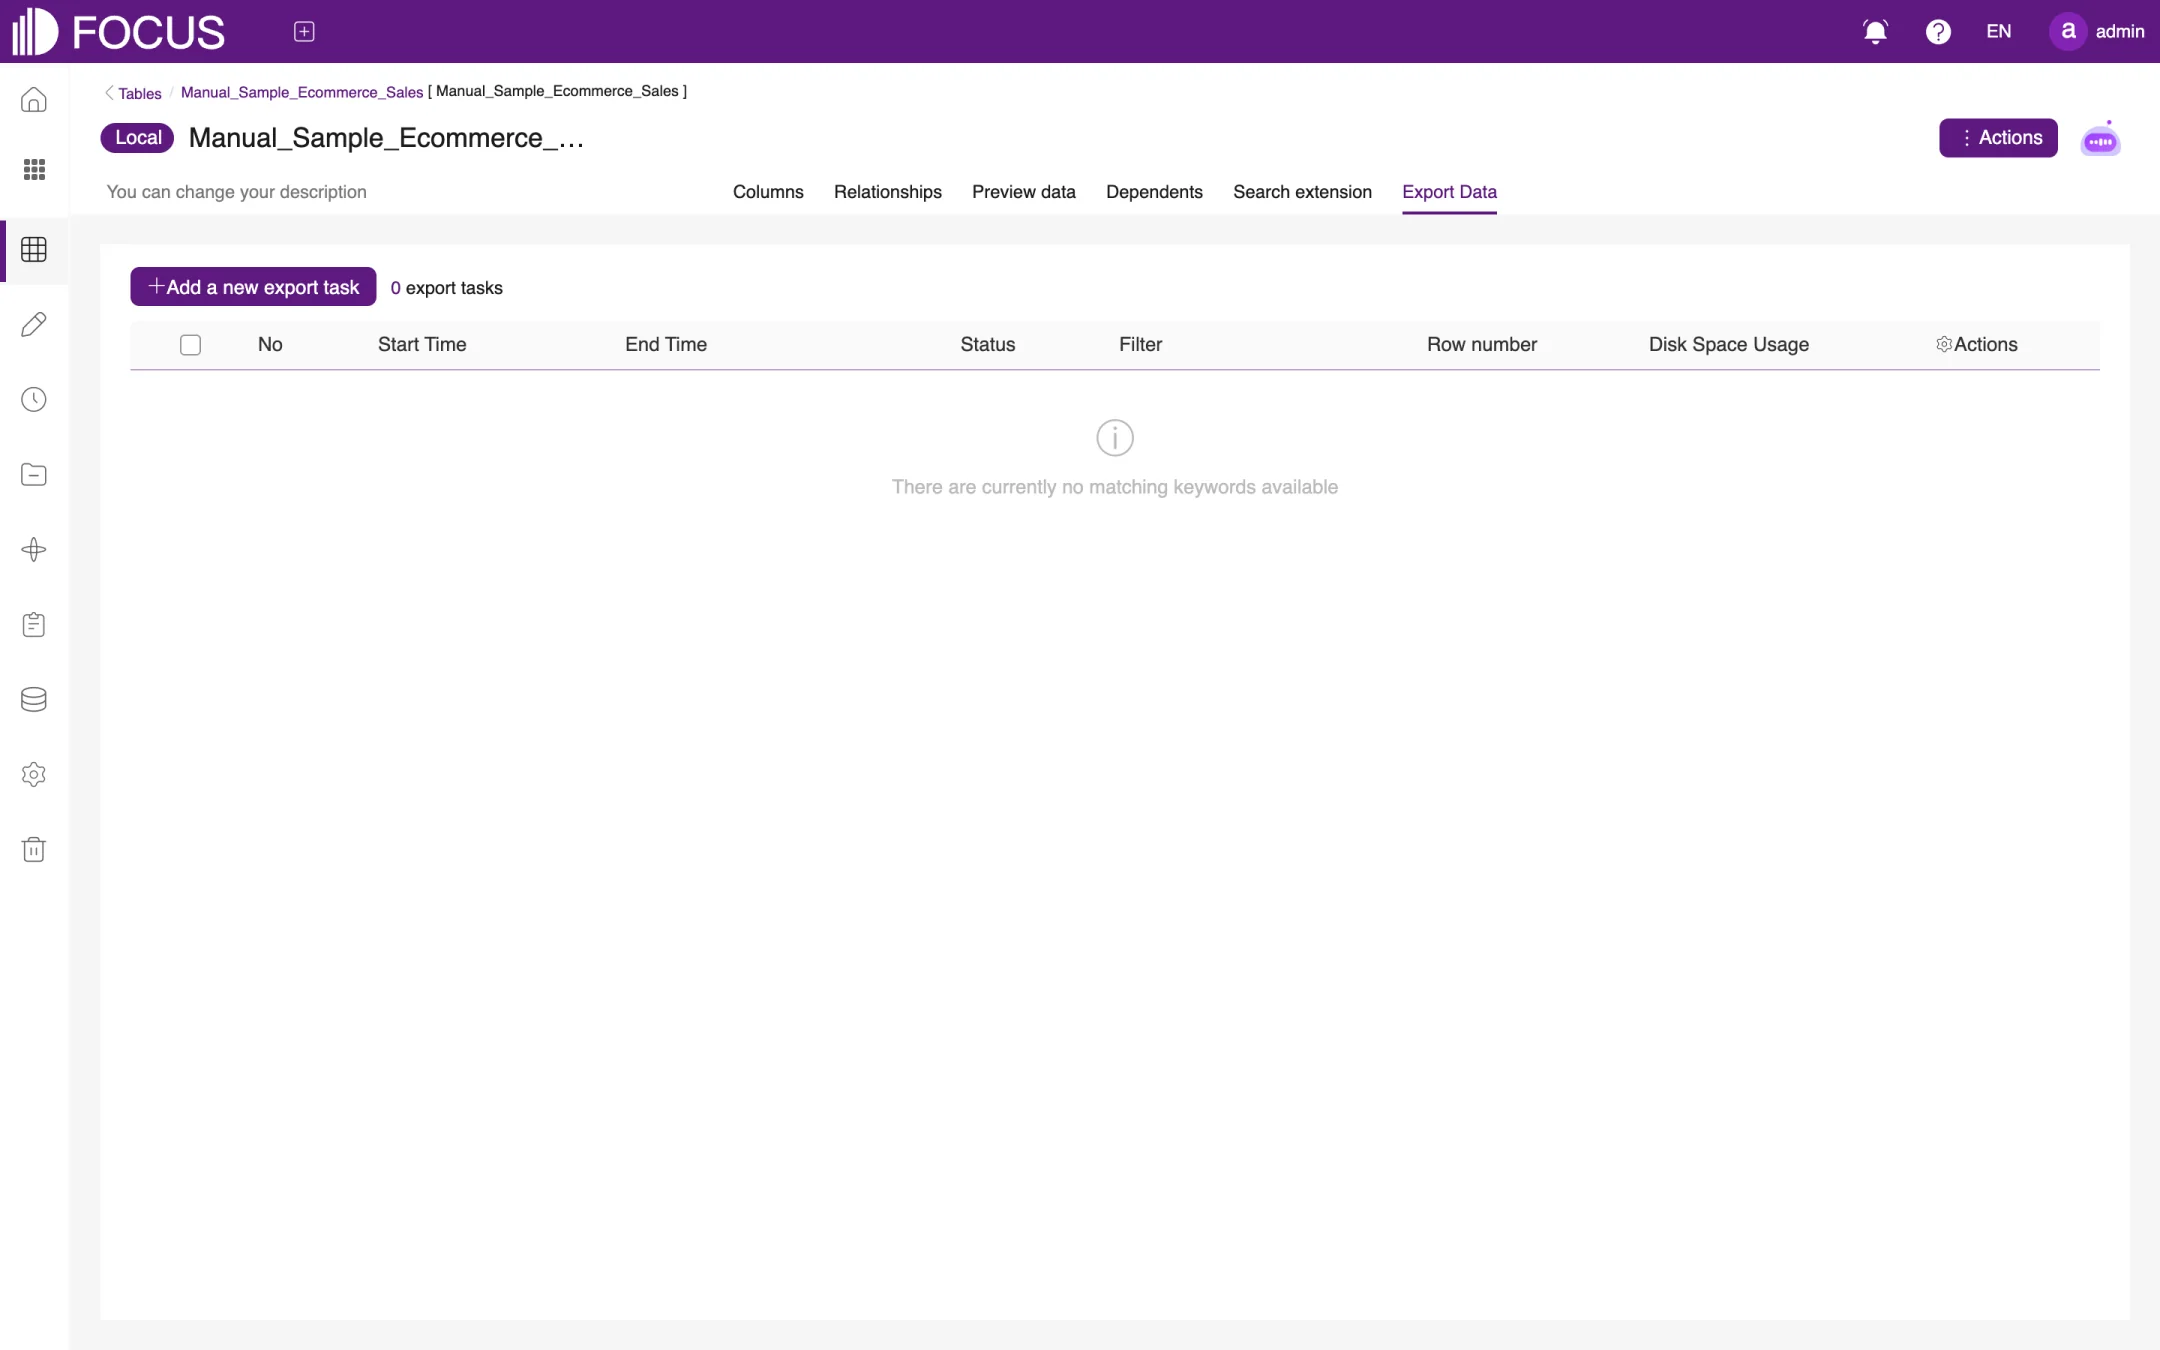
6.3.6Export Data
The Export Data tab exports the table's data to a file. Click Add a new export task, set the filter conditions and run the task. The list shows each task's start and end time, status, number of rows and disk space usage, as shown in Figure 6-14.
Figure 6-14. Export Data
6.4Worksheets, views and datasets
6.4.1Create a worksheet
A worksheet is a new table derived from existing tables. Click Create Worksheet and choose one of two types, as shown in Figure 6-15:
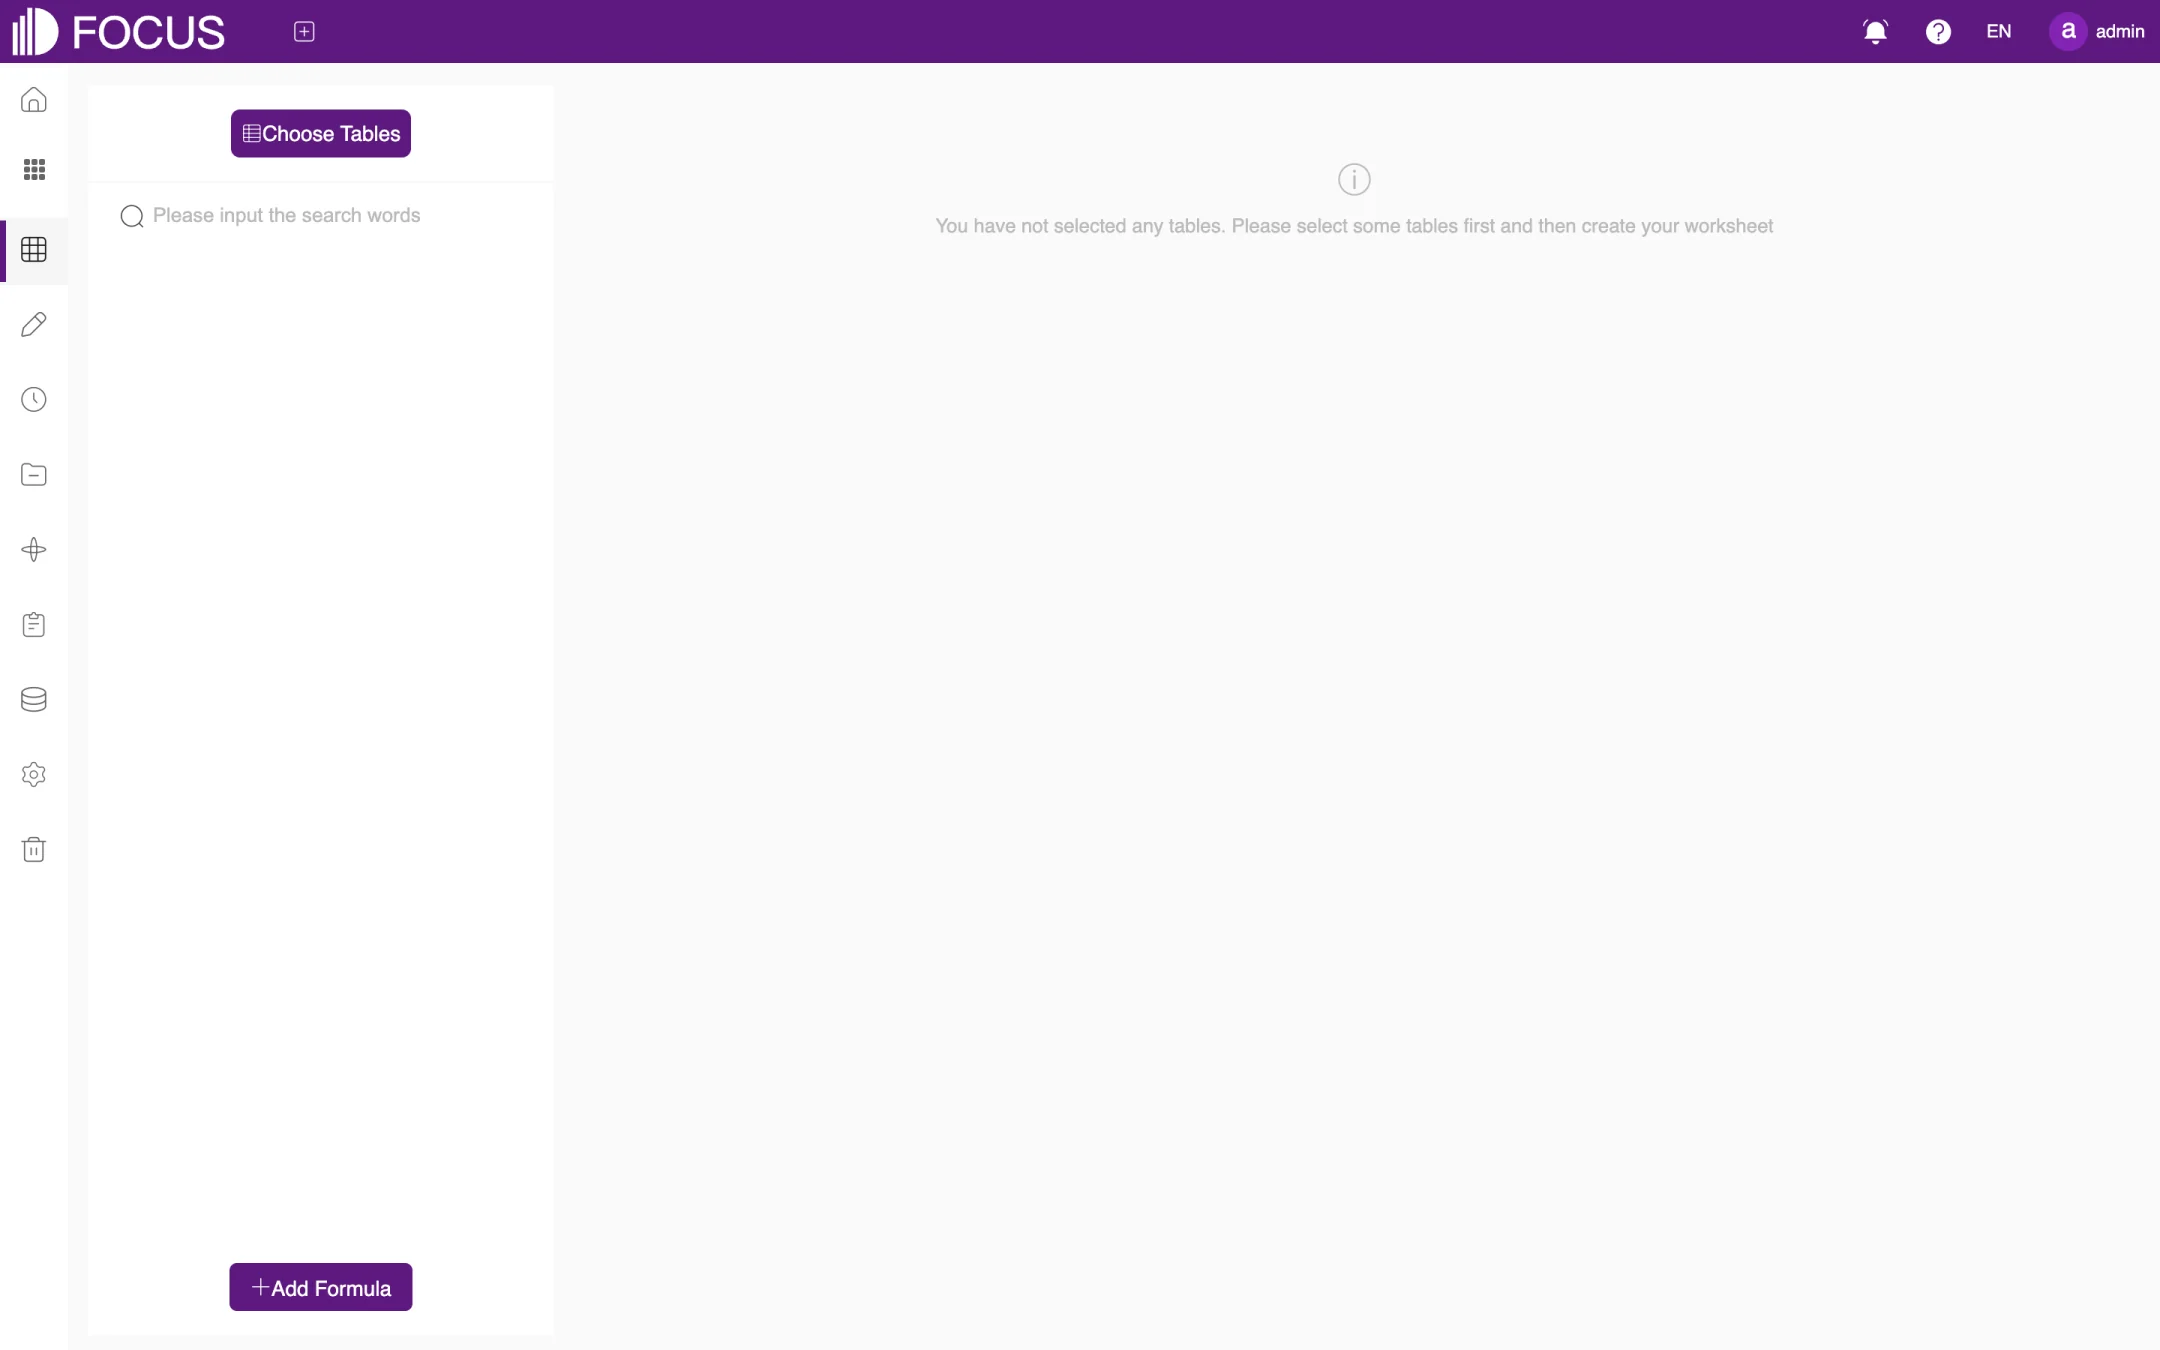
Join Worksheet: click Choose Tables to pick data, then select columns and add formulas (Add Formula) just as in a search to produce a new table, as shown in Figure 6-16;
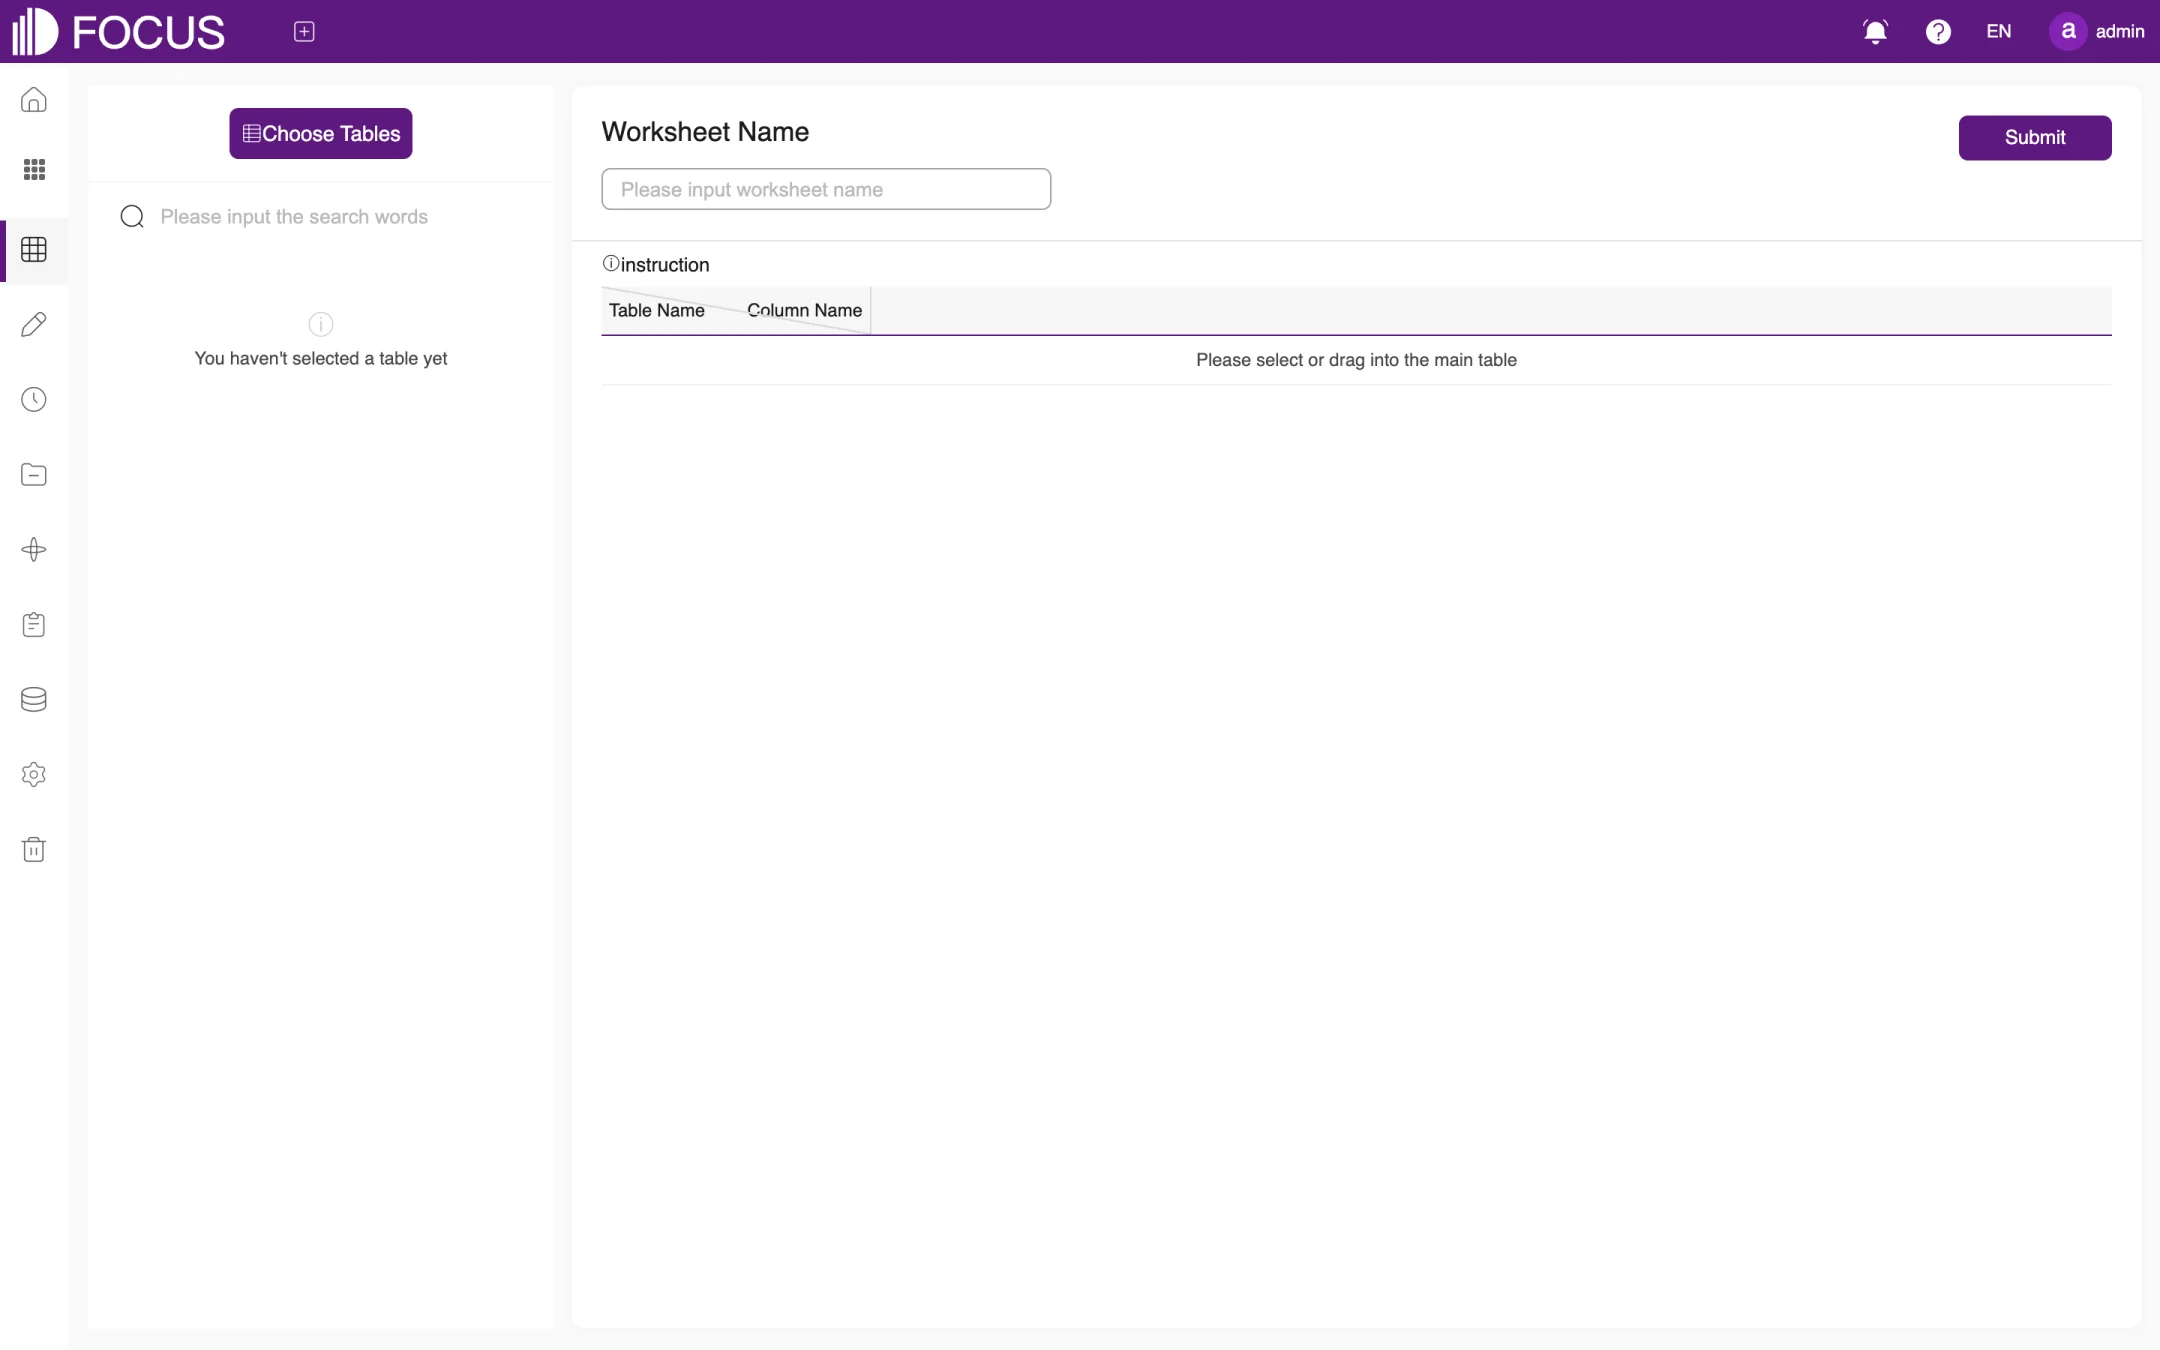
Merge Worksheet: stack several tables with the same structure into one table. Choose or drag in the main table, enter the Worksheet Name and click Submit, as shown in Figure 6-17.
You can also create a worksheet straight from a search result with More (…) > Save as Worksheet; see Chapter 2.
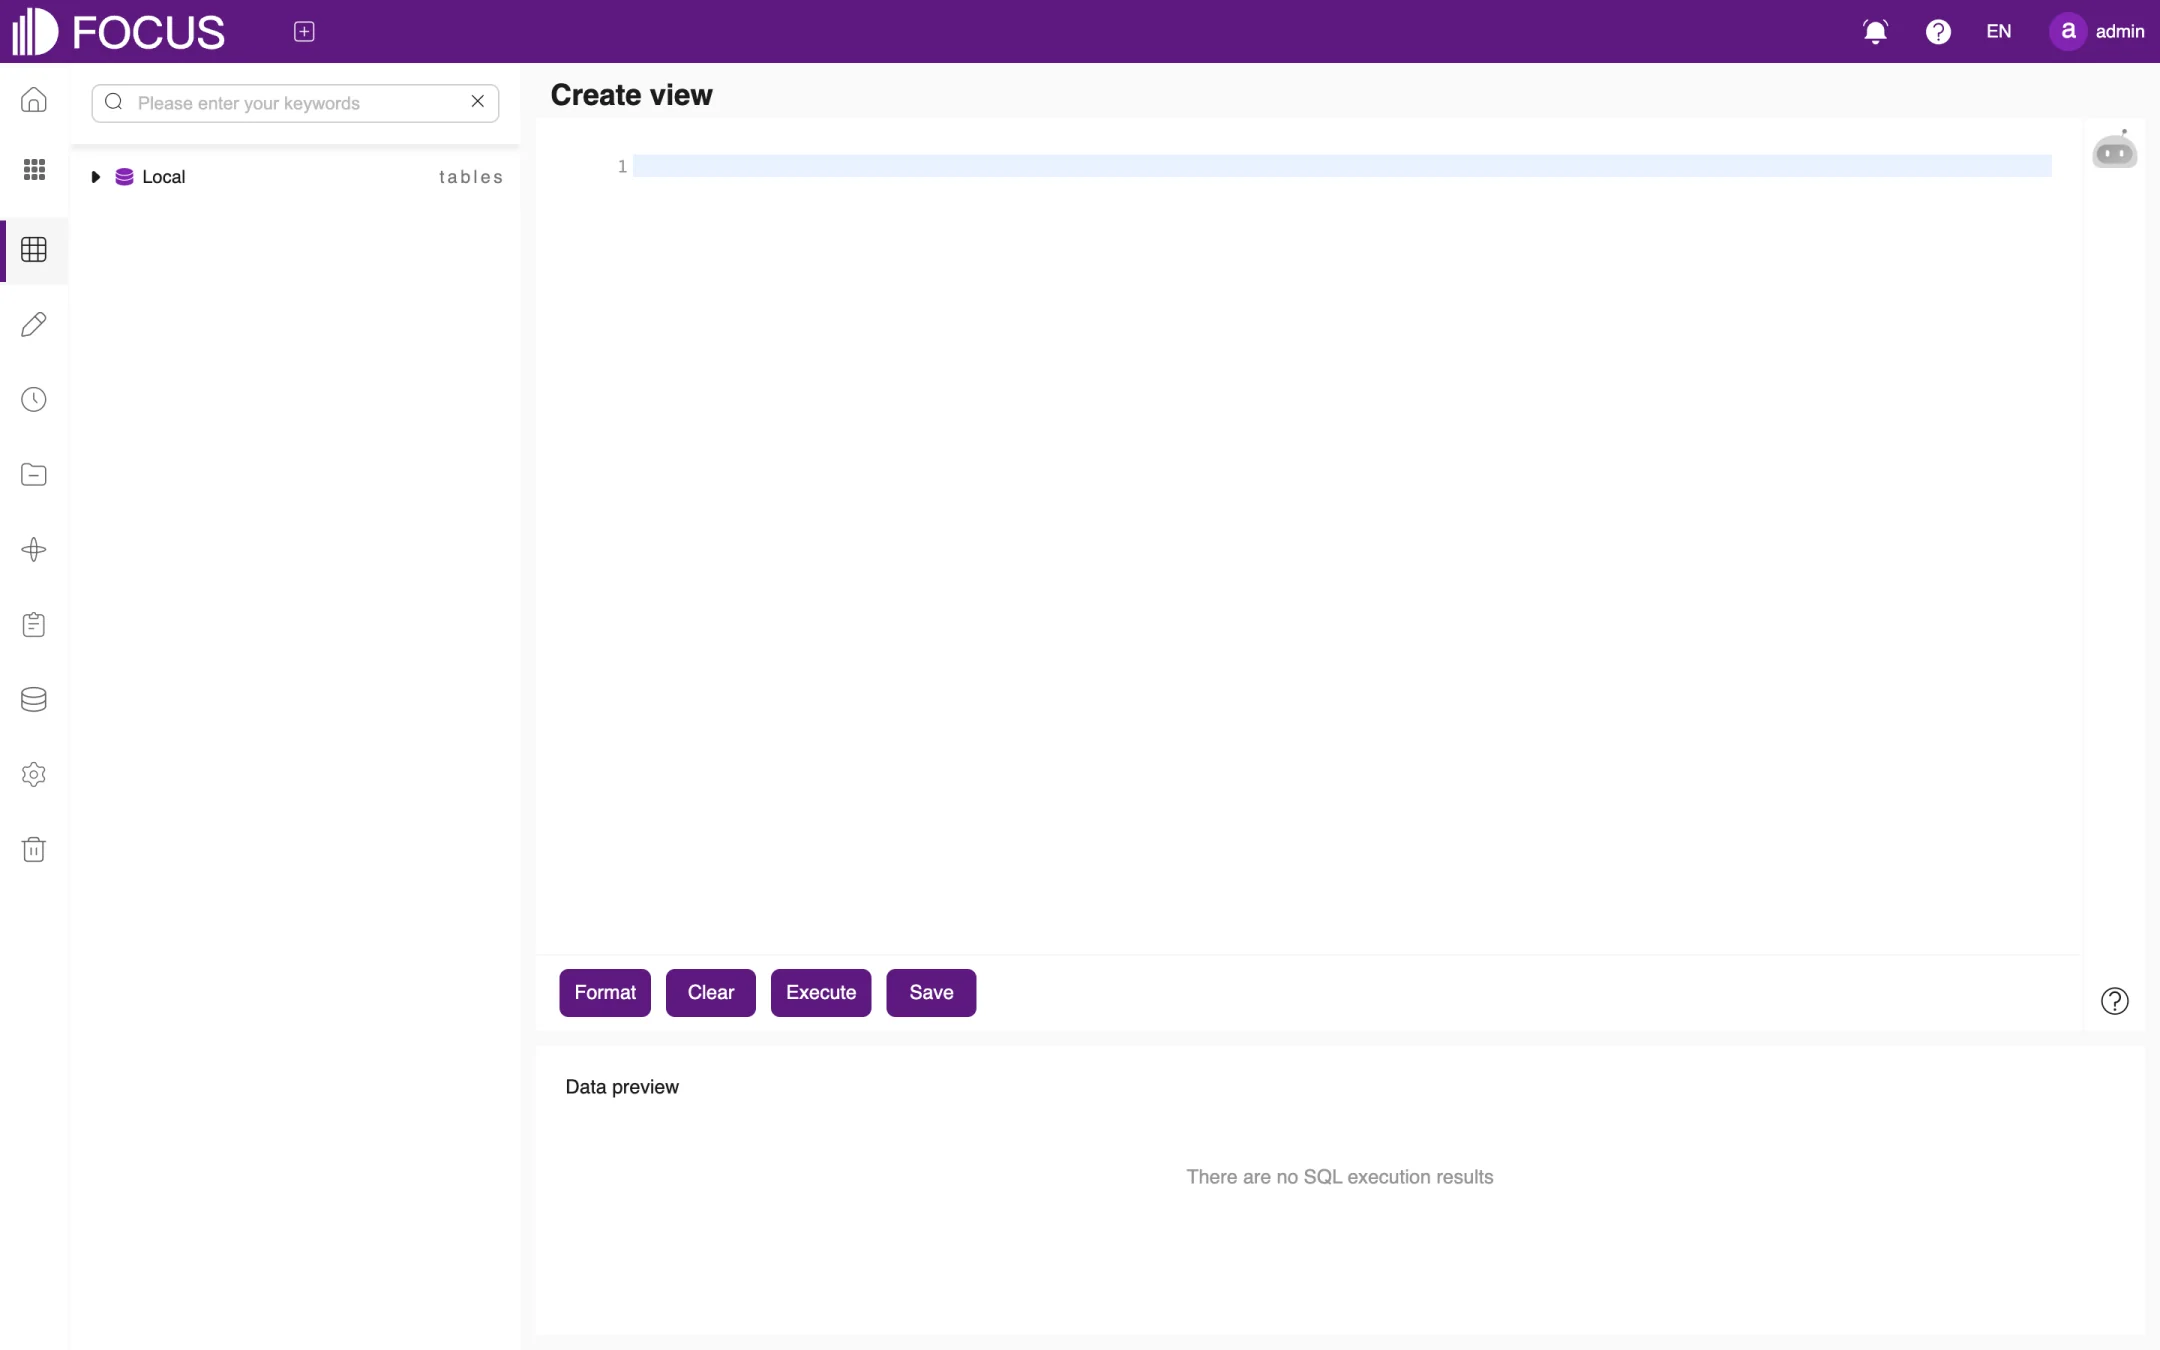
6.4.2Create a view
Click Create view to open the SQL view editor, as shown in Figure 6-18. The available tables are listed on the left; type the SQL statement in the editor on the right:
Format: tidy up the SQL layout;
Clear: empty the editor;
Execute: run the SQL; the result appears under Data preview;
Save: save the SQL as a view, which you can then use like a table.
Figure 6-18. Create view
6.4.3Datasets
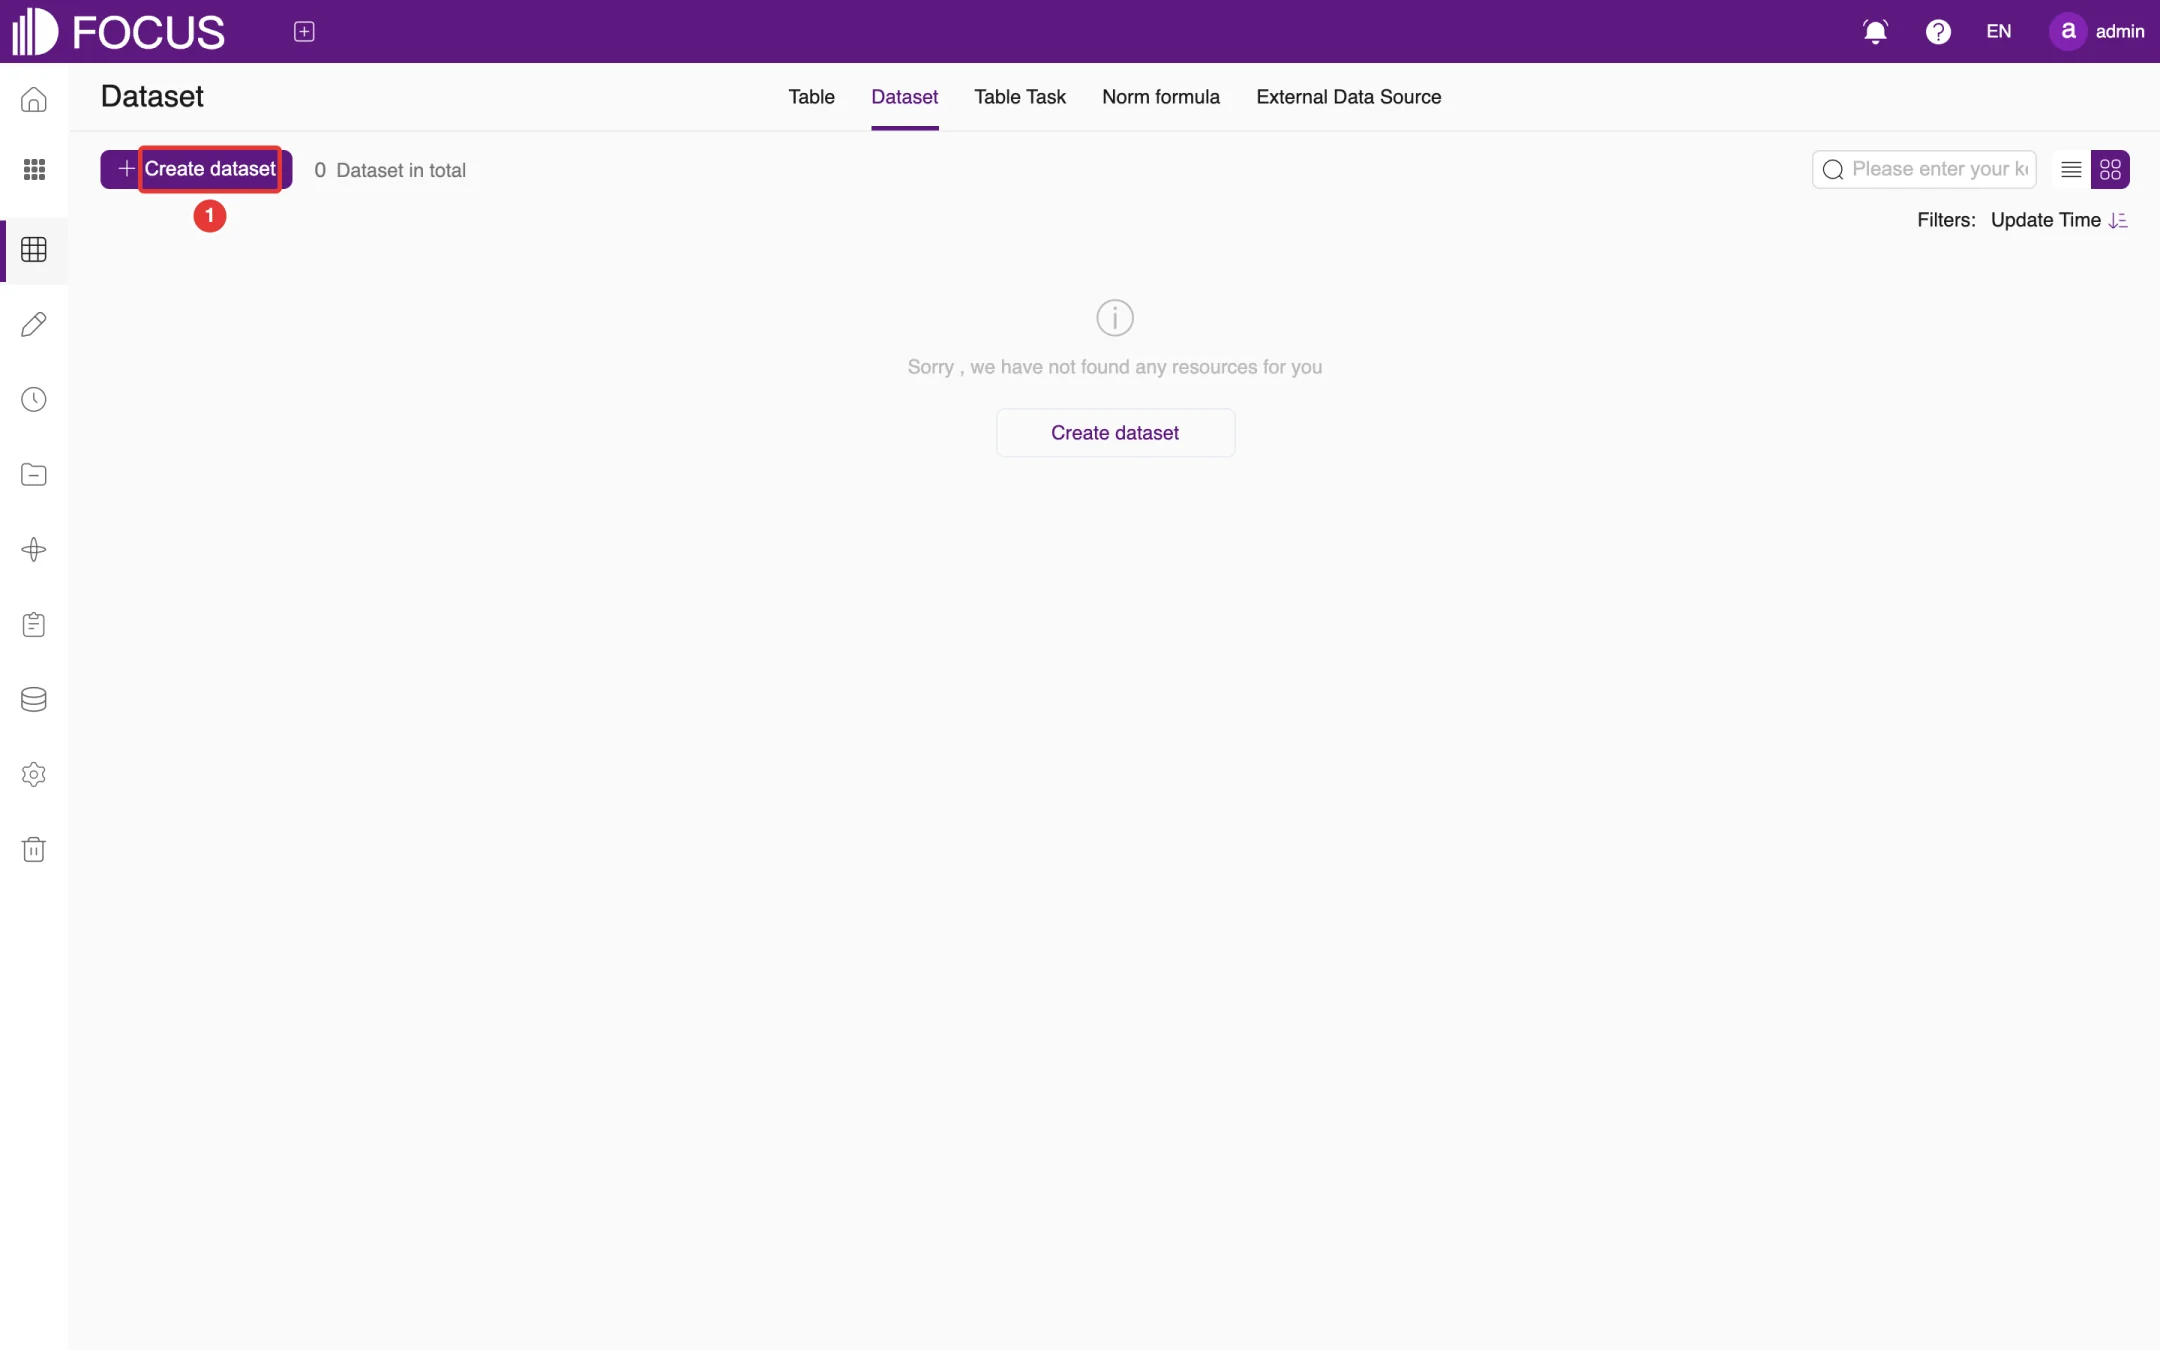
A dataset combines several related tables into one unit so that they can be selected together in a search. On the Dataset tab, click Create dataset (①) to create one, as shown in Figure 6-19. In search, use it through Choose Tables > Select Dataset.
Figure 6-19. Datasets
6.5Table tasks and norm formulas
6.5.1Table tasks
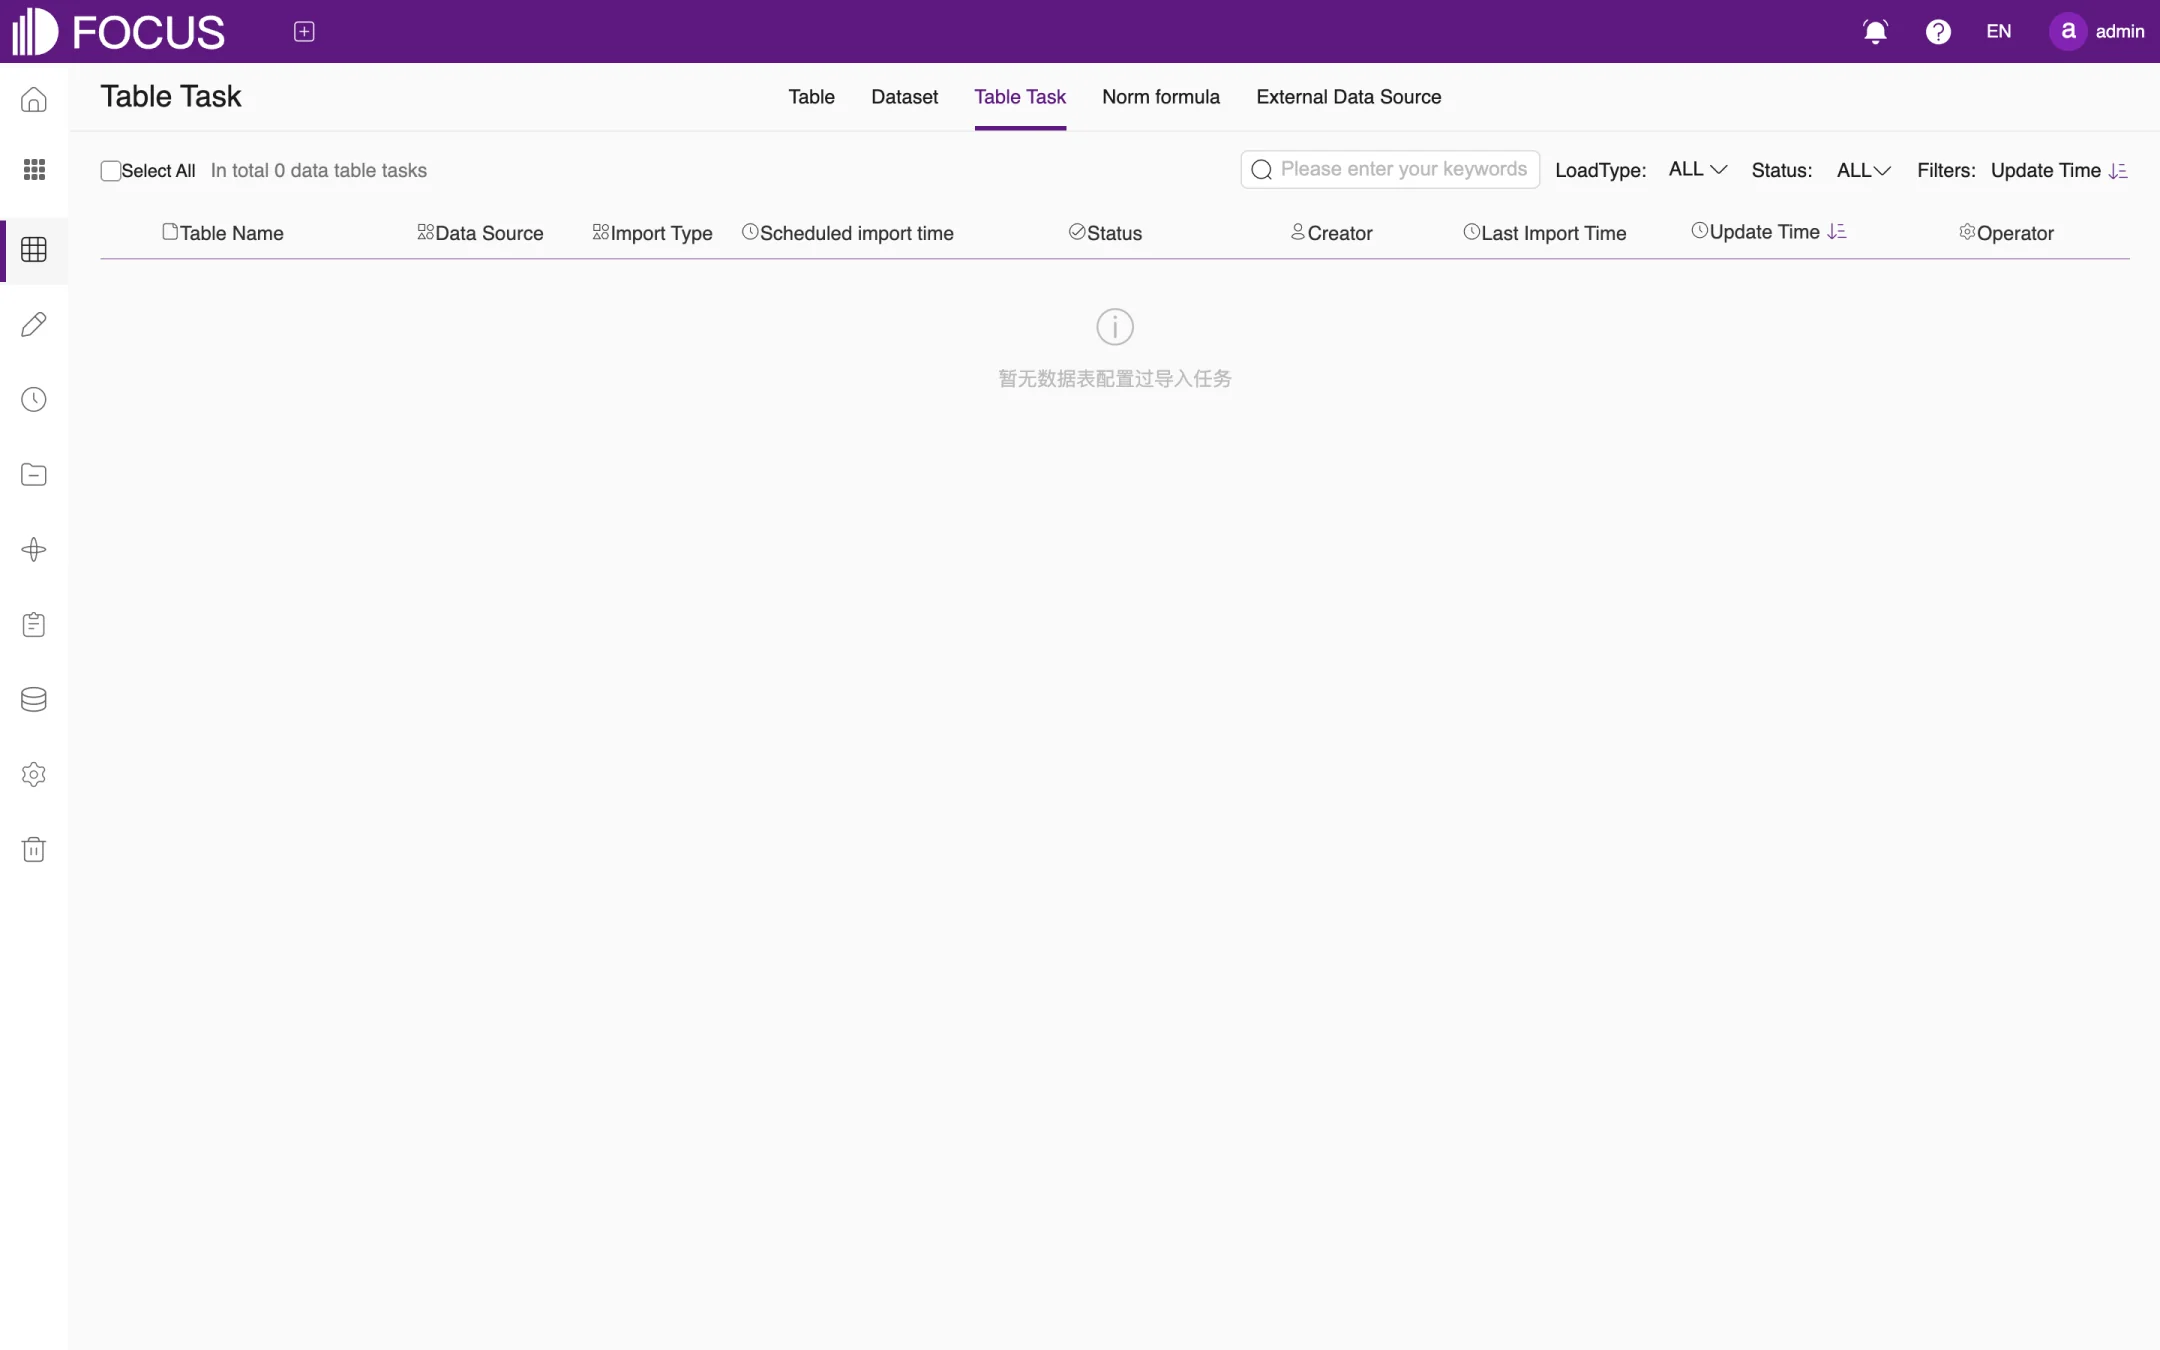
The Table Task tab manages the scheduled import tasks of tables imported from data sources in one place. It shows each task's Data Source, Import Type, Scheduled import time, Status and Last Import Time, as shown in Figure 6-20. When there are no tasks, the list shows the message 暂无数据表配置过导入任务 ("No table has an import task yet"), which is not yet translated.
Figure 6-20. Table tasks
6.5.2Norm formulas
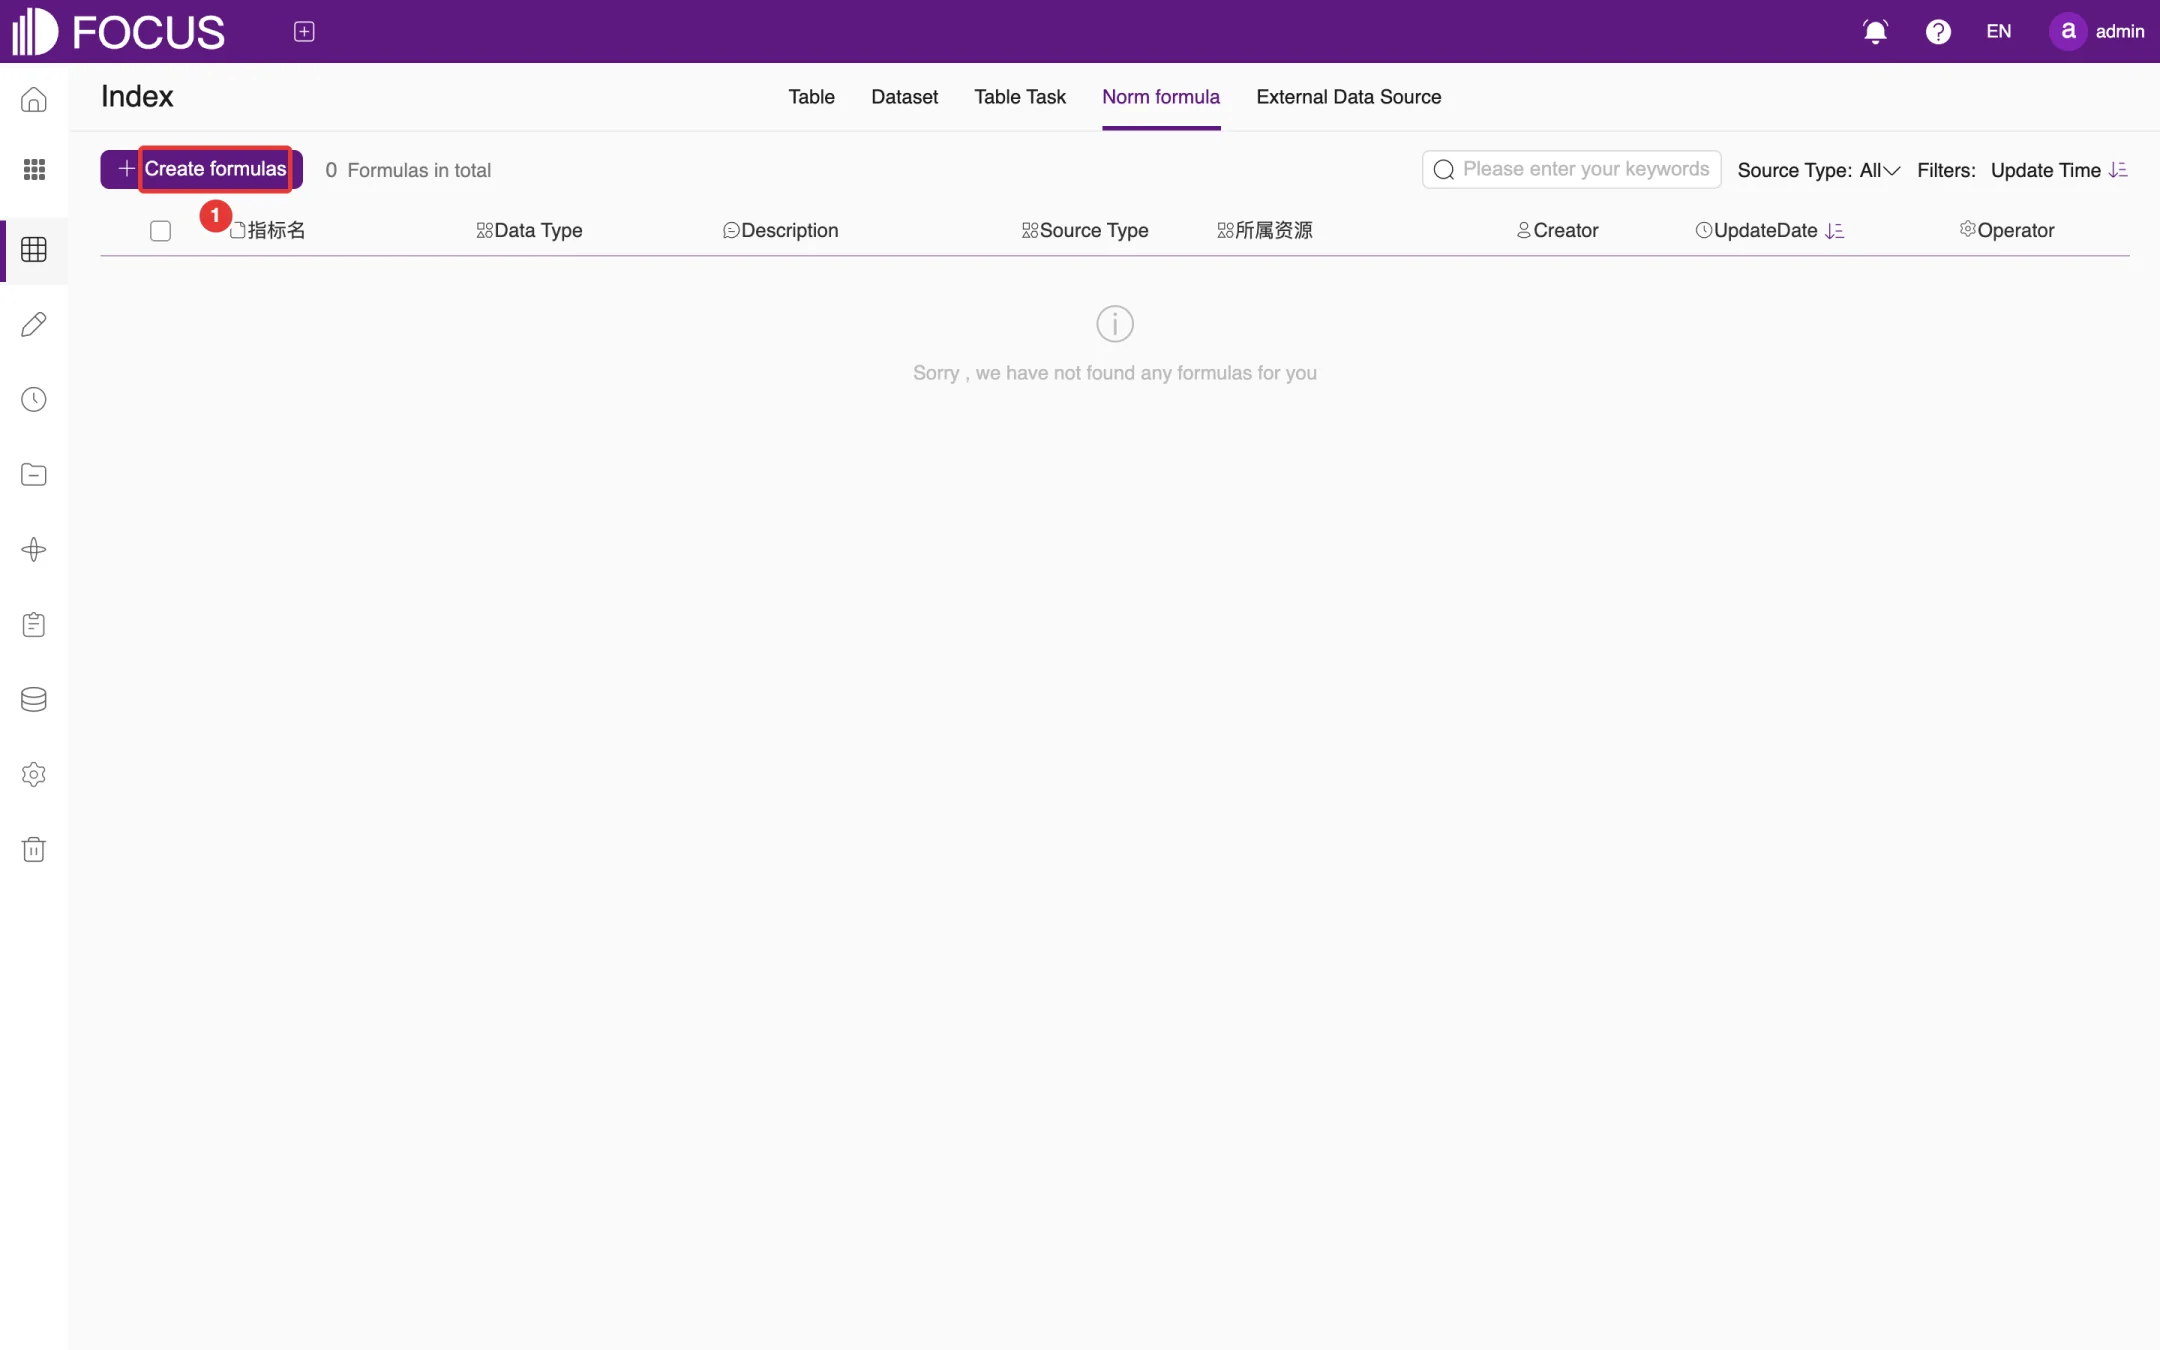
The Norm formula tab (page title Index) manages, in one place, the formulas created in searches or tables. Click Create formulas (①) to create one. The list shows the formula name, Data Type, Source Type and the resource the formula belongs to, as shown in Figure 6-21. Two column headers are not yet translated: 指标名 ("formula name") and 所属资源 ("resource").
Figure 6-21. Norm formulas
6.6External data sources
6.6.1Manage data sources
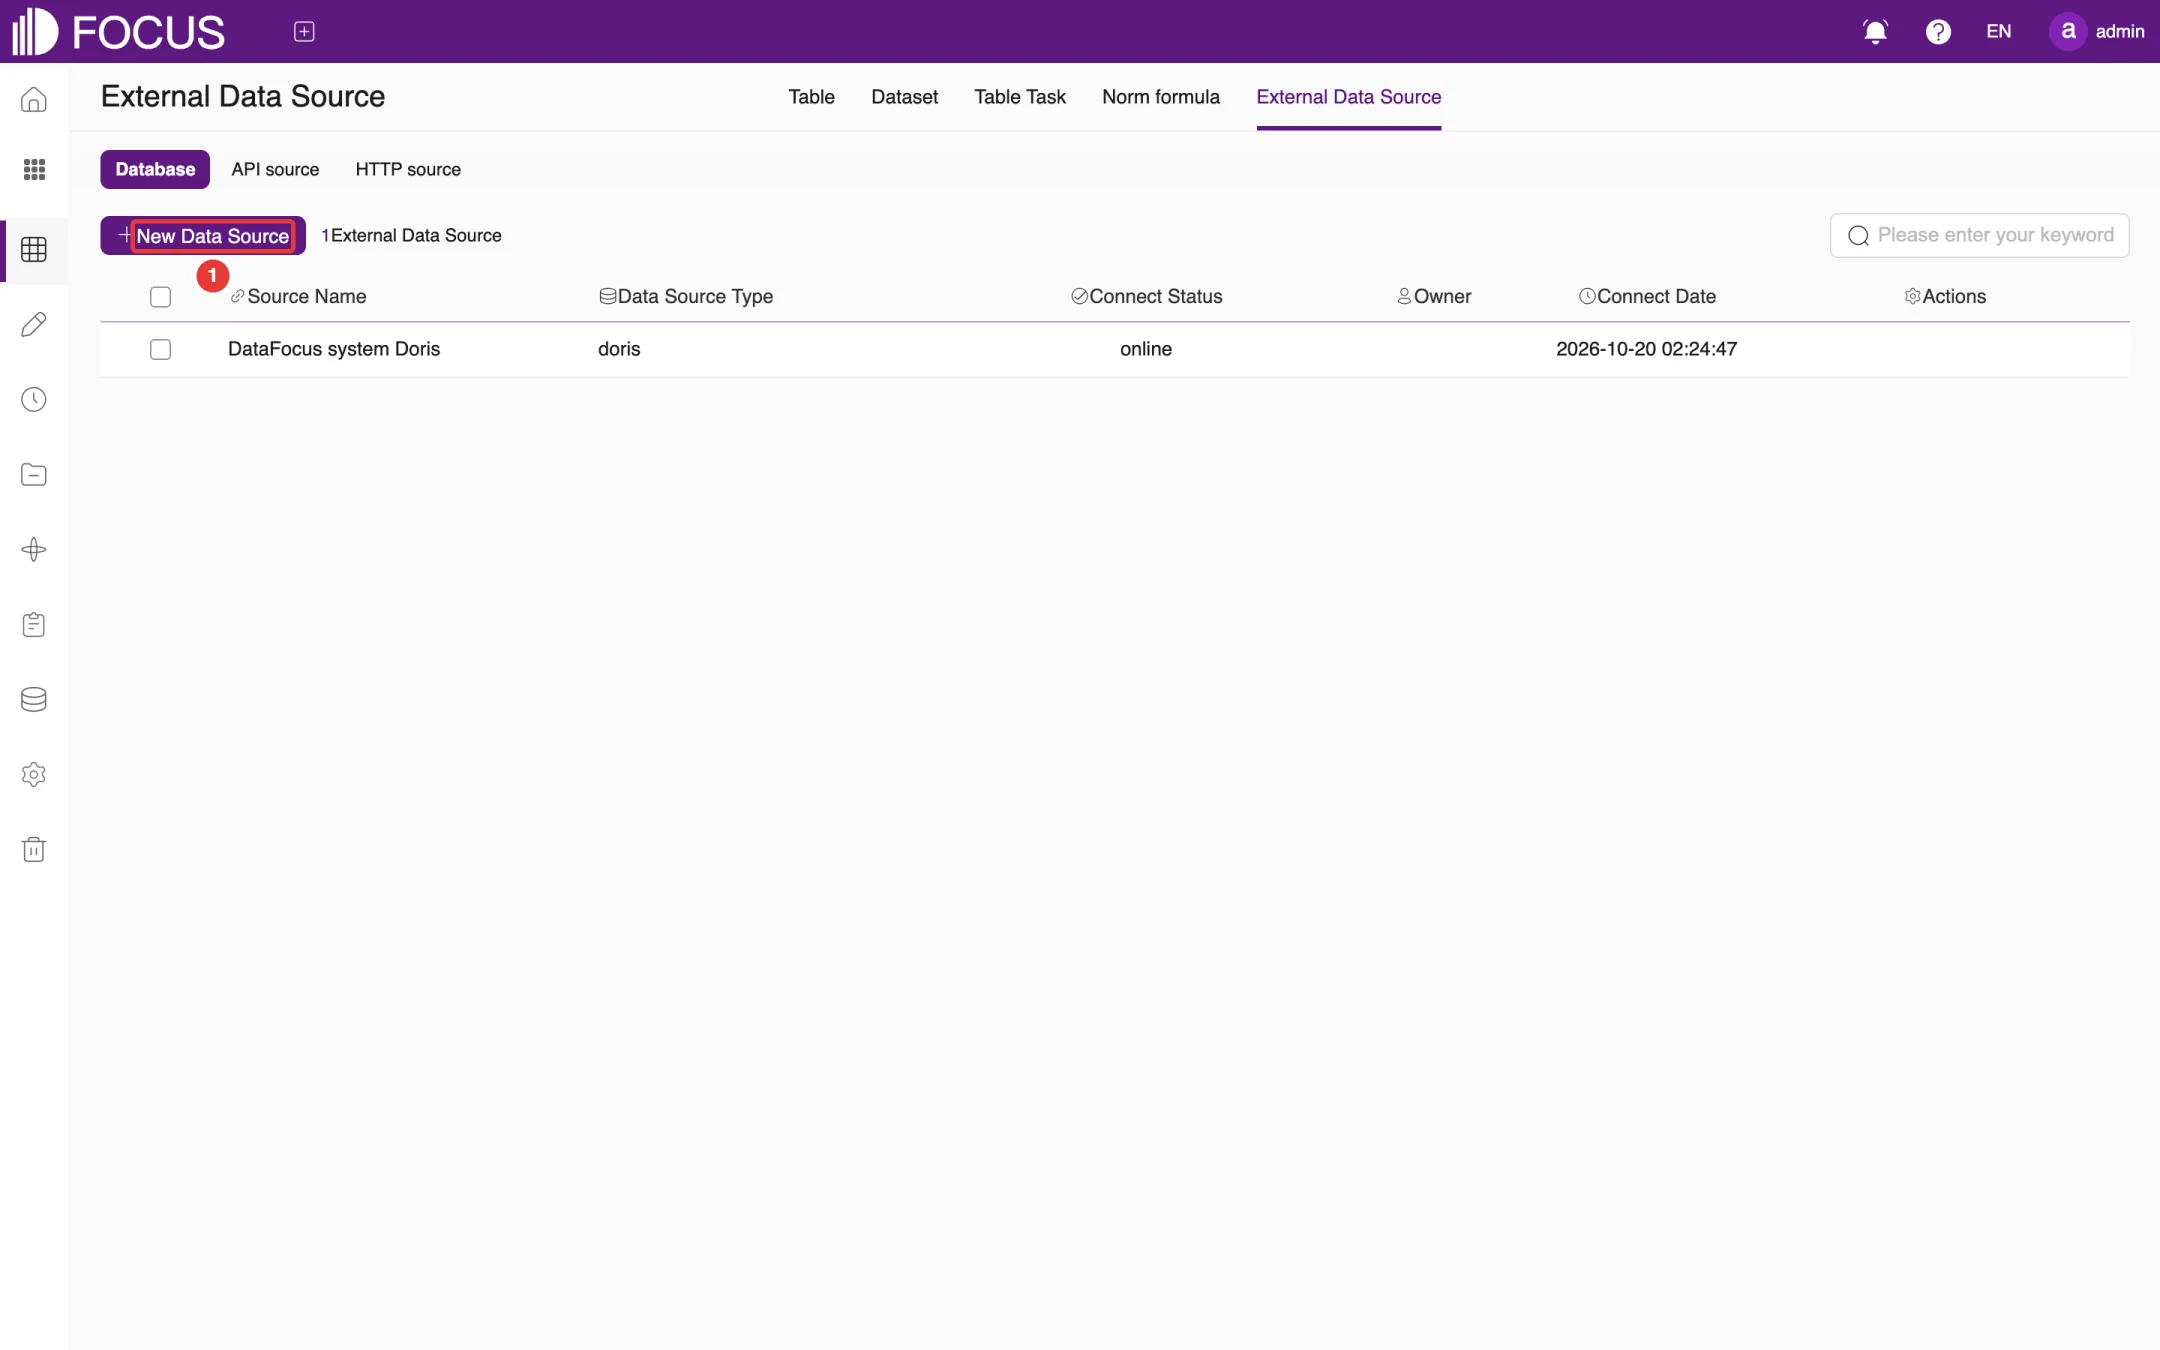
The External Data Source tab connects your existing databases. Sources are grouped as Database, API source and HTTP source, as shown in Figure 6-22. "DataFocus system Doris" in the list is the system's built-in data source.
Figure 6-22. External data sources
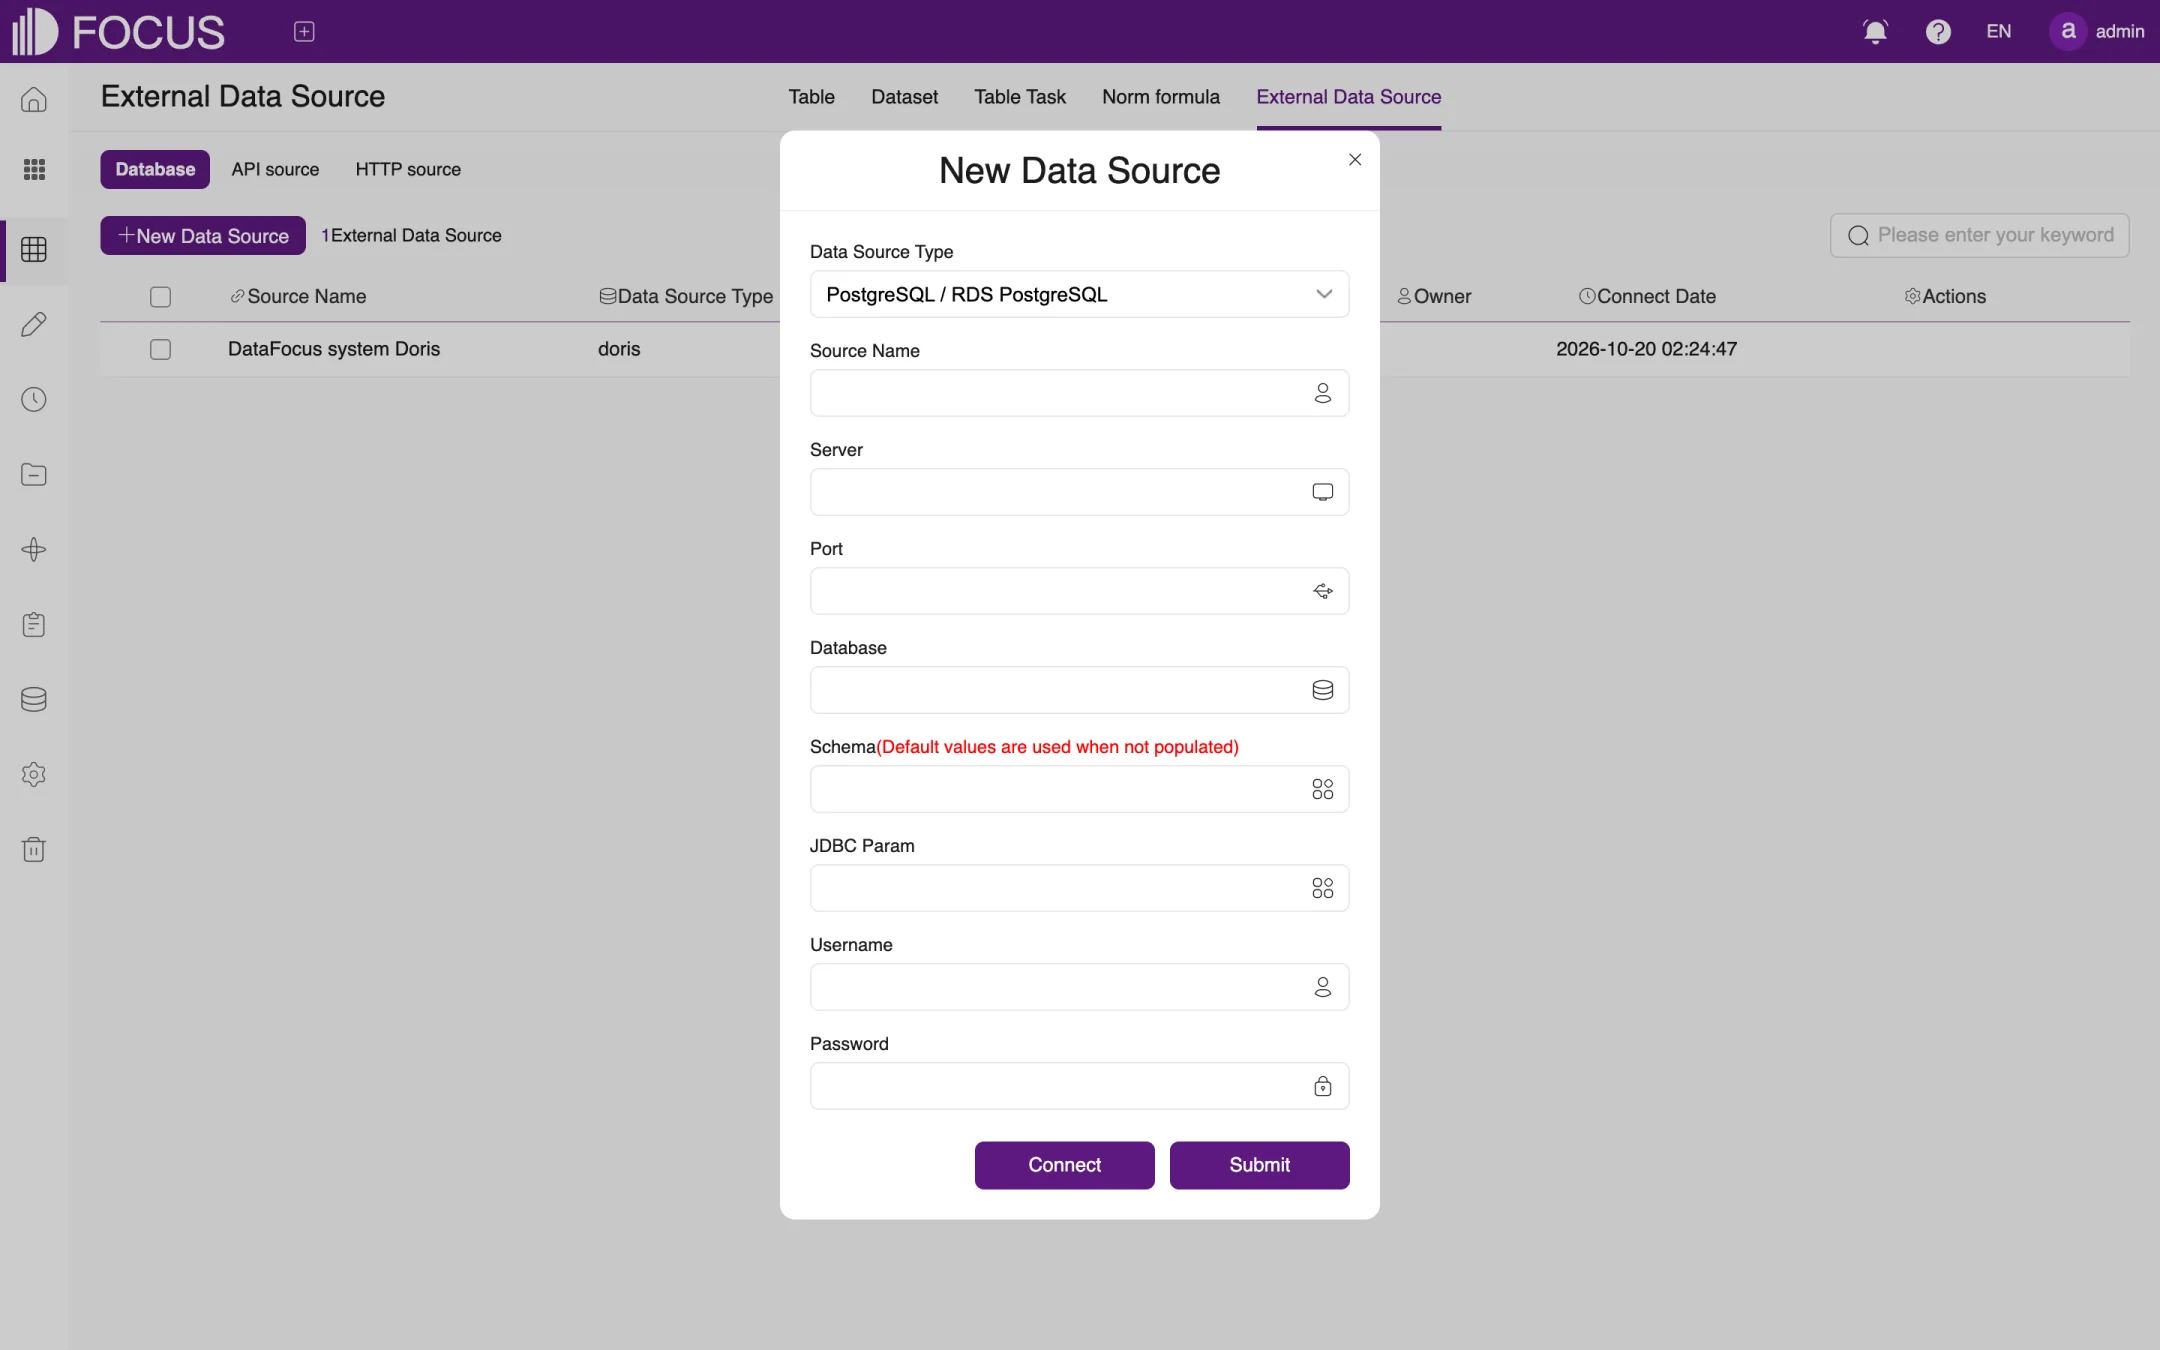
Click New Data Source (①) to open the New Data Source dialog, as shown in Figure 6-23:
Choose the Data Source Type. Supported types include PostgreSQL, MySQL (including MariaDB), Oracle, IBM DB2, GaussDB 100, SQL Server, Sybase, Greenplum, ClickHouse, Kudu, ElasticSearch, TeraData, MongoDB, Prometheus, Hive, Delta Lake, Iceberg, TiDB, SelectDB / Doris, OceanBase, SAP HANA, ClickZetta, Impala, DM8 (Dameng), ArgoDB and KingBase.
Enter the Source Name, Server, Port and Database. If Schema is left empty, the default is used. Enter JDBC Param if needed.
Enter the database Username and Password.
Click Connect to test the connection. When it succeeds, click Submit.
Figure 6-23. New data source
Note: We recommend creating a dedicated read-only database account for OT Flash, with access only to the databases and tables you want to analyze.
6.6.2Import tables from a data source
Once a data source is connected, you can import its tables into OT Flash:
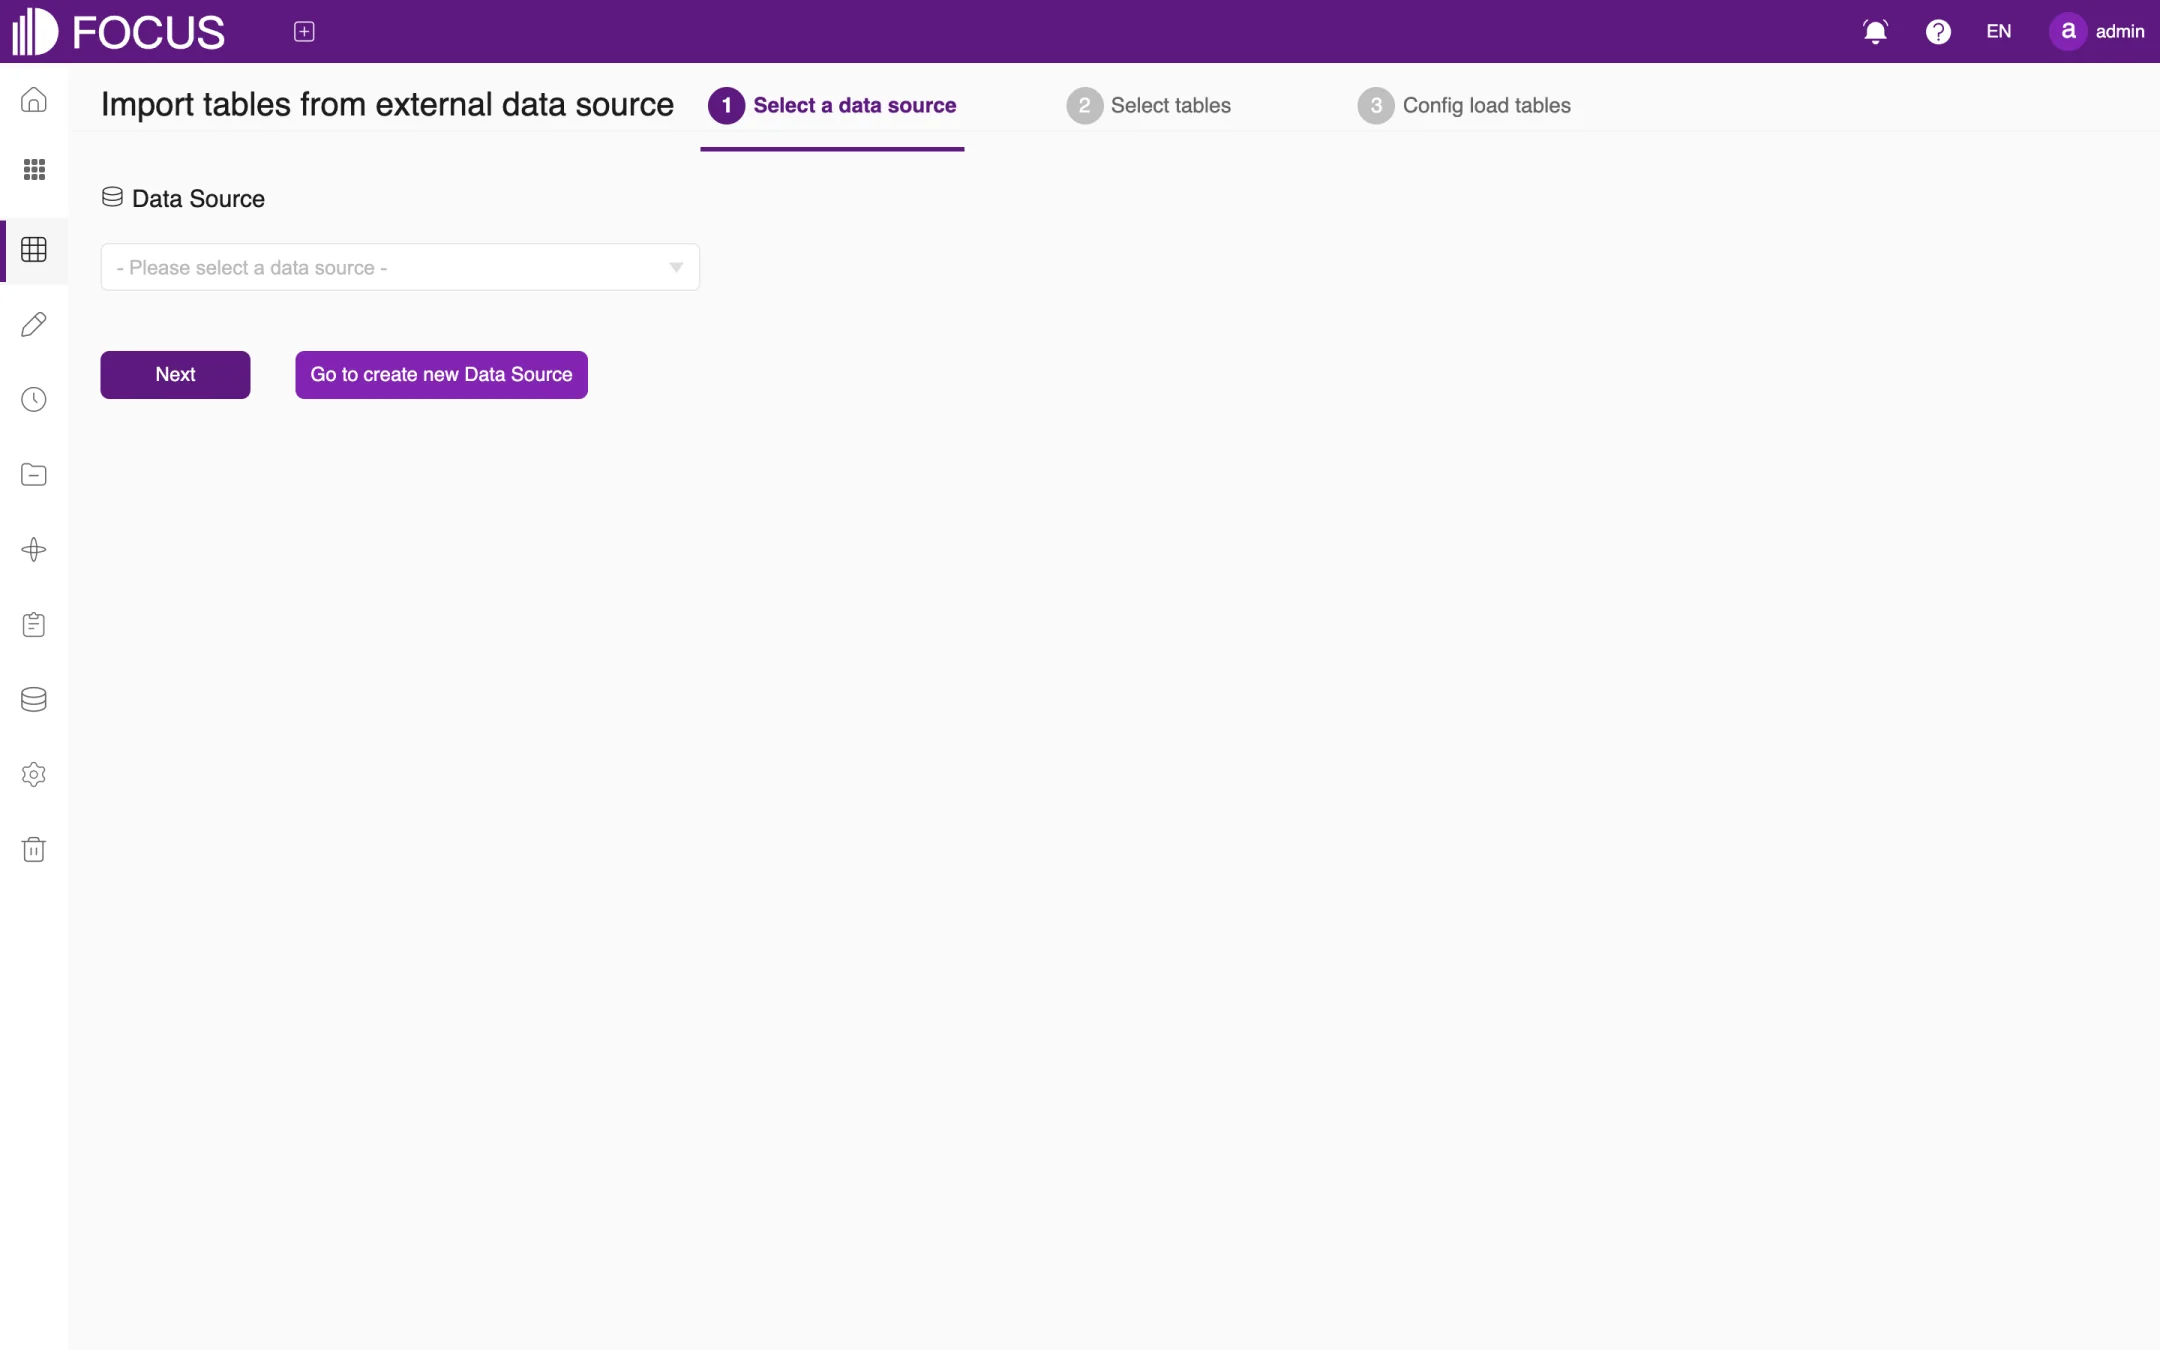
In the table list, click Import Table > Import table from external data source to open the import wizard, as shown in Figure 6-24.
Step 1, Select a data source: choose the data source in the drop-down list and click Next. If there is no data source yet, click Go to create new Data Source.
Step 2, Select tables: select the tables to import.
Step 3, Config load tables: set the import type and whether to import on a schedule.
When the wizard is finished, the tables appear in the table list. If you set up a scheduled import, you can see the task on the Table Task tab.
Figure 6-24. Import tables from a data source
Chapter 7Data Entry
Data Entry collects data that is not yet in the system, such as store inspection results, stock counts or plan approval comments. An administrator designs an entry form; business users then fill it in on the web page and submit it record by record. The data is written straight to the corresponding table and can then be used in search, pinboards and Ontology.
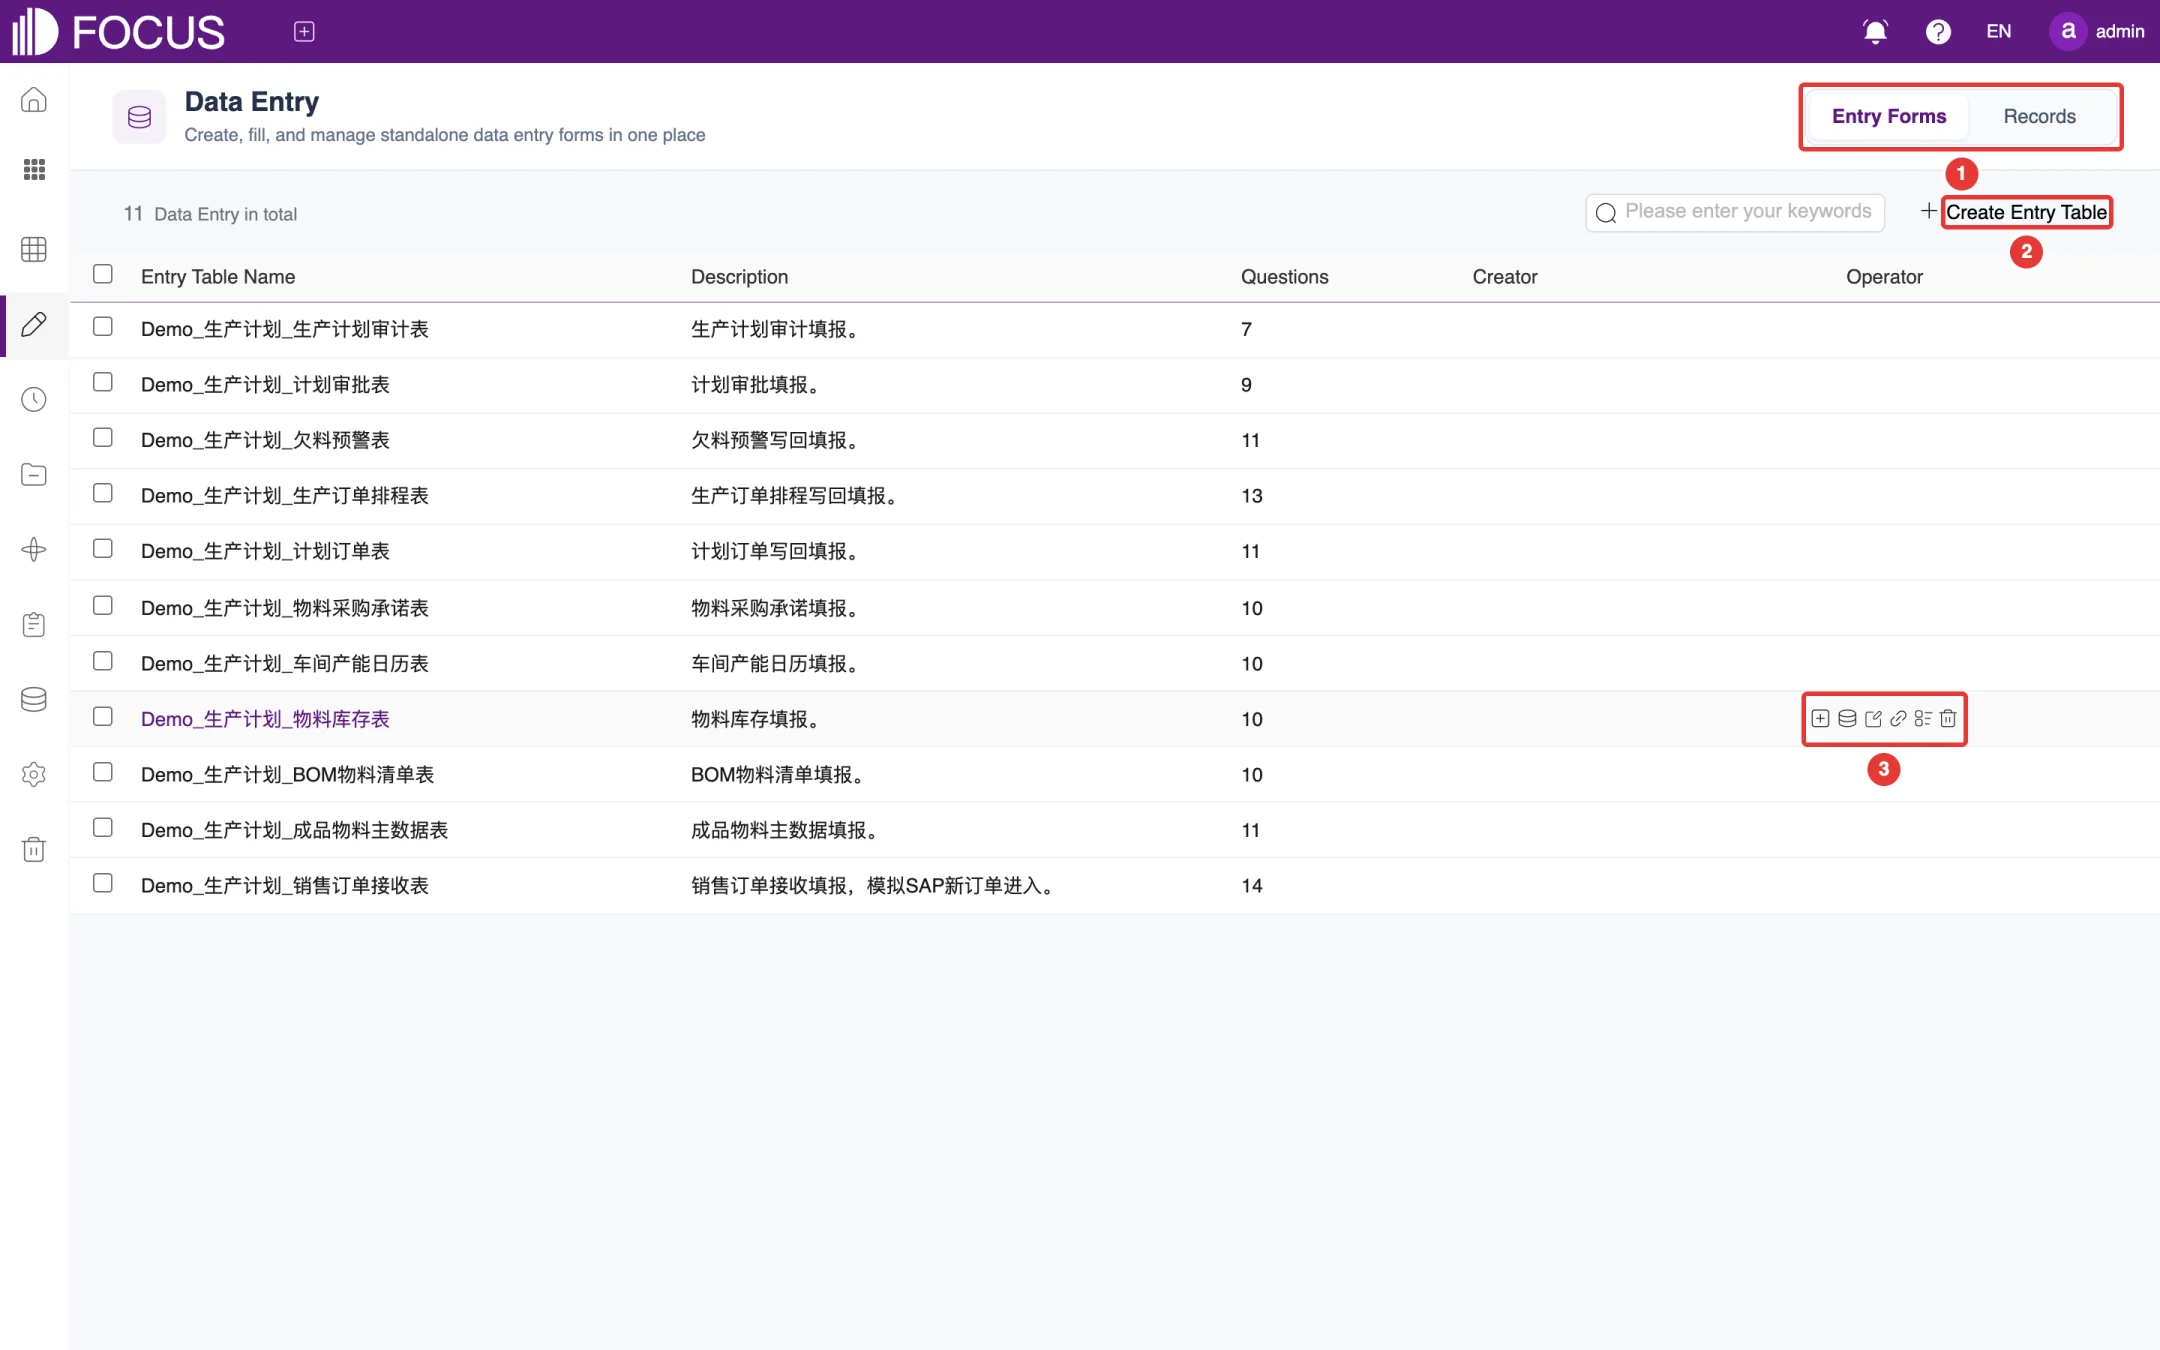
Click Data Entry in the left menu bar to open this module.
① Tabs: Entry Forms lists all entry forms; Records is where you view and manage submitted data.
② Create Entry Table: create a new entry form.
③ Action buttons: shown when you hover over a row.
Figure 7-1. Entry form list
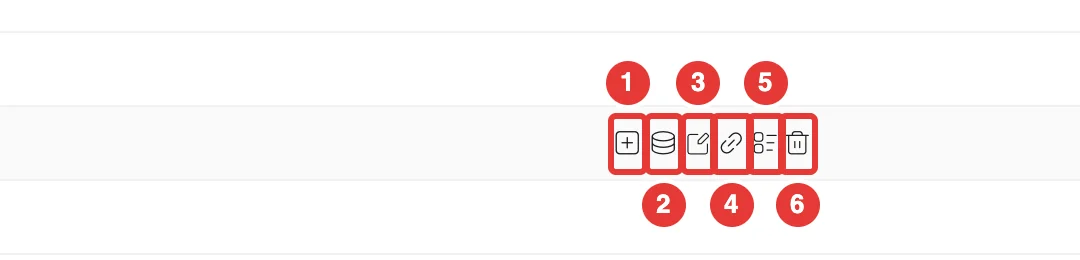
The list shows each form's Entry Table Name, Description, number of Questions and Creator. The forms in the figure, named Demo_生产计划_… (production planning), are the system's built-in demo forms, so their names and descriptions appear in Chinese. The action buttons, from left to right, are shown in Figure 7-2:
No.
Button
Purpose
①
Report
Open the form and fill in data
②
View data table
View the table that the entered data is written to
③
Edit
Change the form's question design
④
Outside Entry Link
Create a link that can be opened outside the system
⑤
Audit
View the form's submitted records
⑥
Delete
Delete the entry form
Figure 7-2. Entry form action buttons
7.2Create an entry form
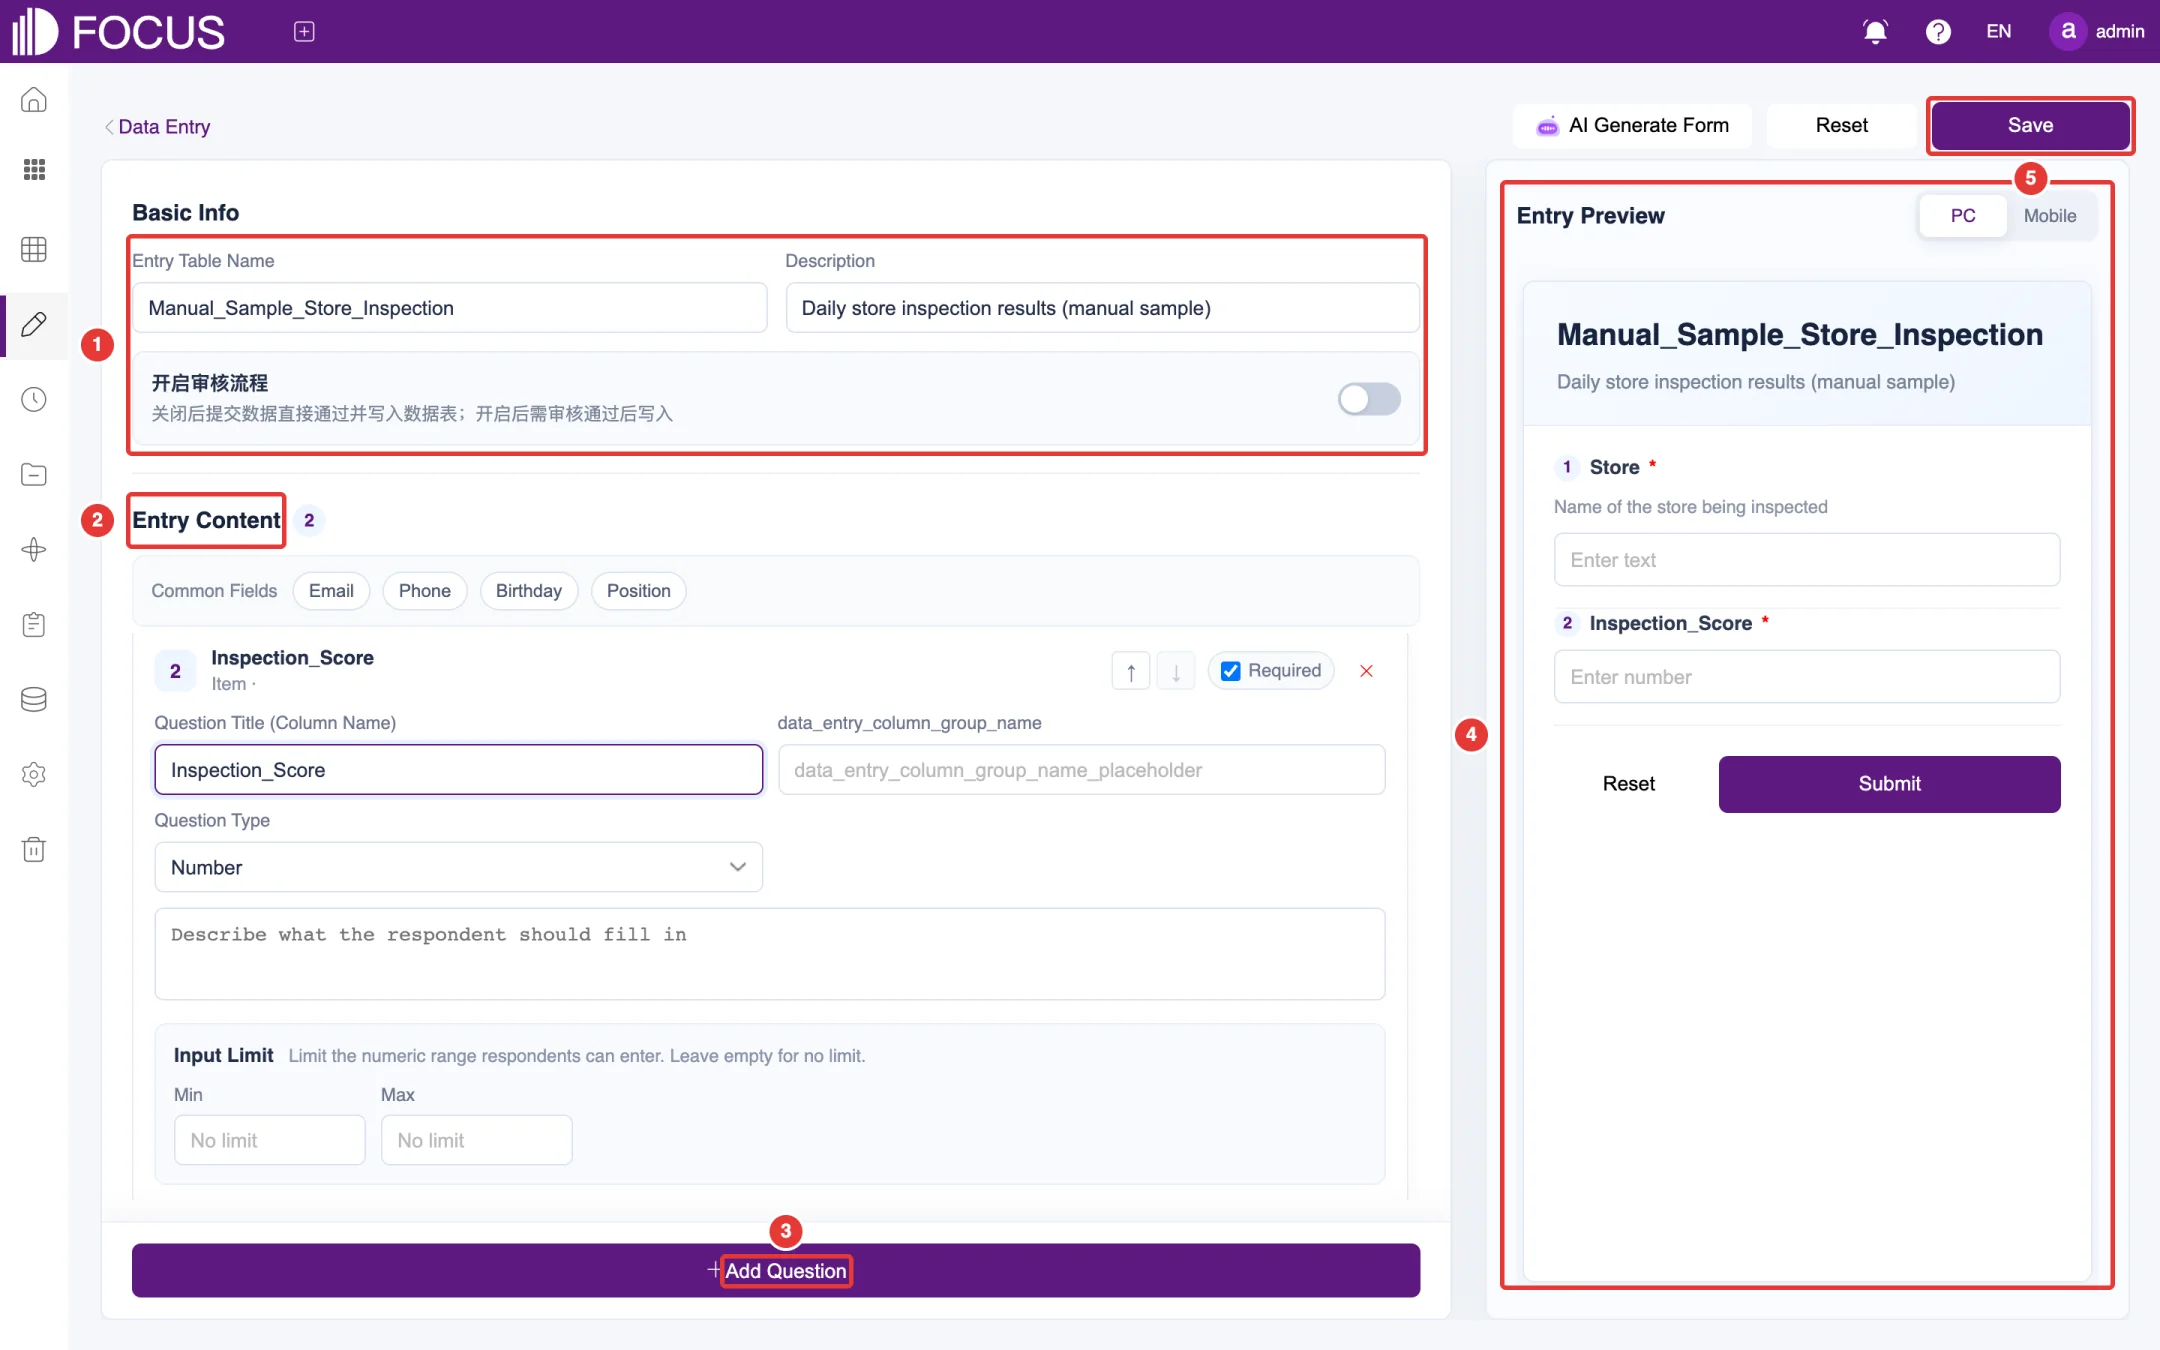
Click Create Entry Table to open the form designer, as shown in Figure 7-3. The figure shows a sample form, Manual_Sample_Store_Inspection, with two questions: Store and Inspection_Score.
Under Basic Info (①), enter the Entry Table Name and Description. If submitted data must be approved before it is written to the table, turn on the switch labeled 开启审核流程 ("Enable approval workflow"; this label and the hint under it are not yet translated). When the switch is off, submitted data is accepted and written to the table directly.
Under Entry Content (②), design the questions. For each question, set:
Question Title (Column Name): the question title, which is also used as the column name in the table;
Question Type: Text, Number, Email, Phone, Date, Dropdown, Single Choice, Multiple Choice or Current Time;
Question description (the box that reads "Describe what the respondent should fill in"): tells the respondent what to enter;
Input Limit: a length range for text or a value range (Min, Max) for numbers; leave it empty for no limit;
Required: check it to make the question mandatory.
The box next to the question title is labeled with the untranslated key data_entry_column_group_name (a group name for the question); it is left empty in this example. Use the up and down arrows at the upper right of a question to change the order of questions. Under Common Fields, click Email, Phone, Birthday or Position to add that question in one click.
Click Add Question (③) to add more questions.
Entry Preview (④) on the right shows the form as you design it; switch between PC and Mobile.
Click Save (⑤).
Figure 7-3. Create an entry form
Tip: AI Generate Form at the top of the page uses AI to generate the form's questions. You can still adjust each question afterward as described above.
7.3Fill in data
In the entry form list, click the form's name, or click Report in its row, to open the fill-in page.
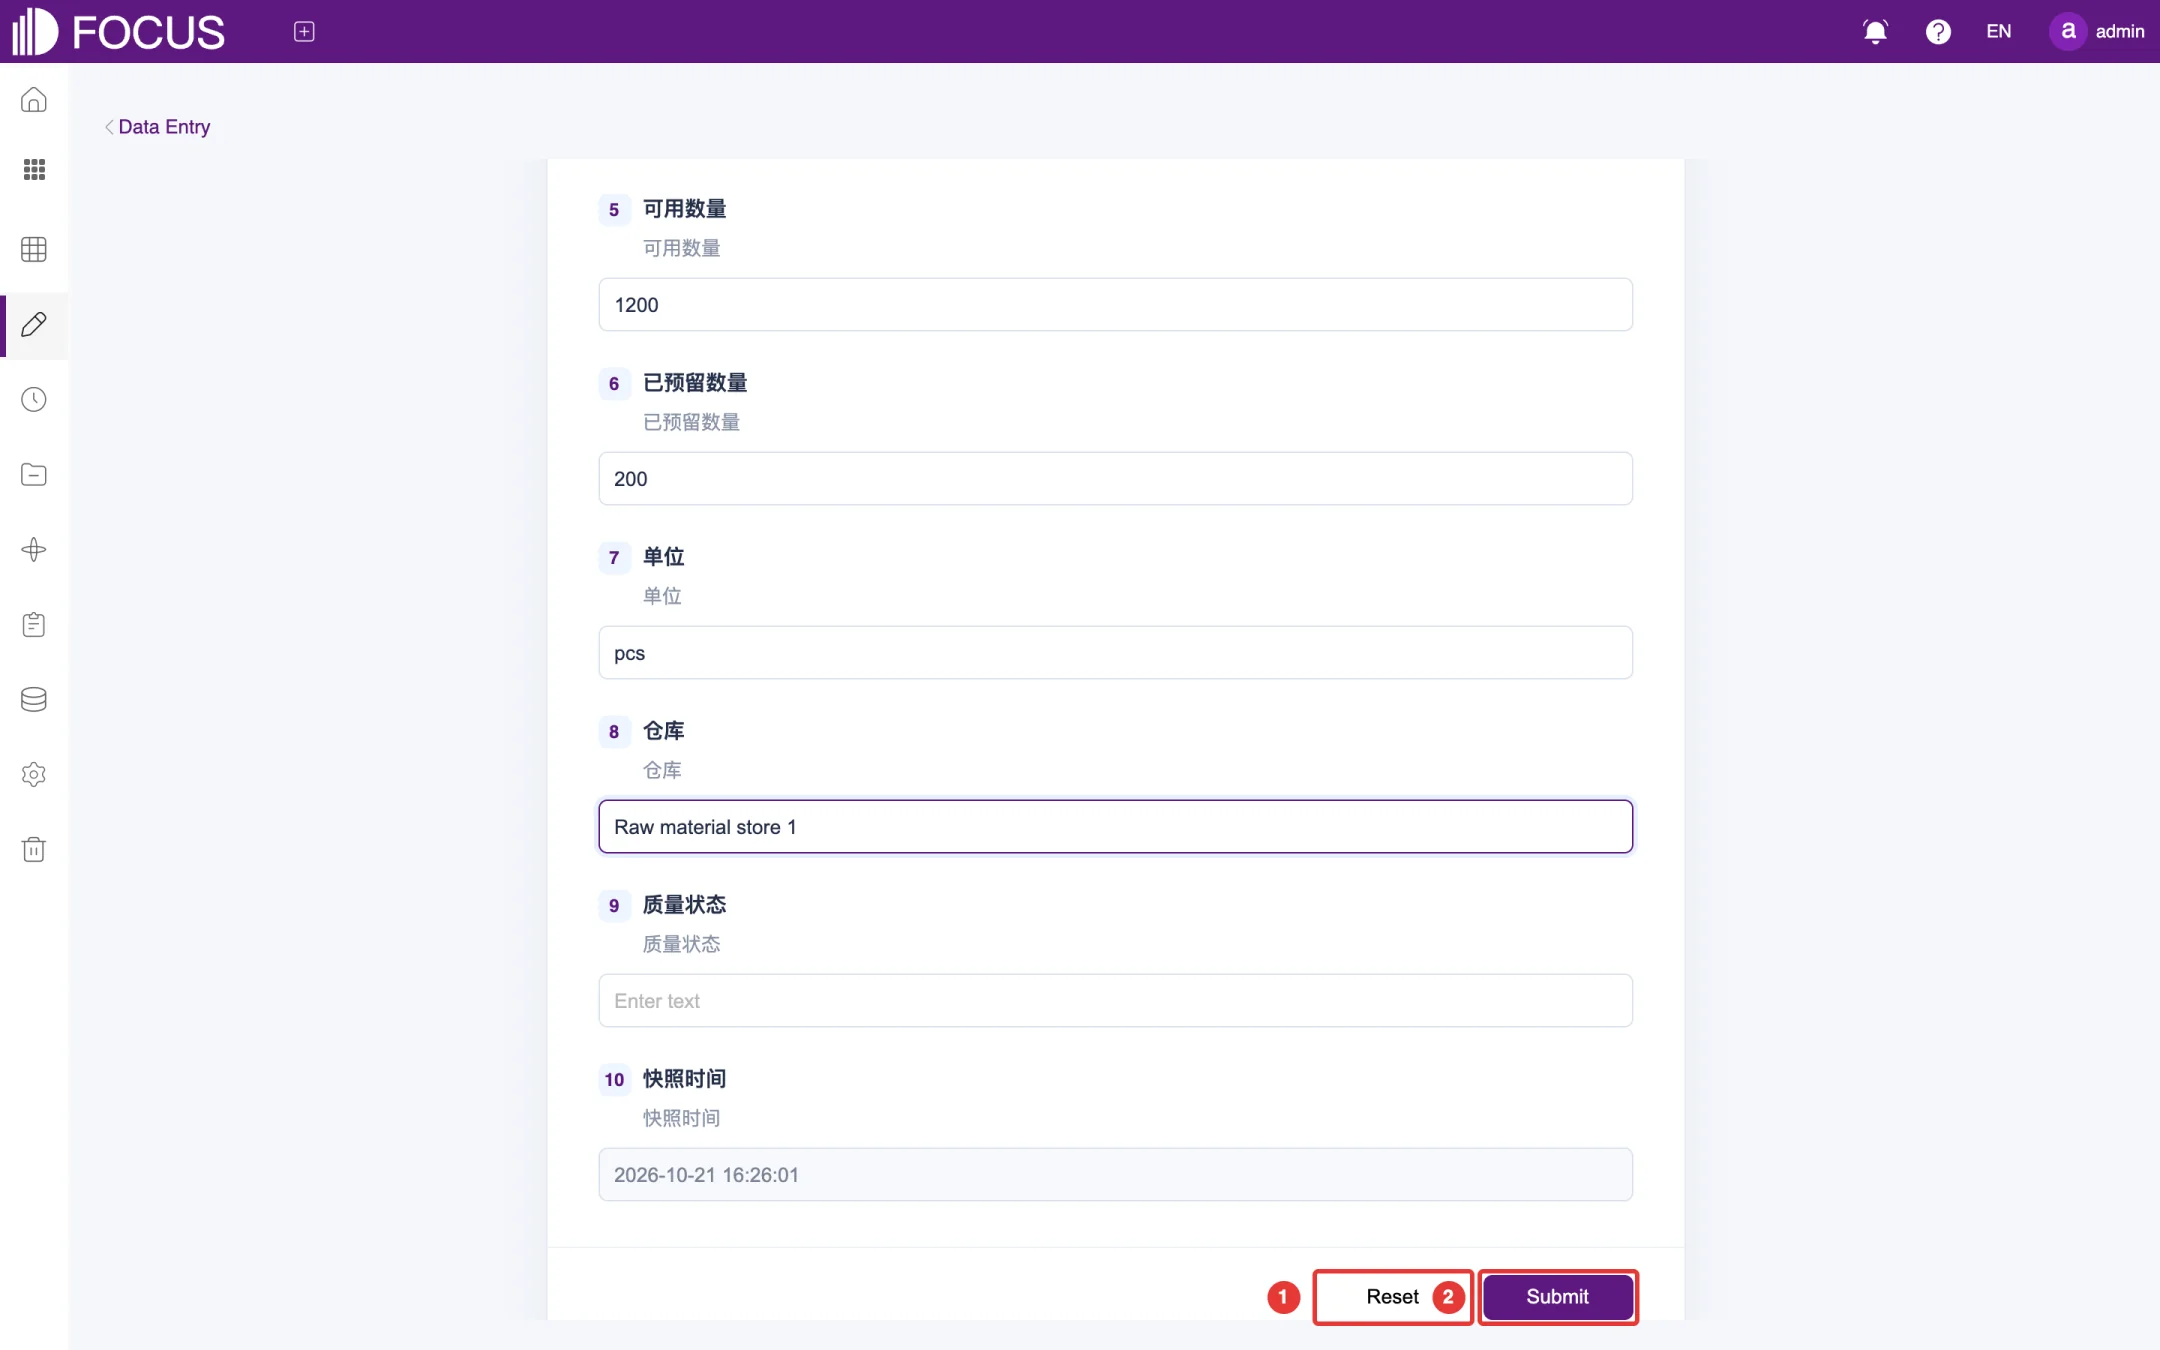
Answer the questions one by one. Questions marked "*" are required.
When you are done, scroll to the bottom of the page and click Submit (②), as shown in Figure 7-4. To start over, click Reset (①) to clear your answers.
Figure 7-4. Fill in data
The figure shows the built-in demo form Demo_生产计划_物料库存表 (production planning – material inventory) with English sample values typed in; its question labels are in Chinese because it is system demo data.
7.4View submitted records
Click the Records tab to open the record management page. In this release the page is not yet translated, so its labels appear in Chinese:
In the form list on the left (headed 选择填报表, "Select entry form"), choose a form; you can search the list by name.
Use 状态筛选 ("Status filter") to show records by approval status.
The 填报记录 ("Entry records") list on the right shows the submitted data. Its heading shows the form name, the number of fields and the current filter.
Click 继续填报 ("Continue filling in") to go on filling in the form, or 刷新记录 ("Refresh records") to load the latest submissions.
7.5Outside entry links
To let people without a system account fill in a form, create an outside entry link:
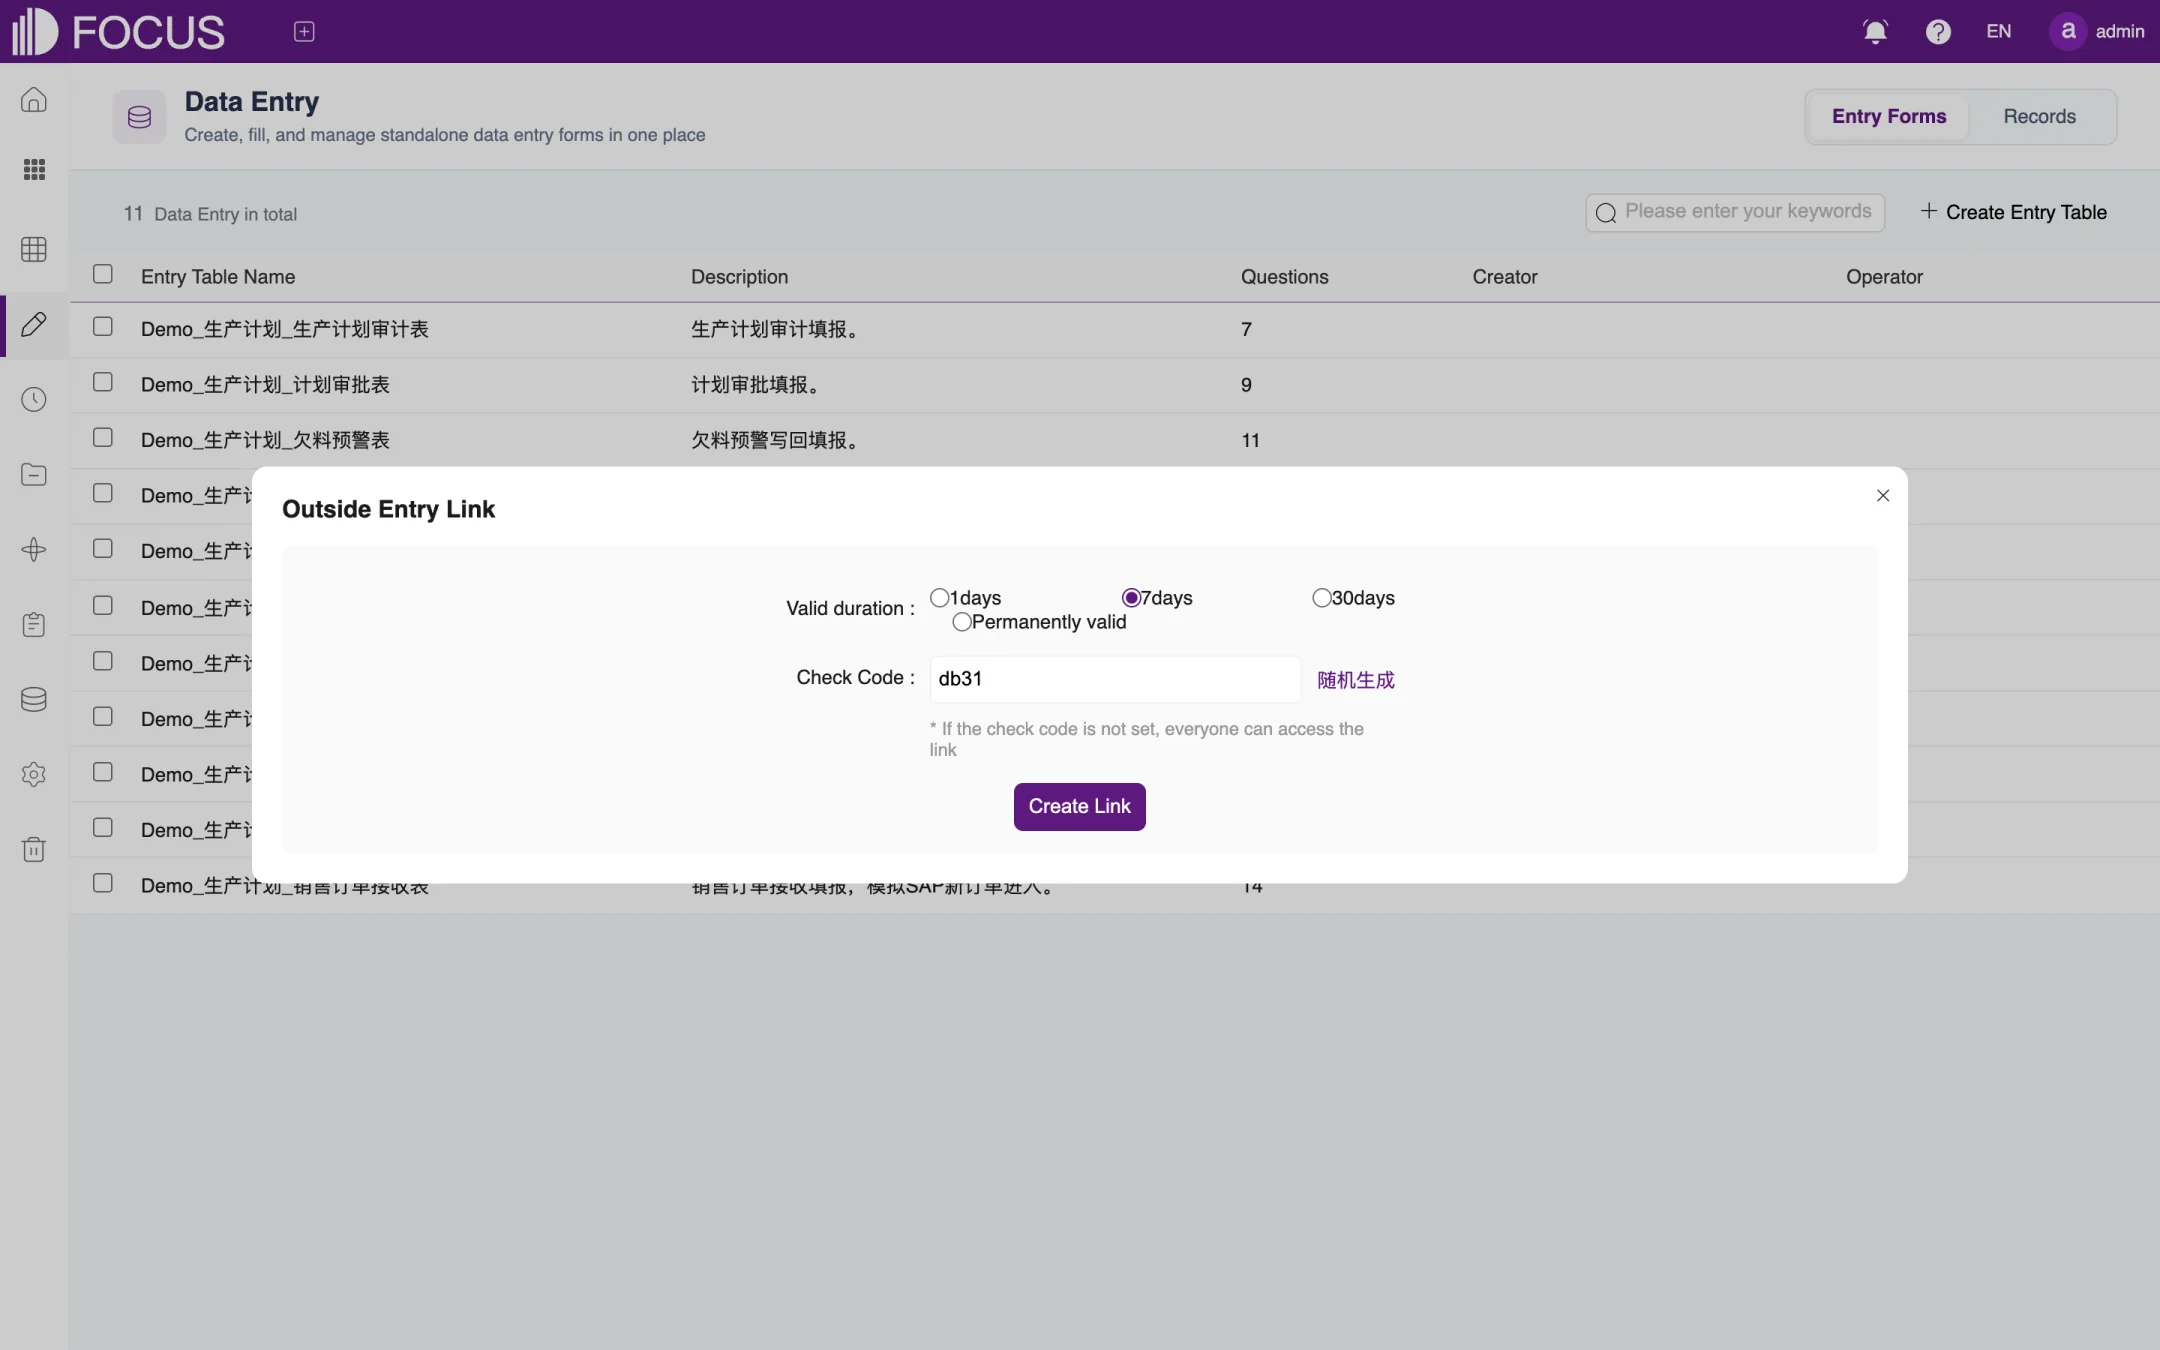
In the form's row, click Outside Entry Link to open the settings dialog, as shown in Figure 7-5.
Choose the Valid duration: 1 day, 7 days, 30 days or Permanently valid.
Set a Check Code. To have one generated for you, click the link next to the box, which reads 随机生成 ("Generate randomly") on screen. With a check code set, respondents must enter it to open the form; without one, anyone who has the link can fill in the form.
Click Create Link and send the link to the people who will fill in the form.
Figure 7-5. Outside entry link
Chapter 8Schedule Send
Schedule Send automatically delivers analysis results, such as answers and pinboards, to the people who need them at the times you set. Delivery channels include group robots in Enterprise WeChat, DingTalk and Feishu, Enterprise WeChat apps, and email.
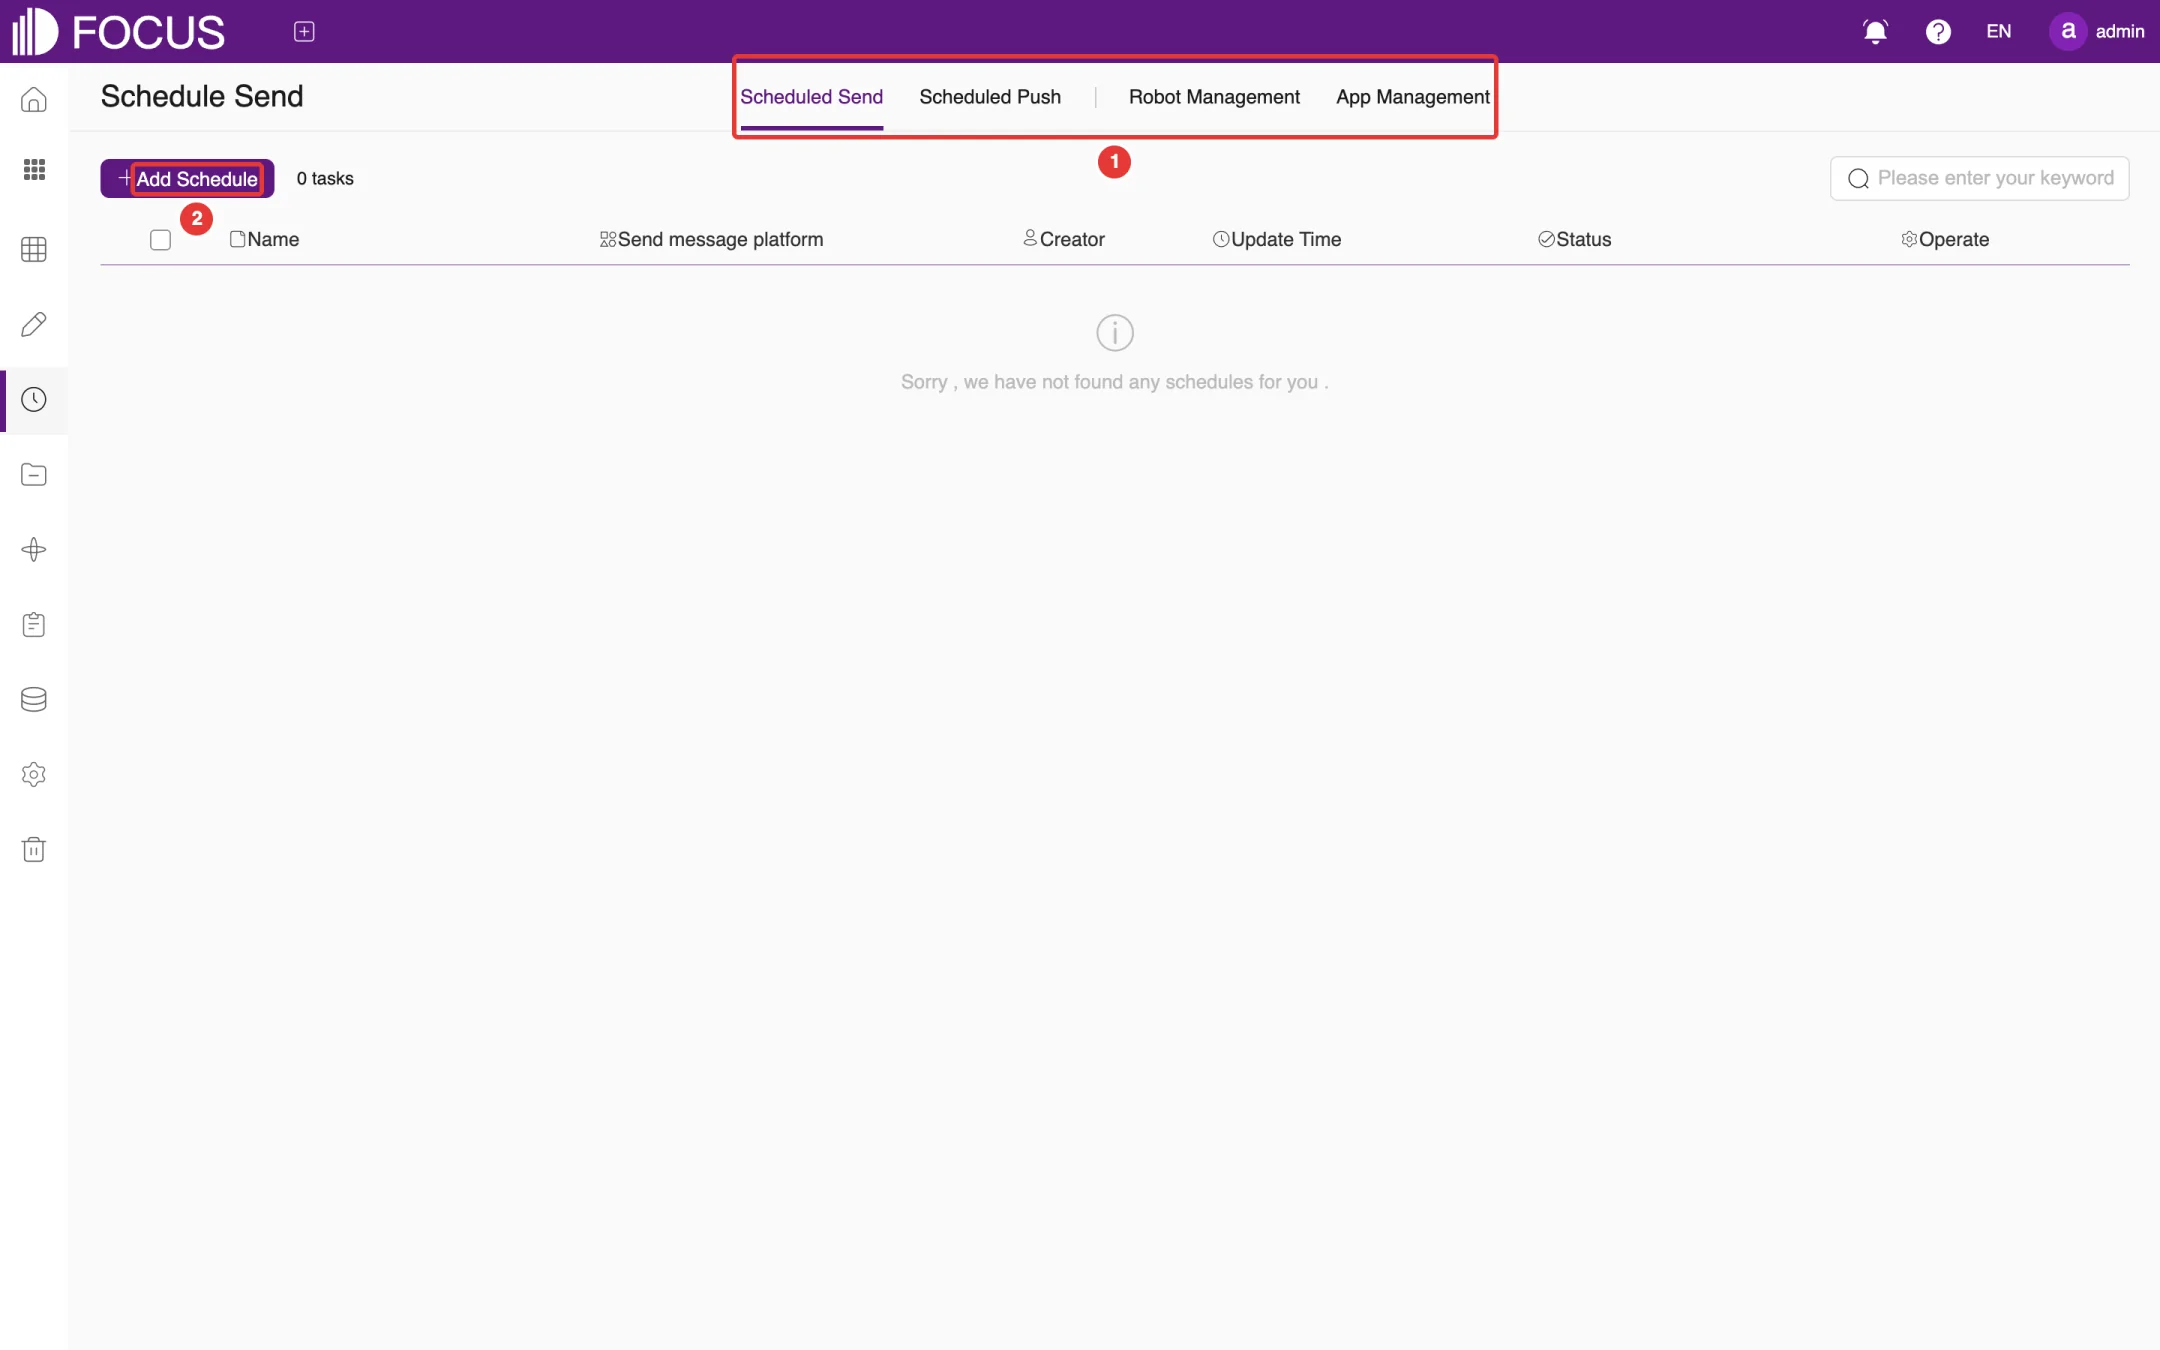
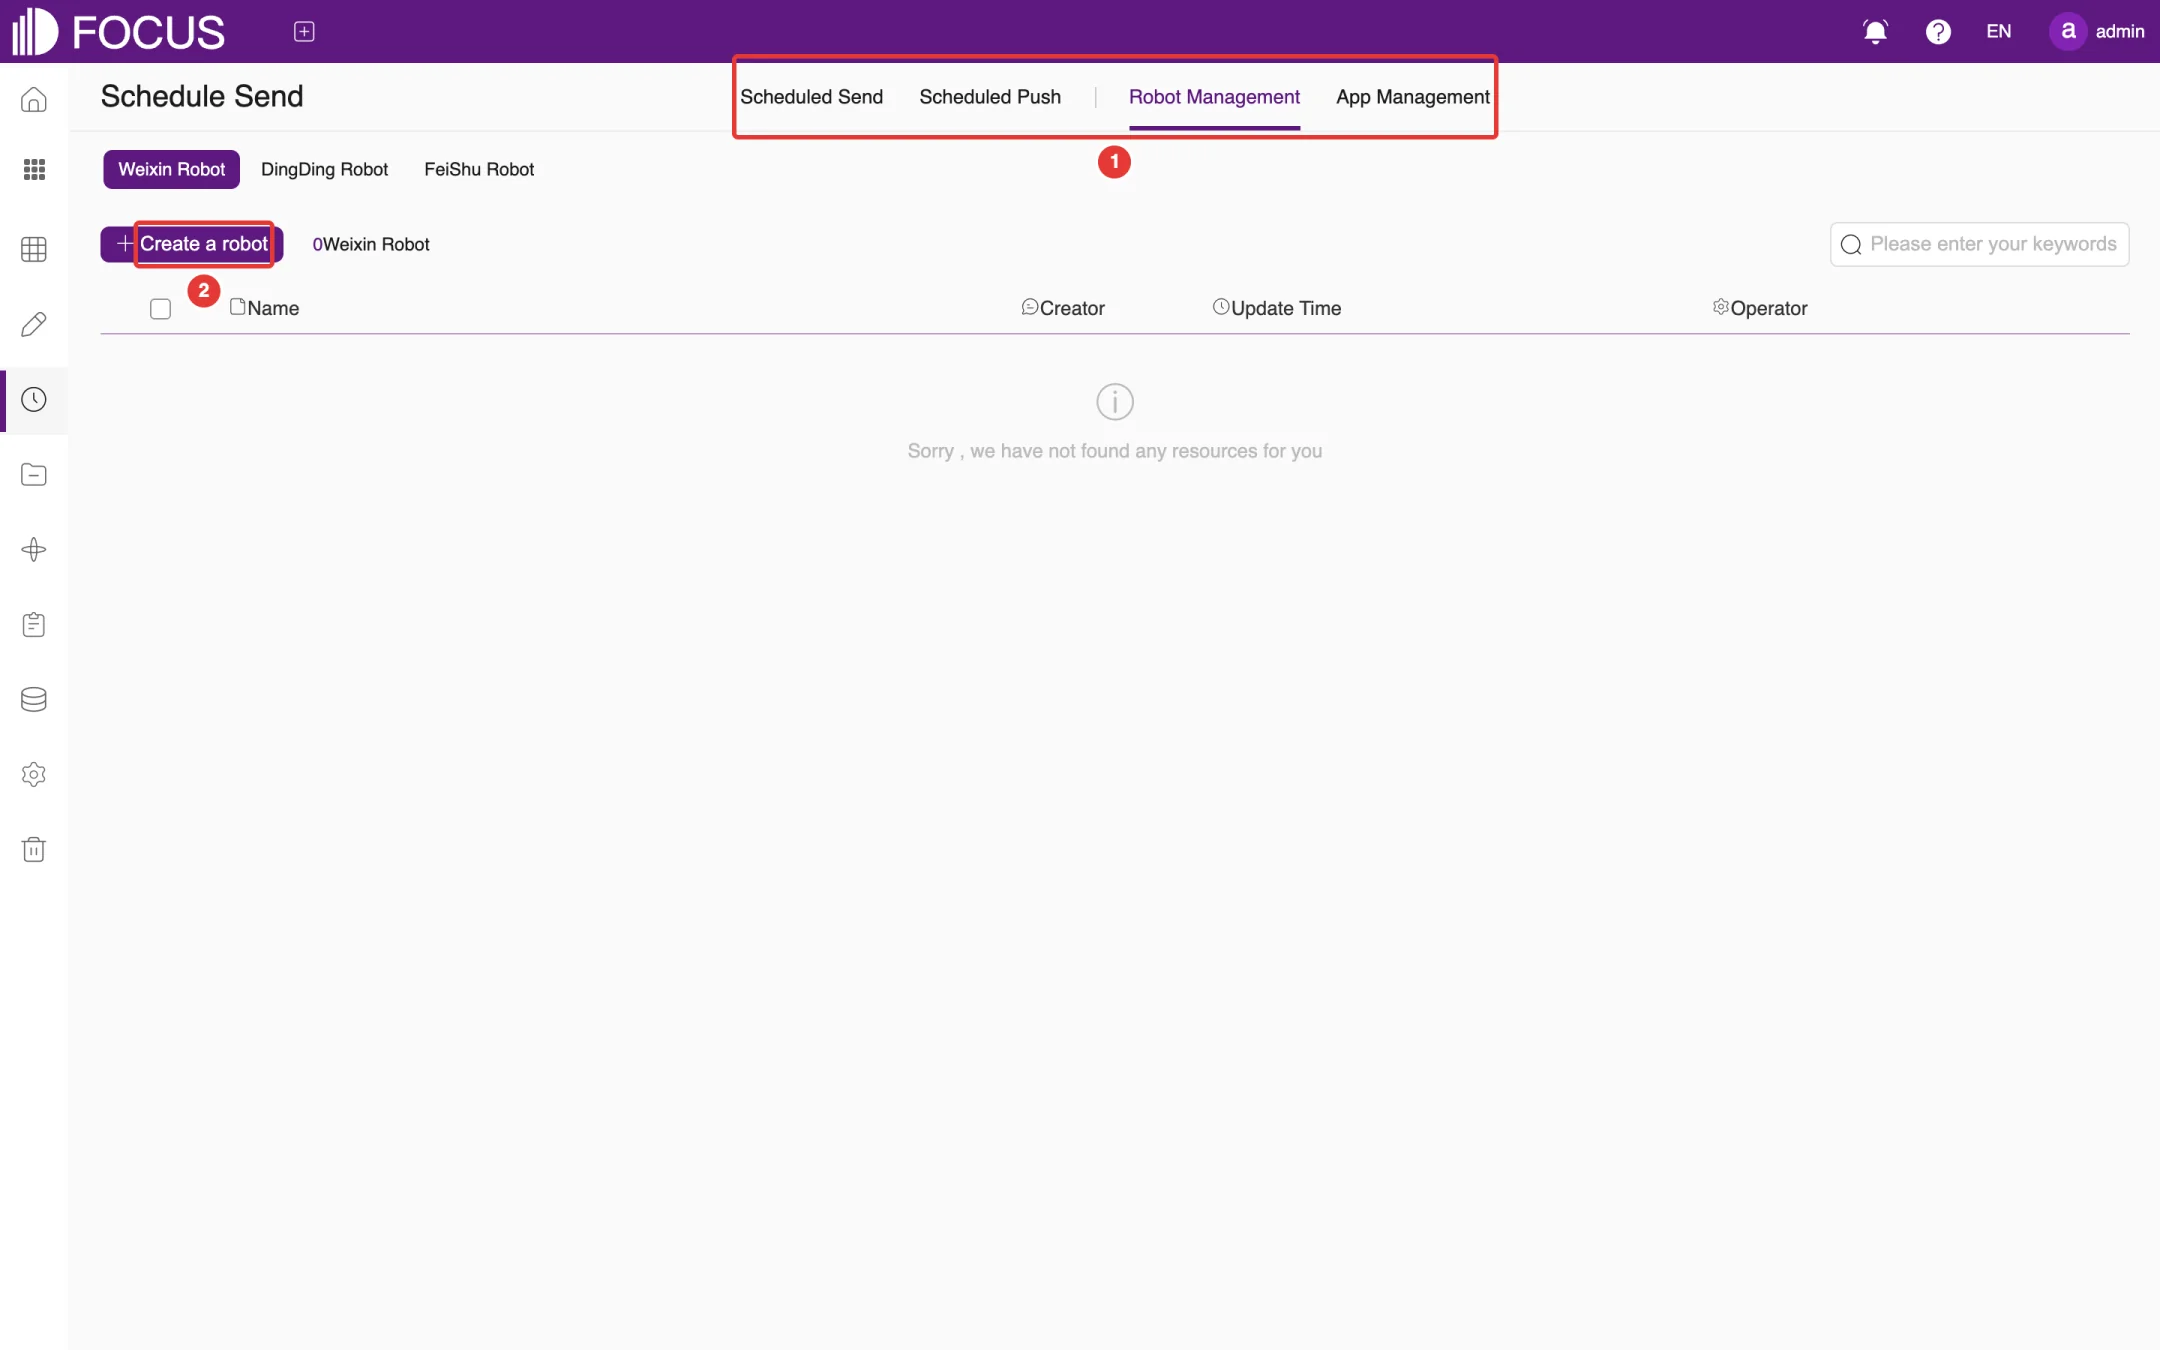
Click Schedule Send in the left menu bar to open this module. There are four tabs at the top of the page, as shown at ① in Figure 8-1:
Scheduled Send: pushes data from answers or pinboards to work groups through a group robot or an Enterprise WeChat app;
Scheduled Push: emails pinboards and other content on a schedule as EXCEL or PDF attachments;
Robot Management: maintains group robot accounts for Enterprise WeChat, DingTalk and Feishu;
Before you use Scheduled Send, add a sending account under Robot Management or App Management. Before you use Scheduled Push, an administrator must configure the mail server under Admin > Configure.
8.1Add sending accounts
8.1.1Group robots
Open the Robot Management tab and choose the robot type at the top: Weixin Robot (Enterprise WeChat group robot), DingDing Robot or FeiShu Robot, as shown in Figure 8-2.
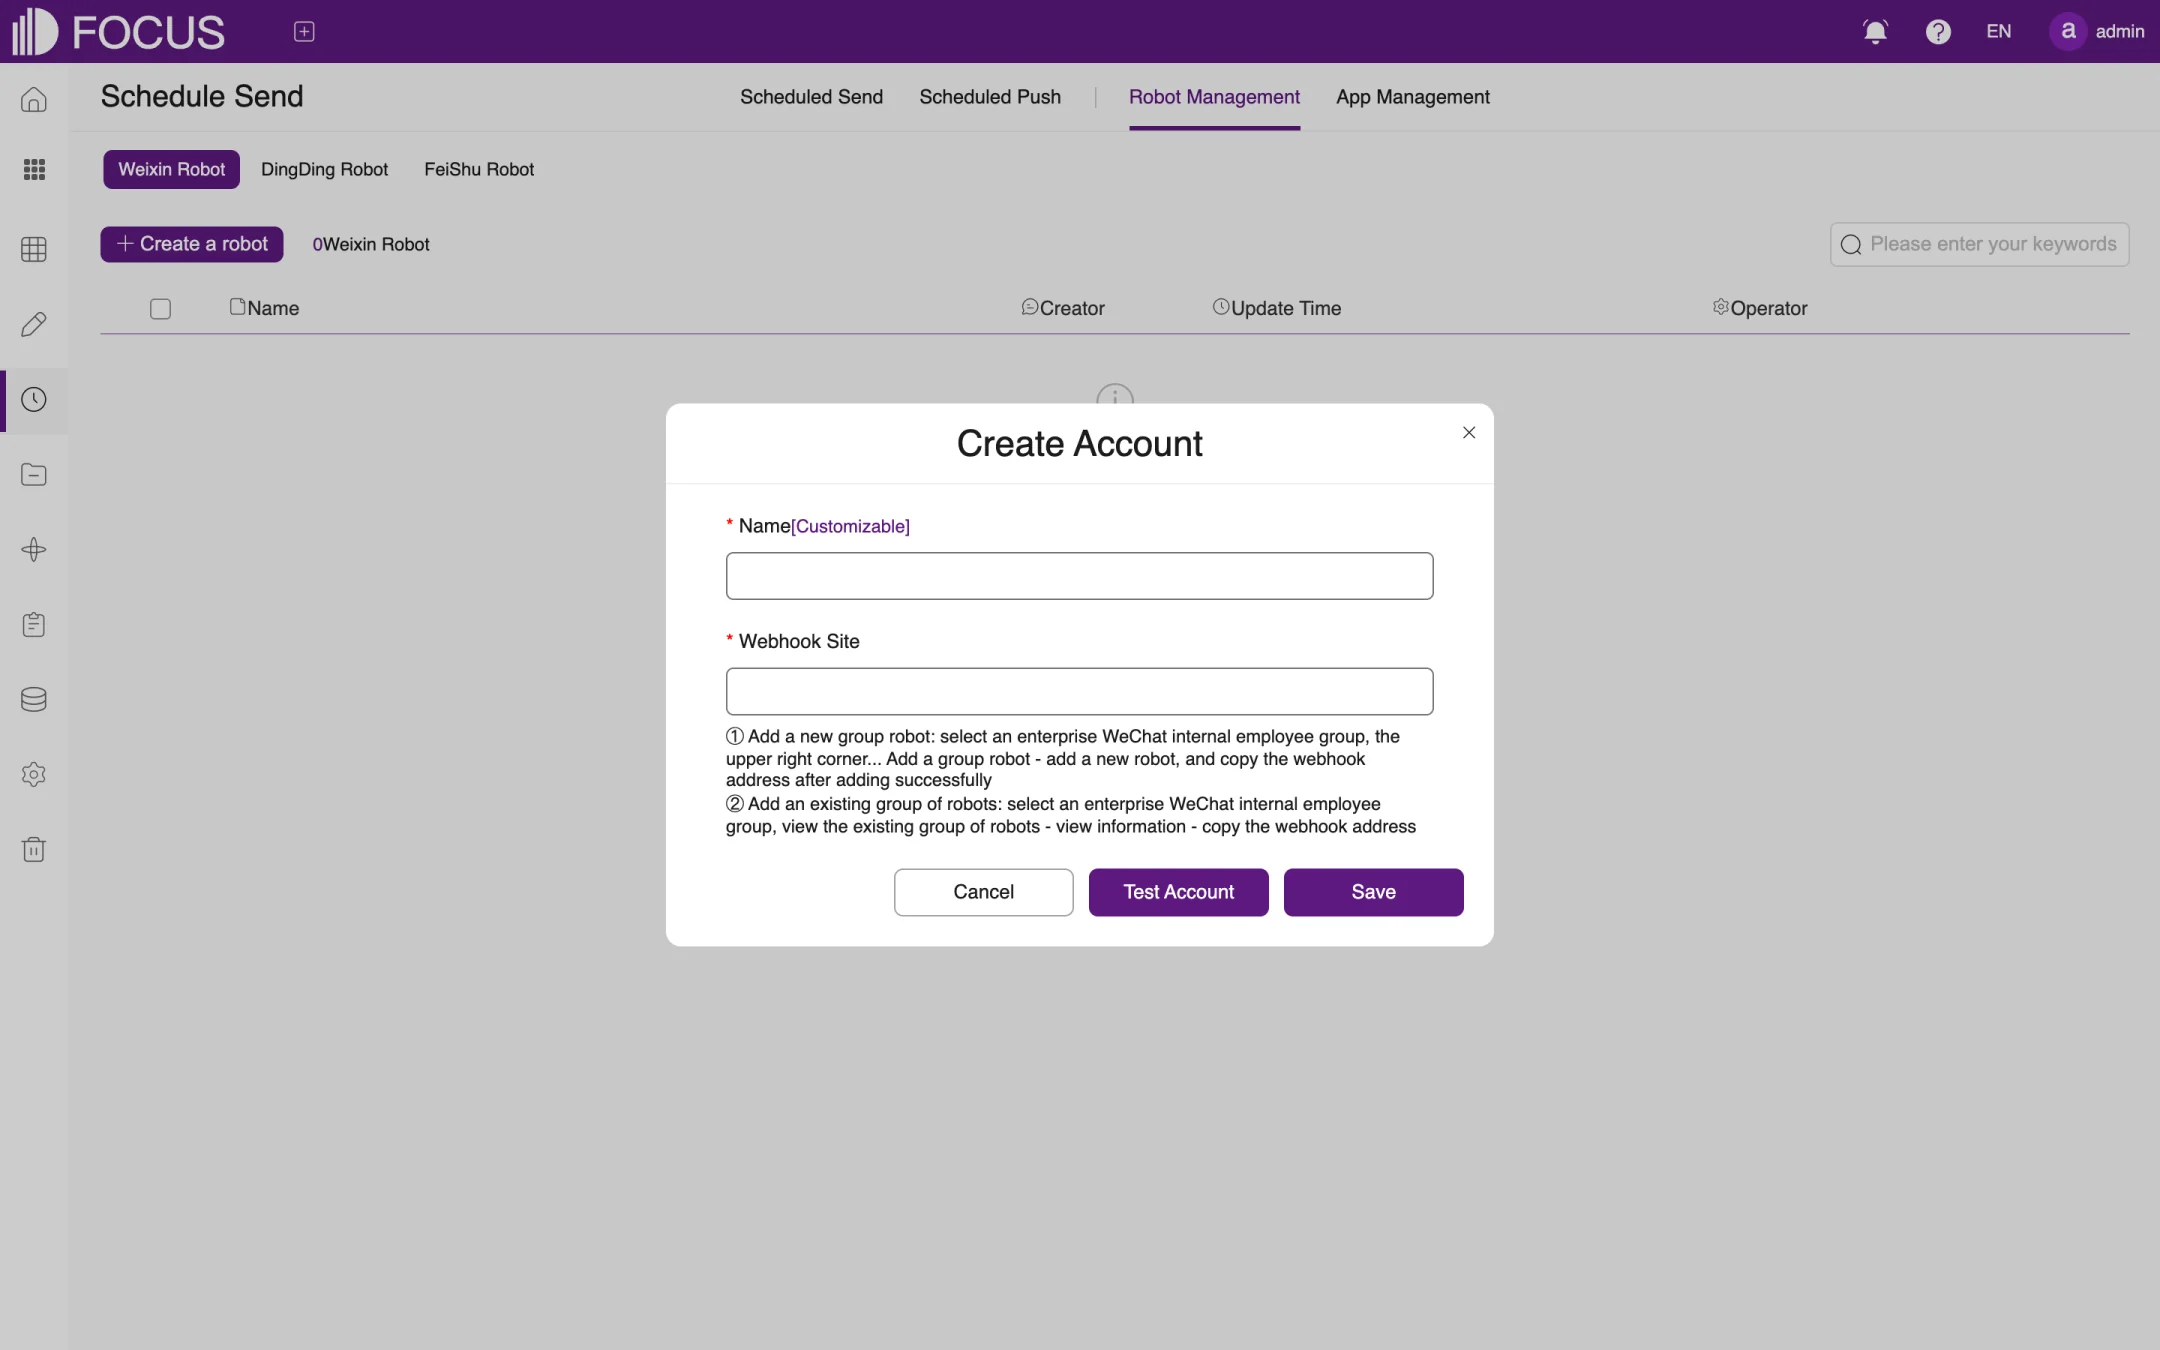
Click Create a robot (②) to open the Create Account dialog, as shown in Figure 8-3.
Enter a Name (any name you like) and the Webhook Site (the robot's webhook URL). For Enterprise WeChat: in an internal employee group, click "…" in the upper-right corner and add a group robot; once it is added, copy its webhook URL. If the group already has a robot, open the robot's profile and copy the URL there.
Click Test Account to check that messages arrive, then click Save.
Figure 8-2. Robot ManagementFigure 8-3. Add an Enterprise WeChat group robot
8.1.2Enterprise WeChat App
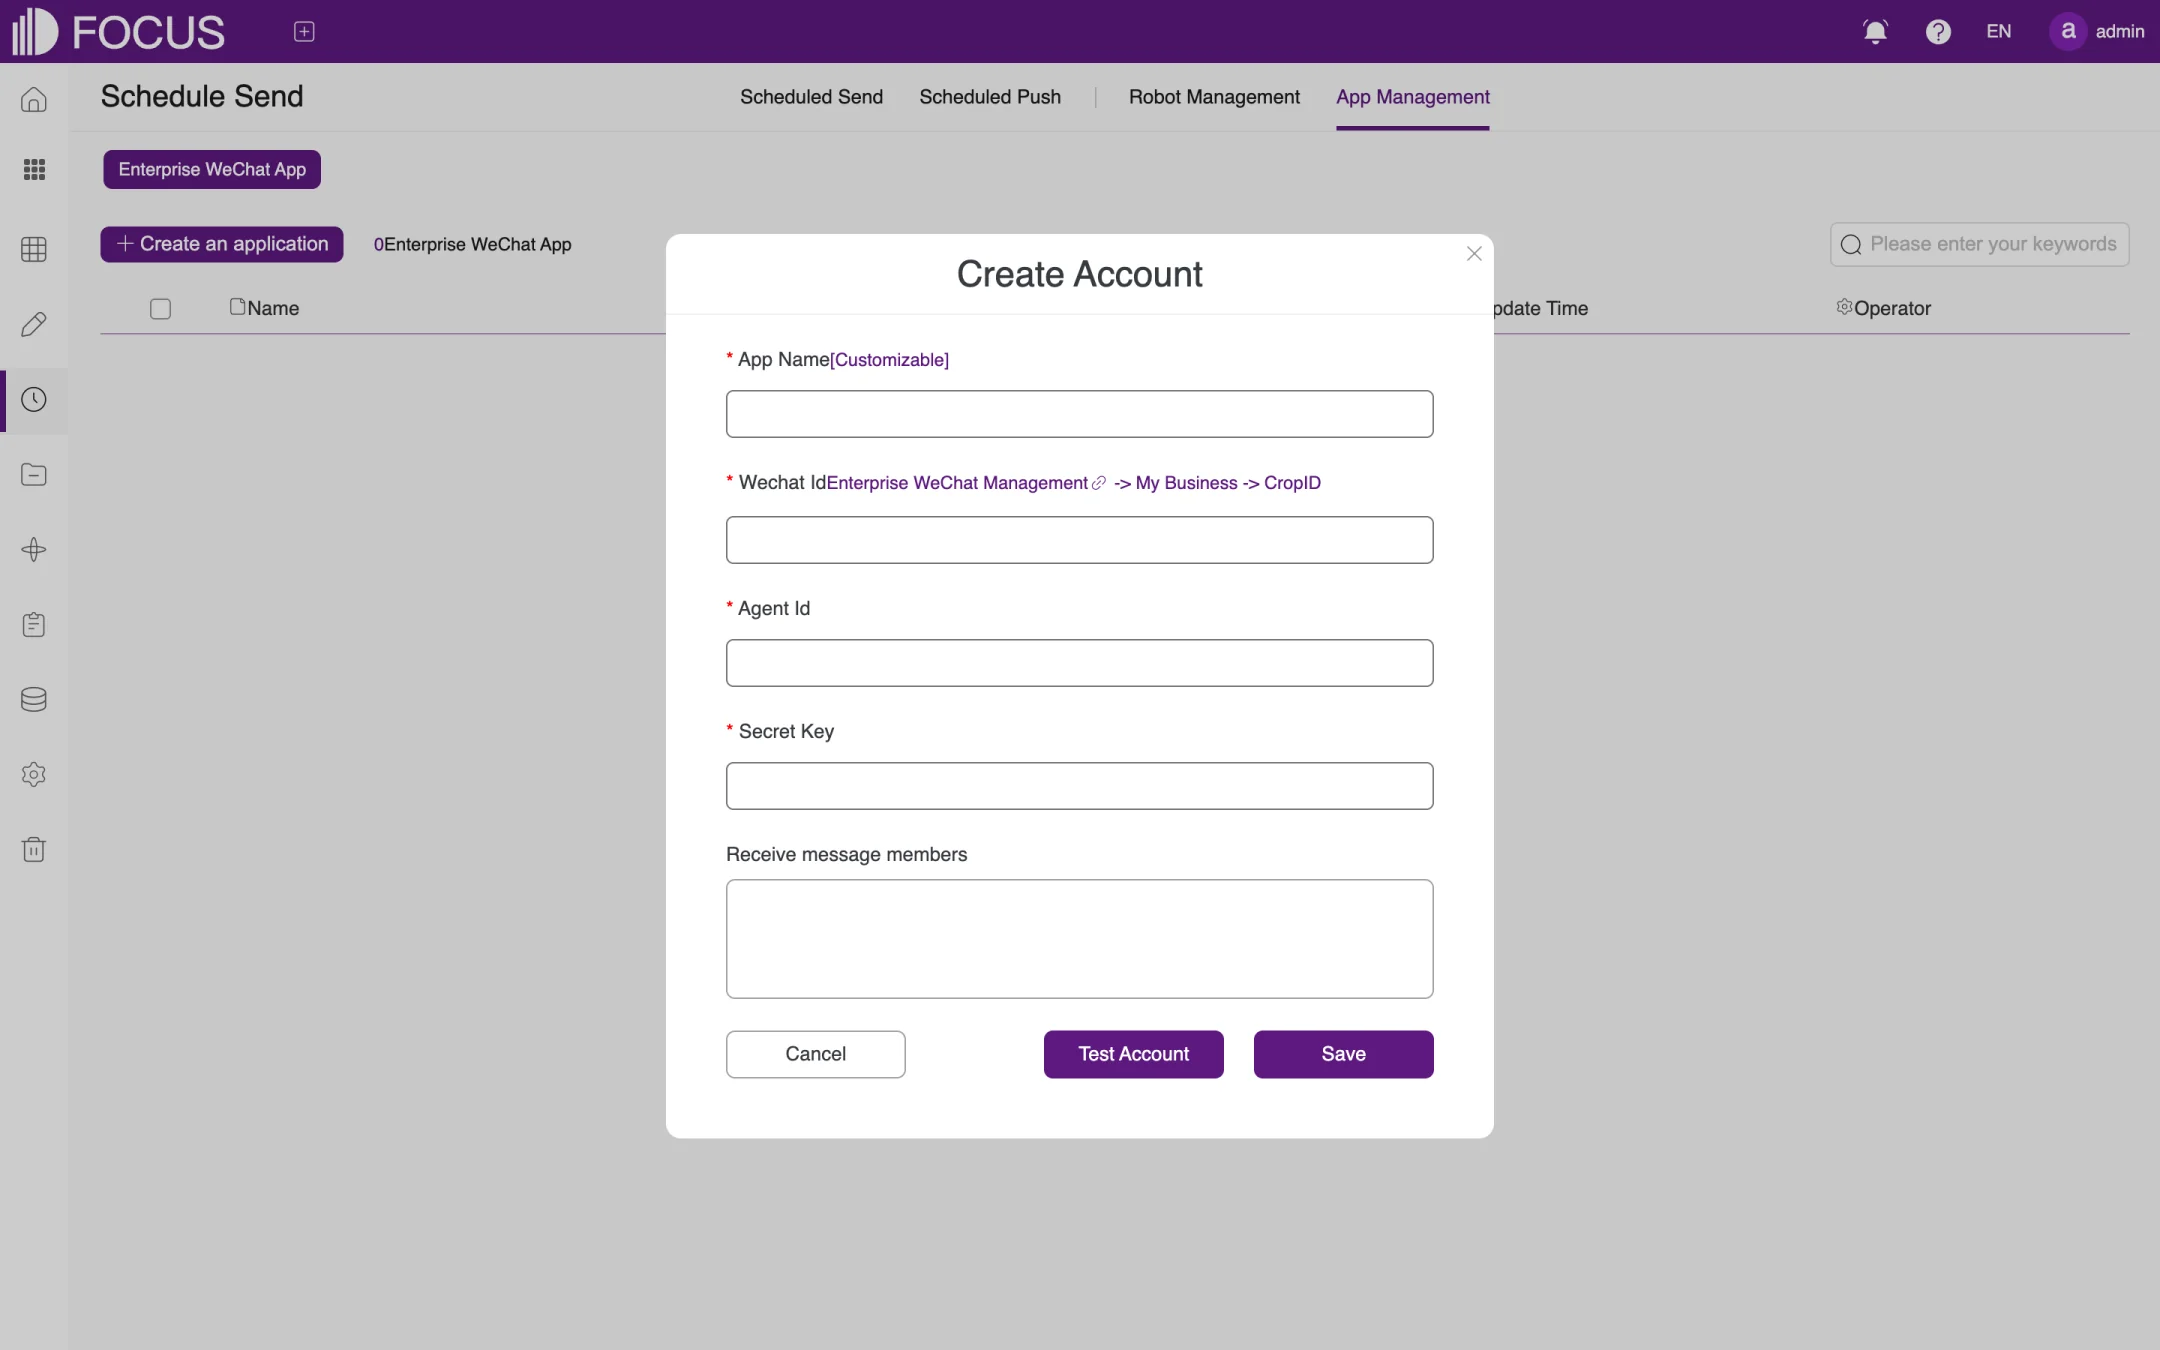
Open the App Management tab and click Create an application to open the Create Account dialog, as shown in Figure 8-4.
Enter the App Name, the corporate ID (CorpId) from the Enterprise WeChat admin console in Wechat Id, and the custom app's Agent Id and Secret Key.
Under Receive message members, enter the members who should receive the messages.
Click Test Account to check the settings, then click Save.
Figure 8-4. Add an Enterprise WeChat app
8.2Create a scheduled send task
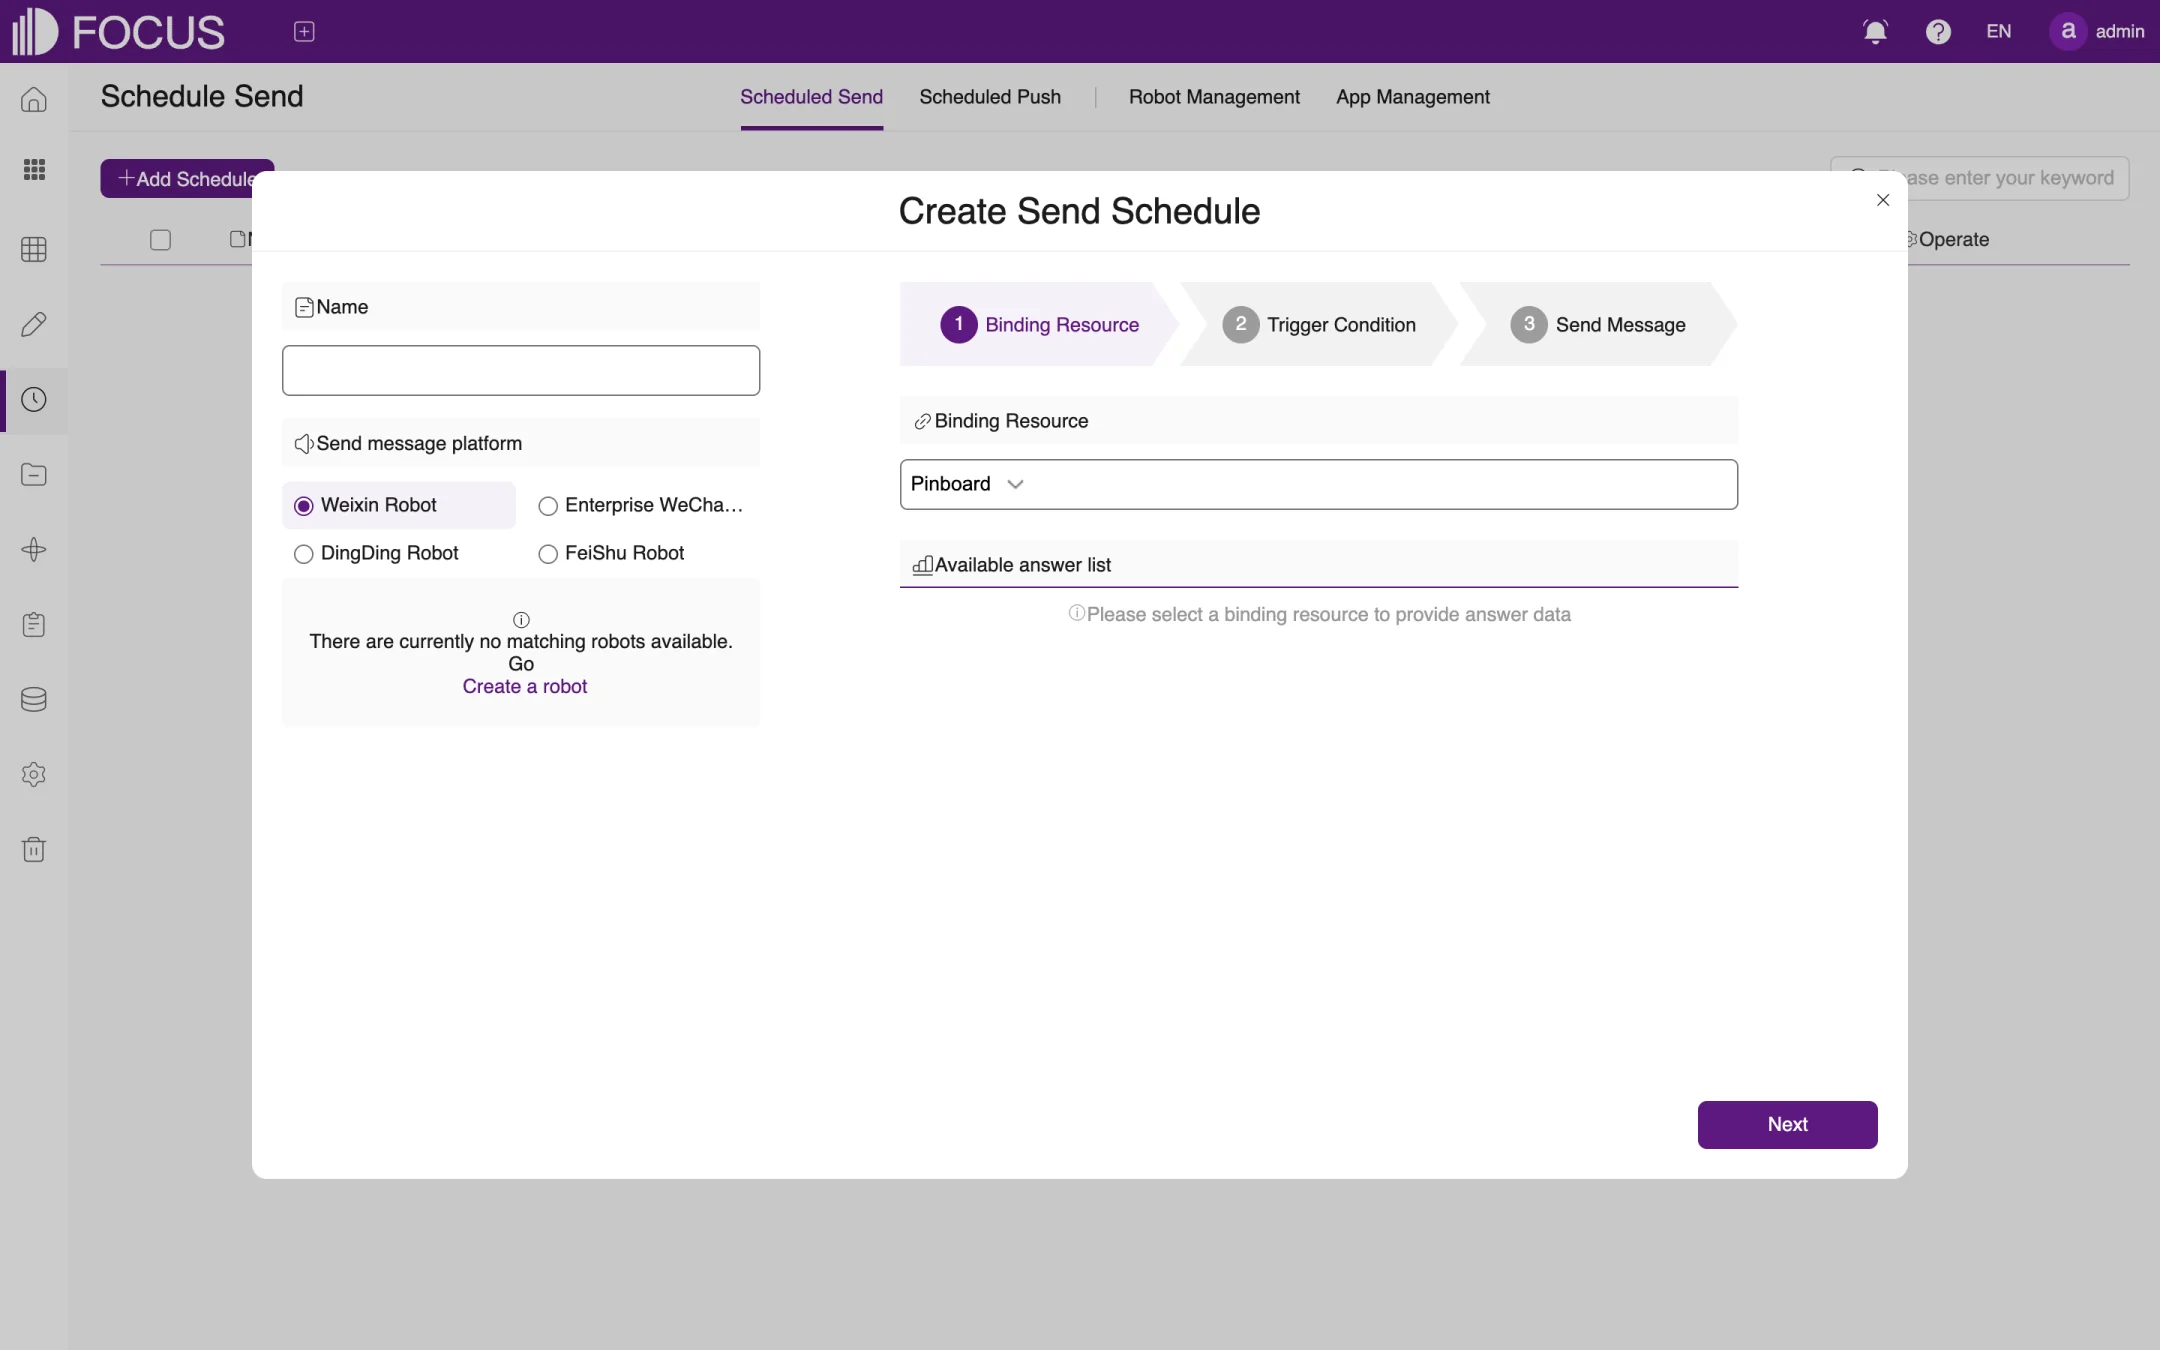
On the Scheduled Send tab, click Add Schedule (② in Figure 8-1) to open the Create Send Schedule dialog, as shown in Figure 8-5.
On the left, enter the task Name and choose the Send message platform: Weixin Robot, Enterprise WeChat App, DingDing Robot or FeiShu Robot; then choose the specific robot or app. If there is no account yet, click Create a robot.
Complete the three steps on the right:
Binding Resource: choose the resource that provides the message's data, such as an answer in a pinboard;
Trigger Condition: set when, or under what condition, the message is sent;
Send Message: edit the text of the message.
Click Next to move through the steps and save the task at the end. The task appears in the list with its sending platform, creator, update time and status.
Figure 8-5. Create a Scheduled Send task
8.3Create a scheduled push task
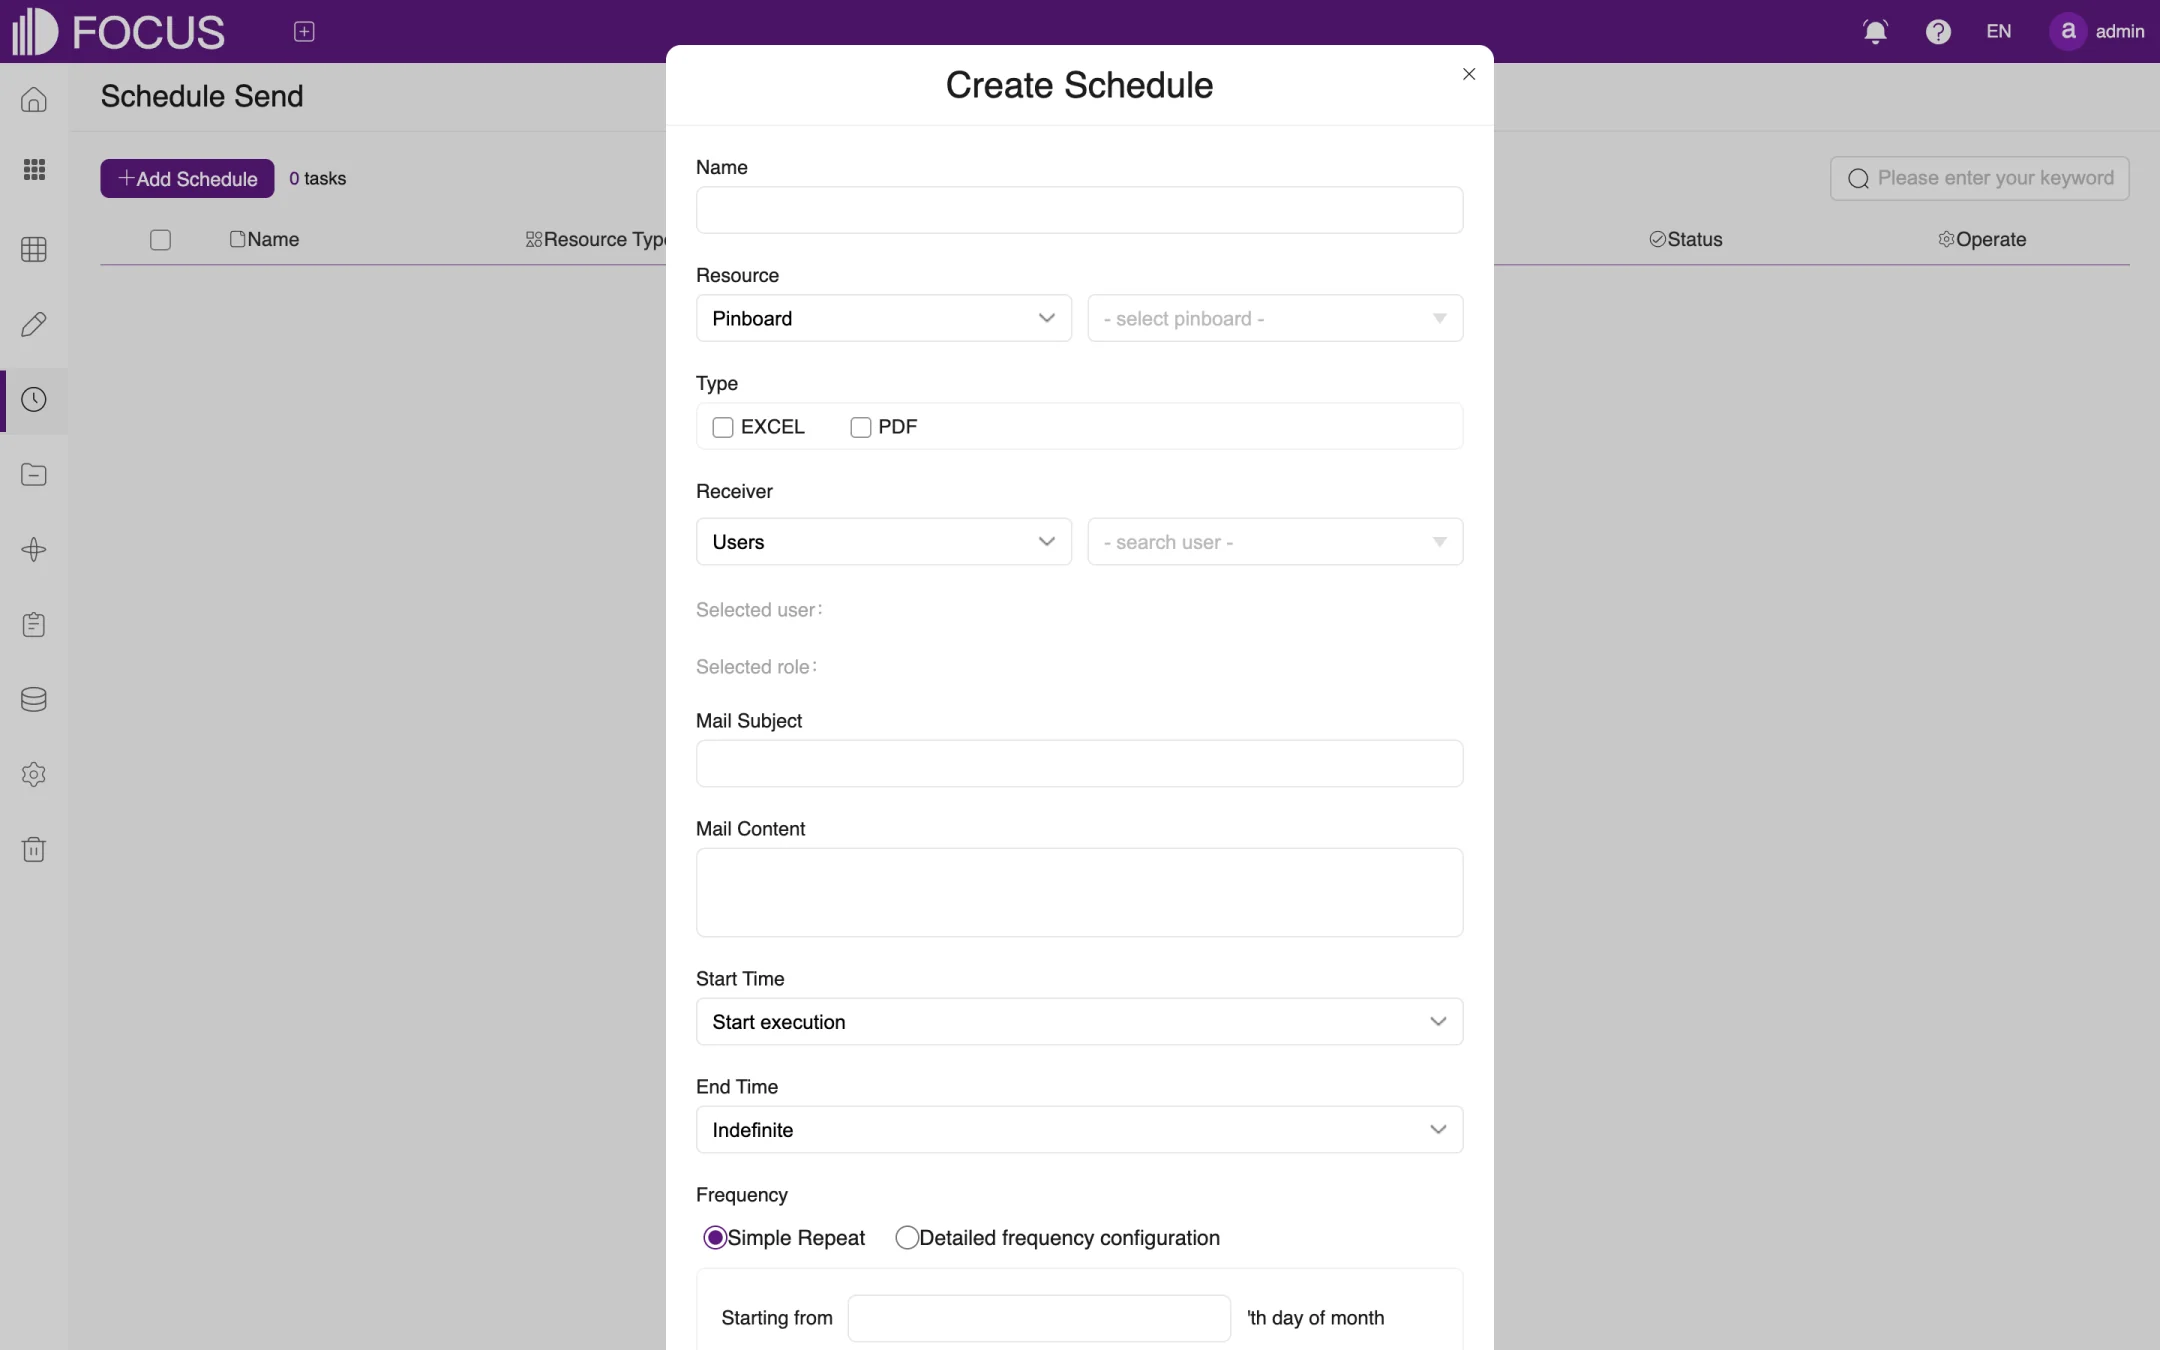
On the Scheduled Push tab, click Add Schedule to open the Create Schedule dialog, as shown in Figure 8-6.
Enter the task Name.
Resource: choose the type of content to push (such as Pinboard) and the specific item.
Type: check the attachment format, EXCEL and/or PDF.
Receiver: choose the recipients by user or by role. The users and roles you choose are listed below (Selected user, Selected role).
Enter the Mail Subject and Mail Content.
Set the Start Time (such as Start execution, which starts as soon as the task is set up) and the End Time (such as Indefinite).
Set the Frequency:
Simple Repeat: run once every N minutes (1–59), N hours (1–23) or N days (1–30);
Detailed frequency configuration: specify the day of the month to start from and the time (hour, minute and second) to run.
If needed, set Failed to retry (whether to retry after a failure), then click Submit.
Figure 8-6. Create a Scheduled Push task
Note: Scheduled Push sends email, so first make sure an administrator has enabled and configured the mail system under Admin > Configure.
Chapter 9Resources
The Resource module uses projects to organize answers, pinboards, data applications and tables. You can set up projects by department or business topic so that related resources are kept together and are easier to find and share. Projects can also contain subprojects.
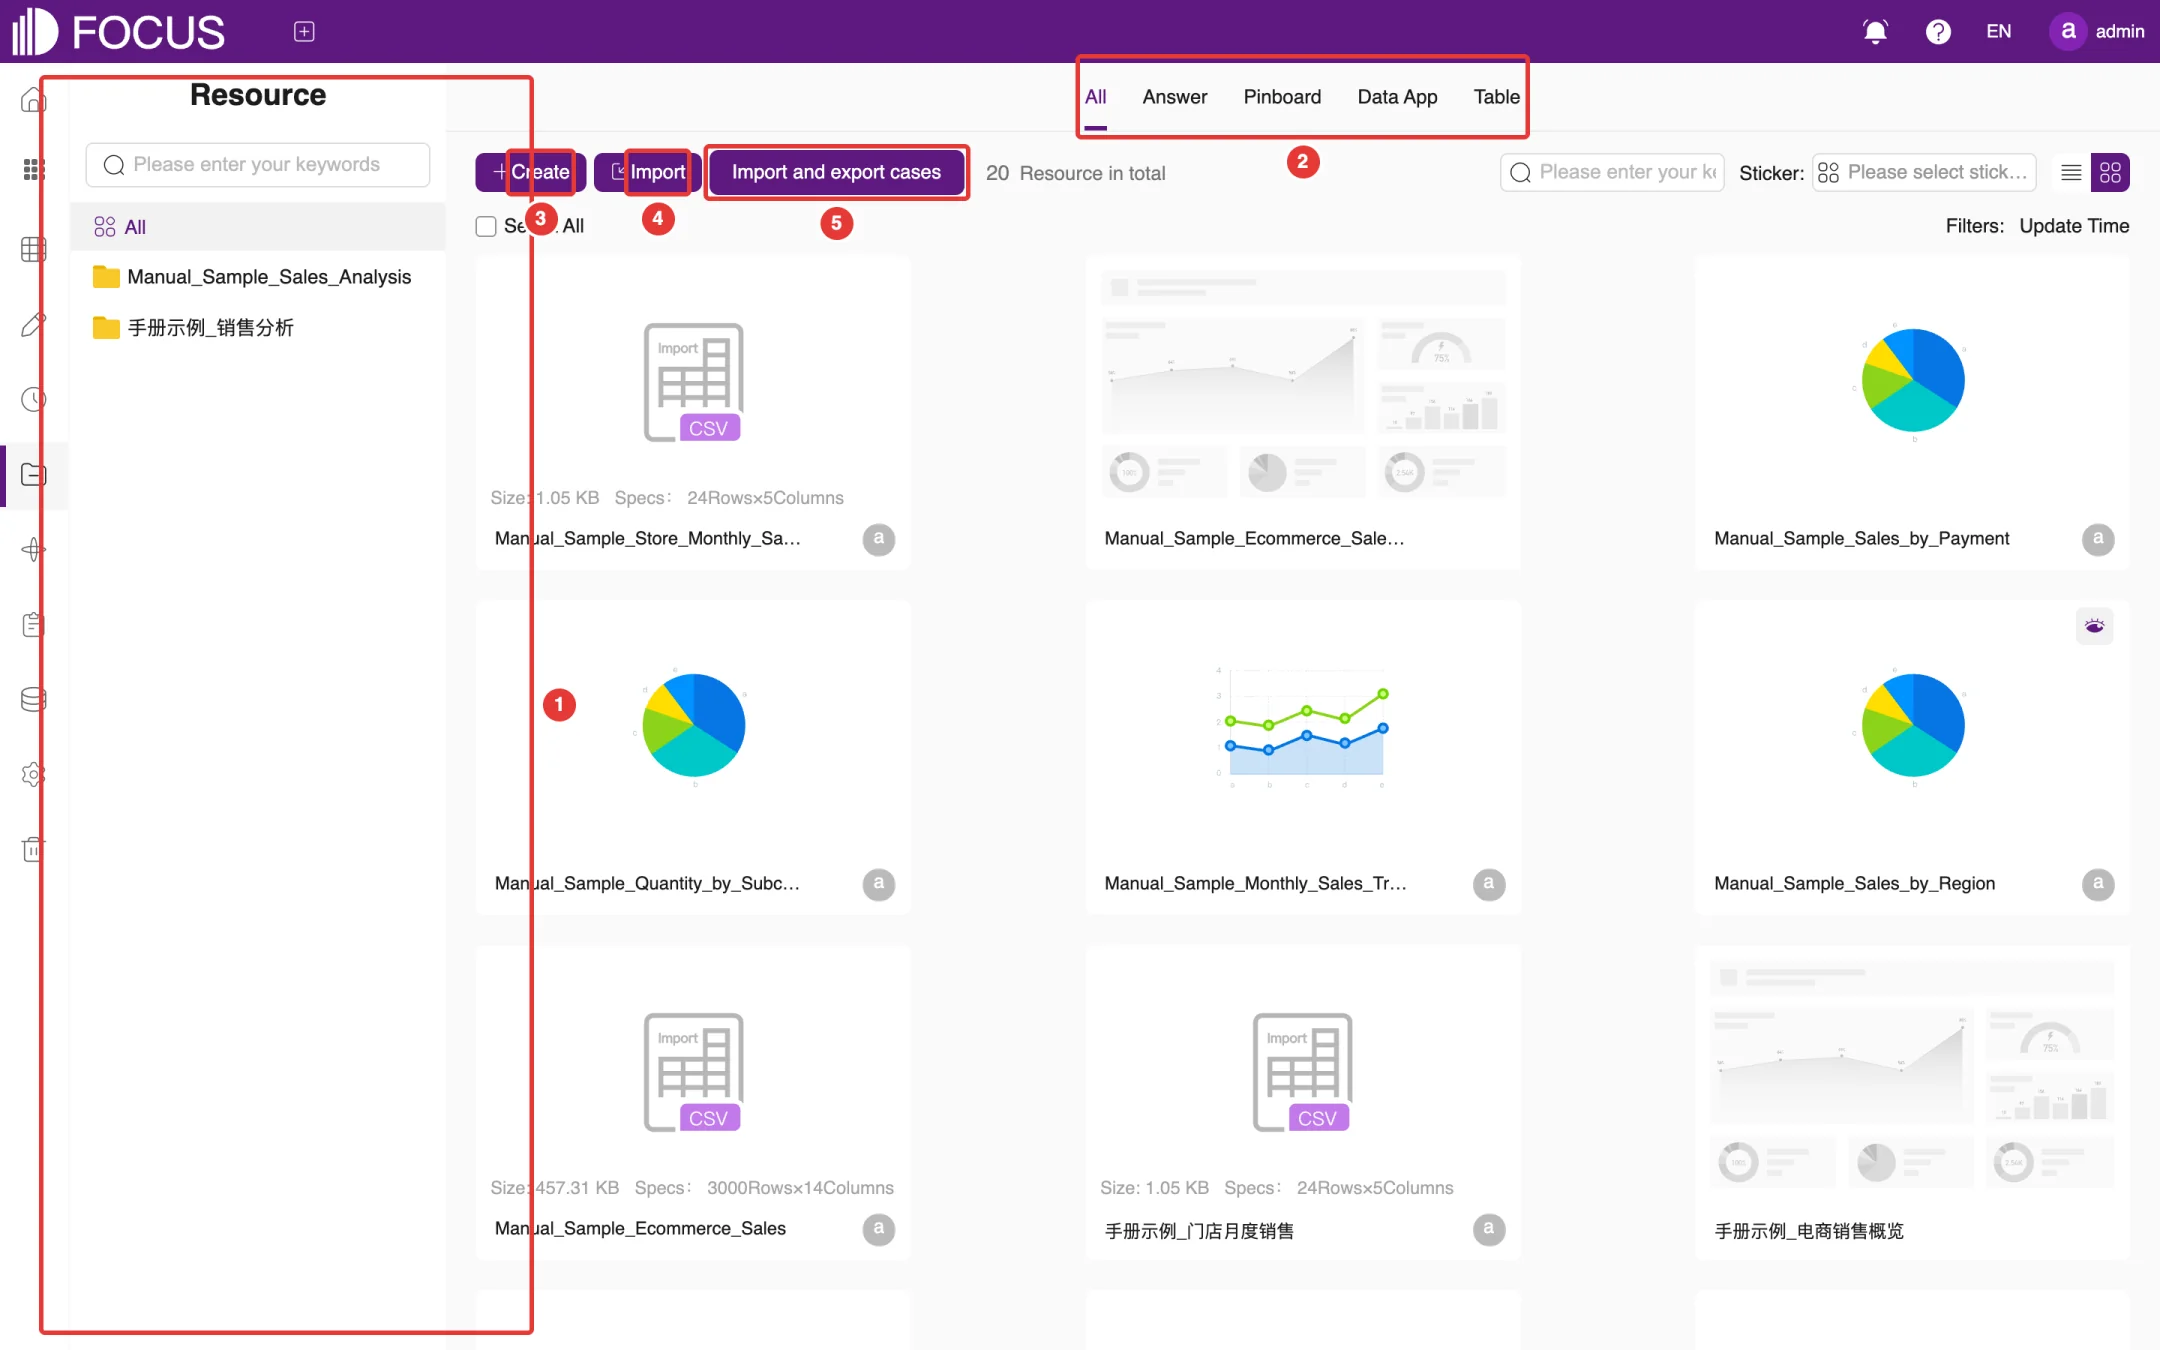
Click Resource in the left menu bar to open this module.
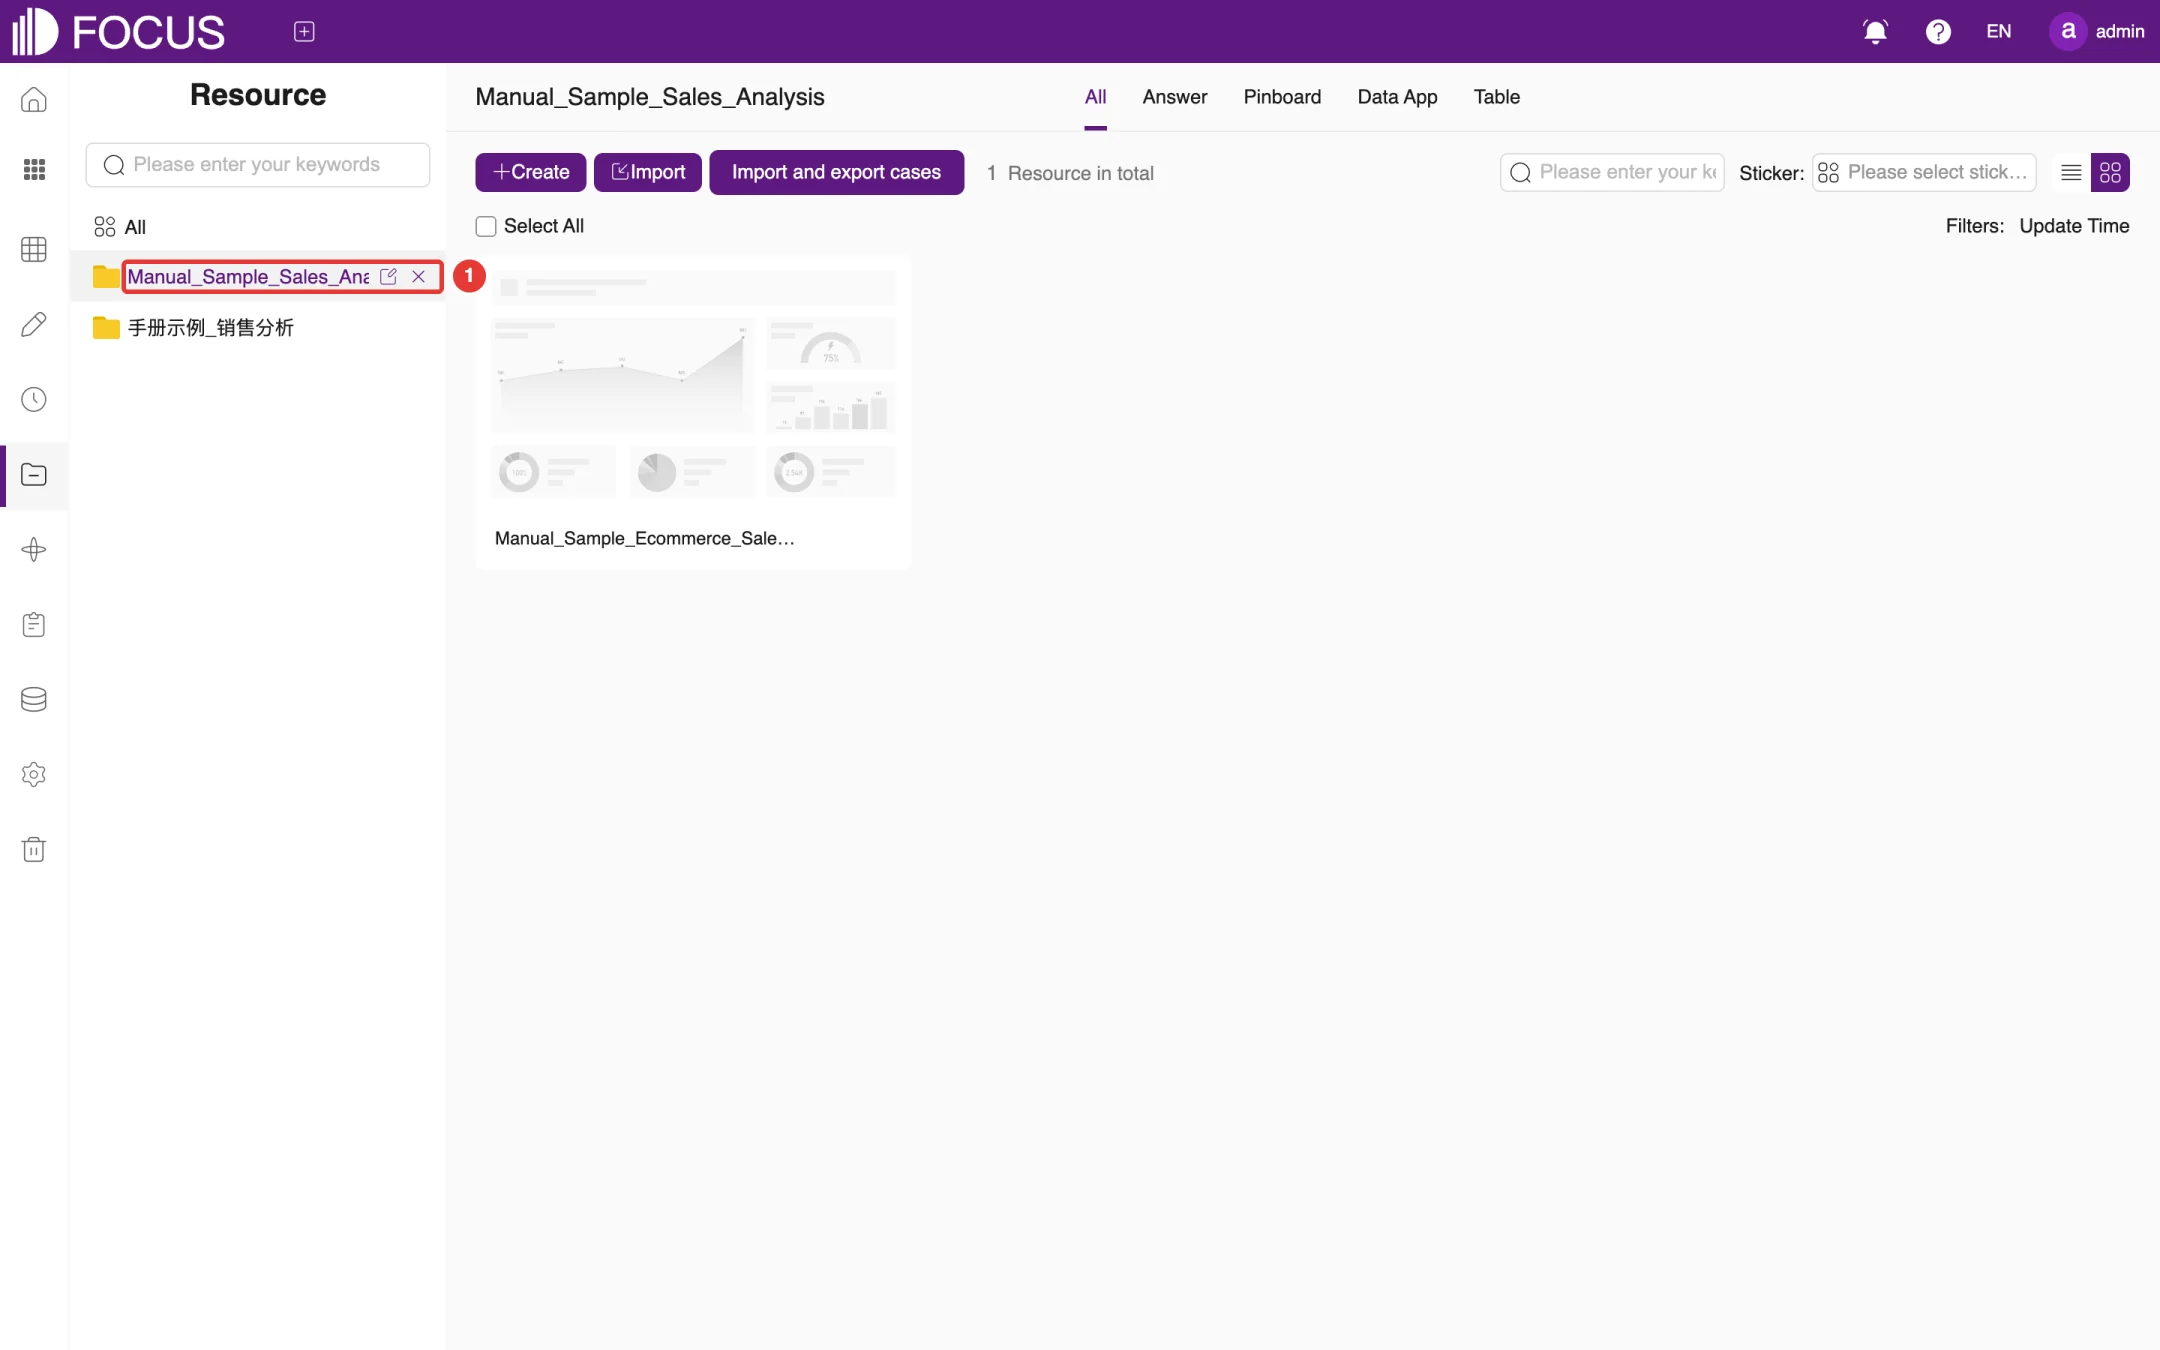
① Project bar: a search box at the top. All shows every resource, and the projects you have created are listed below it; click a project name to show only the resources in that project.
② Resource type tabs: All, Answer, Pinboard, Data App and Table.
③ Create: creates a project or a resource of any type.
④ Import: imports answer or pinboard files that were exported from this system.
⑤ Import and export cases: imports case packages provided on the official website; see Section 9.5.
Figure 9-1. The Resource page
Resource cards work the same way as answer cards; see Chapter 4.
9.2Creating a project
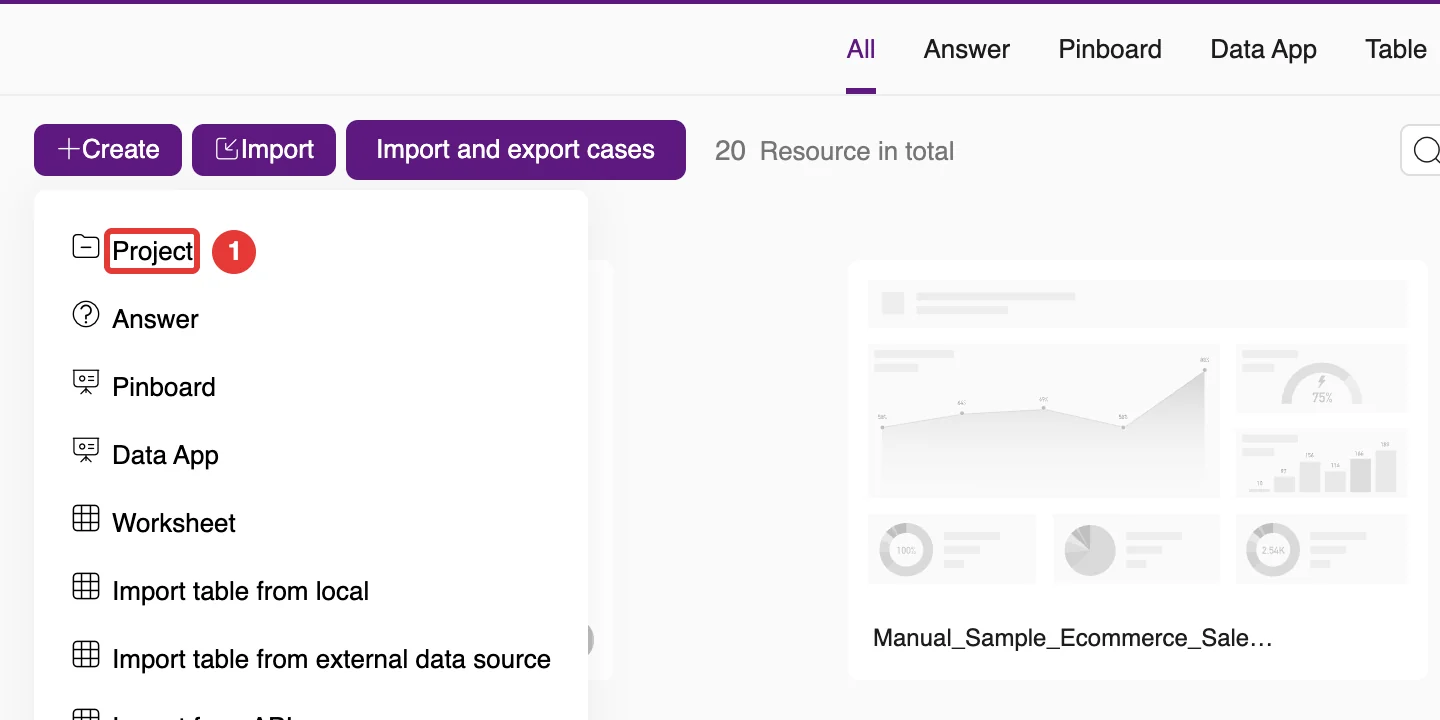
Click Create and choose Project at ① in the drop-down menu, as shown in Figure 9-2. The other menu items create an Answer, Pinboard, Data App or Worksheet directly, or import a table (Import table from local, Import table from external data source and so on).
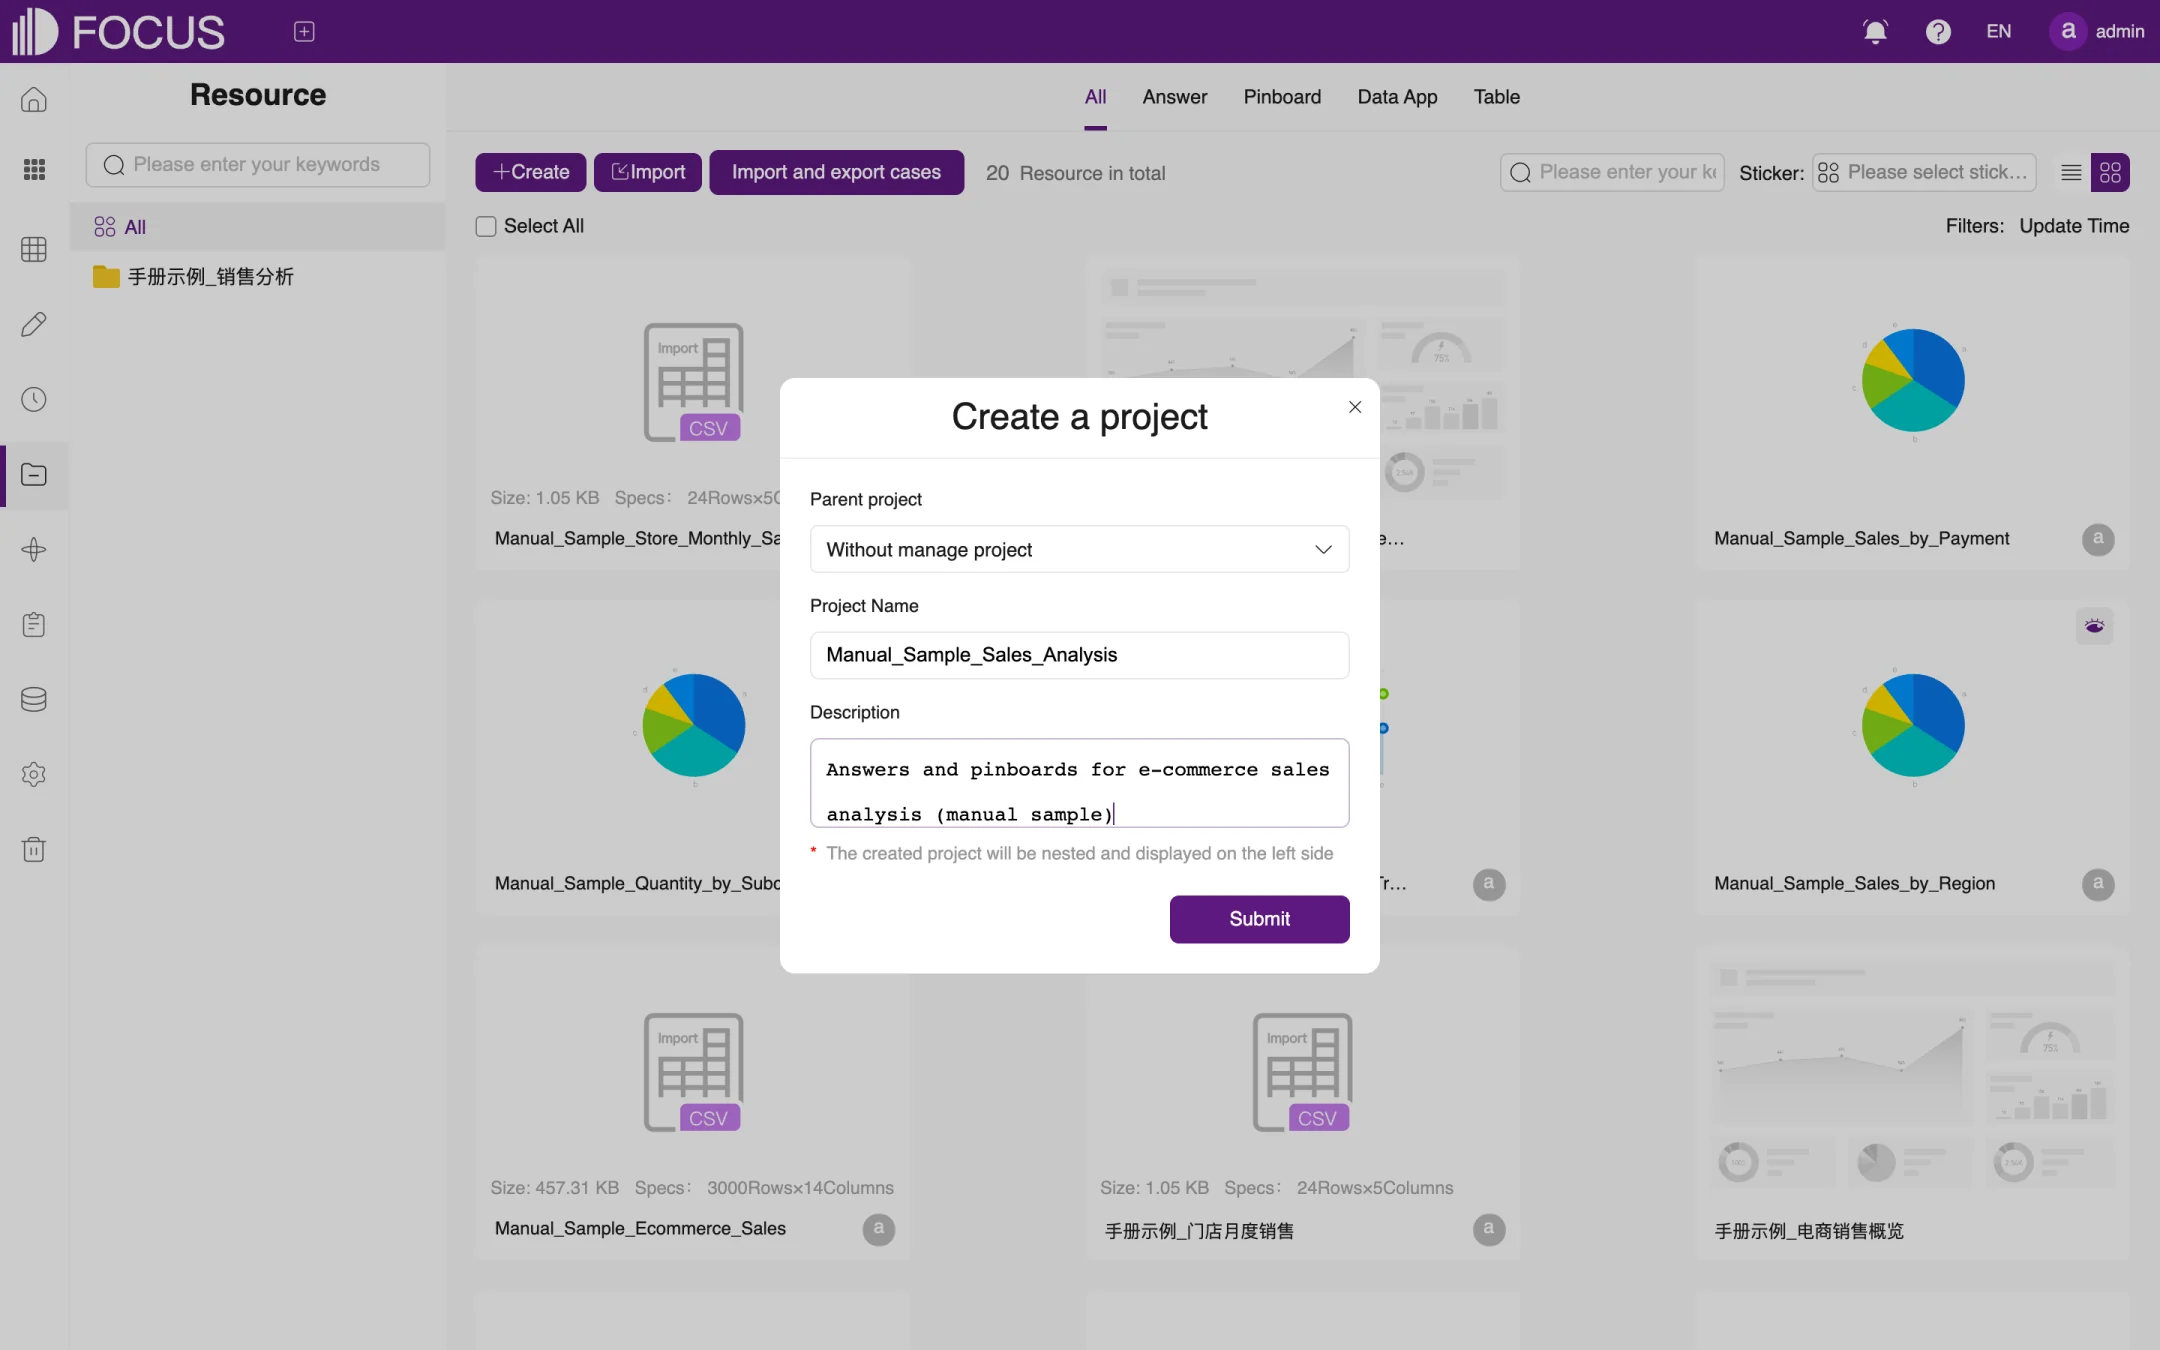
In the Create a project dialog, choose a Parent project (keep Without manage project for a top-level project), and enter the Project Name, for example Manual_Sample_Sales_Analysis, and a Description, as shown in Figure 9-3.
Click Submit. The new project appears in the project bar on the left; if you chose a parent project, it is nested under that project.
Figure 9-2. The Create menuFigure 9-3. Creating a project
9.3Putting resources into a project
There are two ways to put a resource into a project:
When you save an answer, choose the project under Manage Project (see Chapter 2).
Click the Move button on an answer, pinboard or other resource card, choose the target project in the Move dialog, and click Submit.
After that, click the project name in the project bar to see the resources in the project, as shown in Figure 9-4. When you hover over a project name, icons appear to its right for editing or deleting the project.
Figure 9-4. Resources in a project
9.4Importing resources
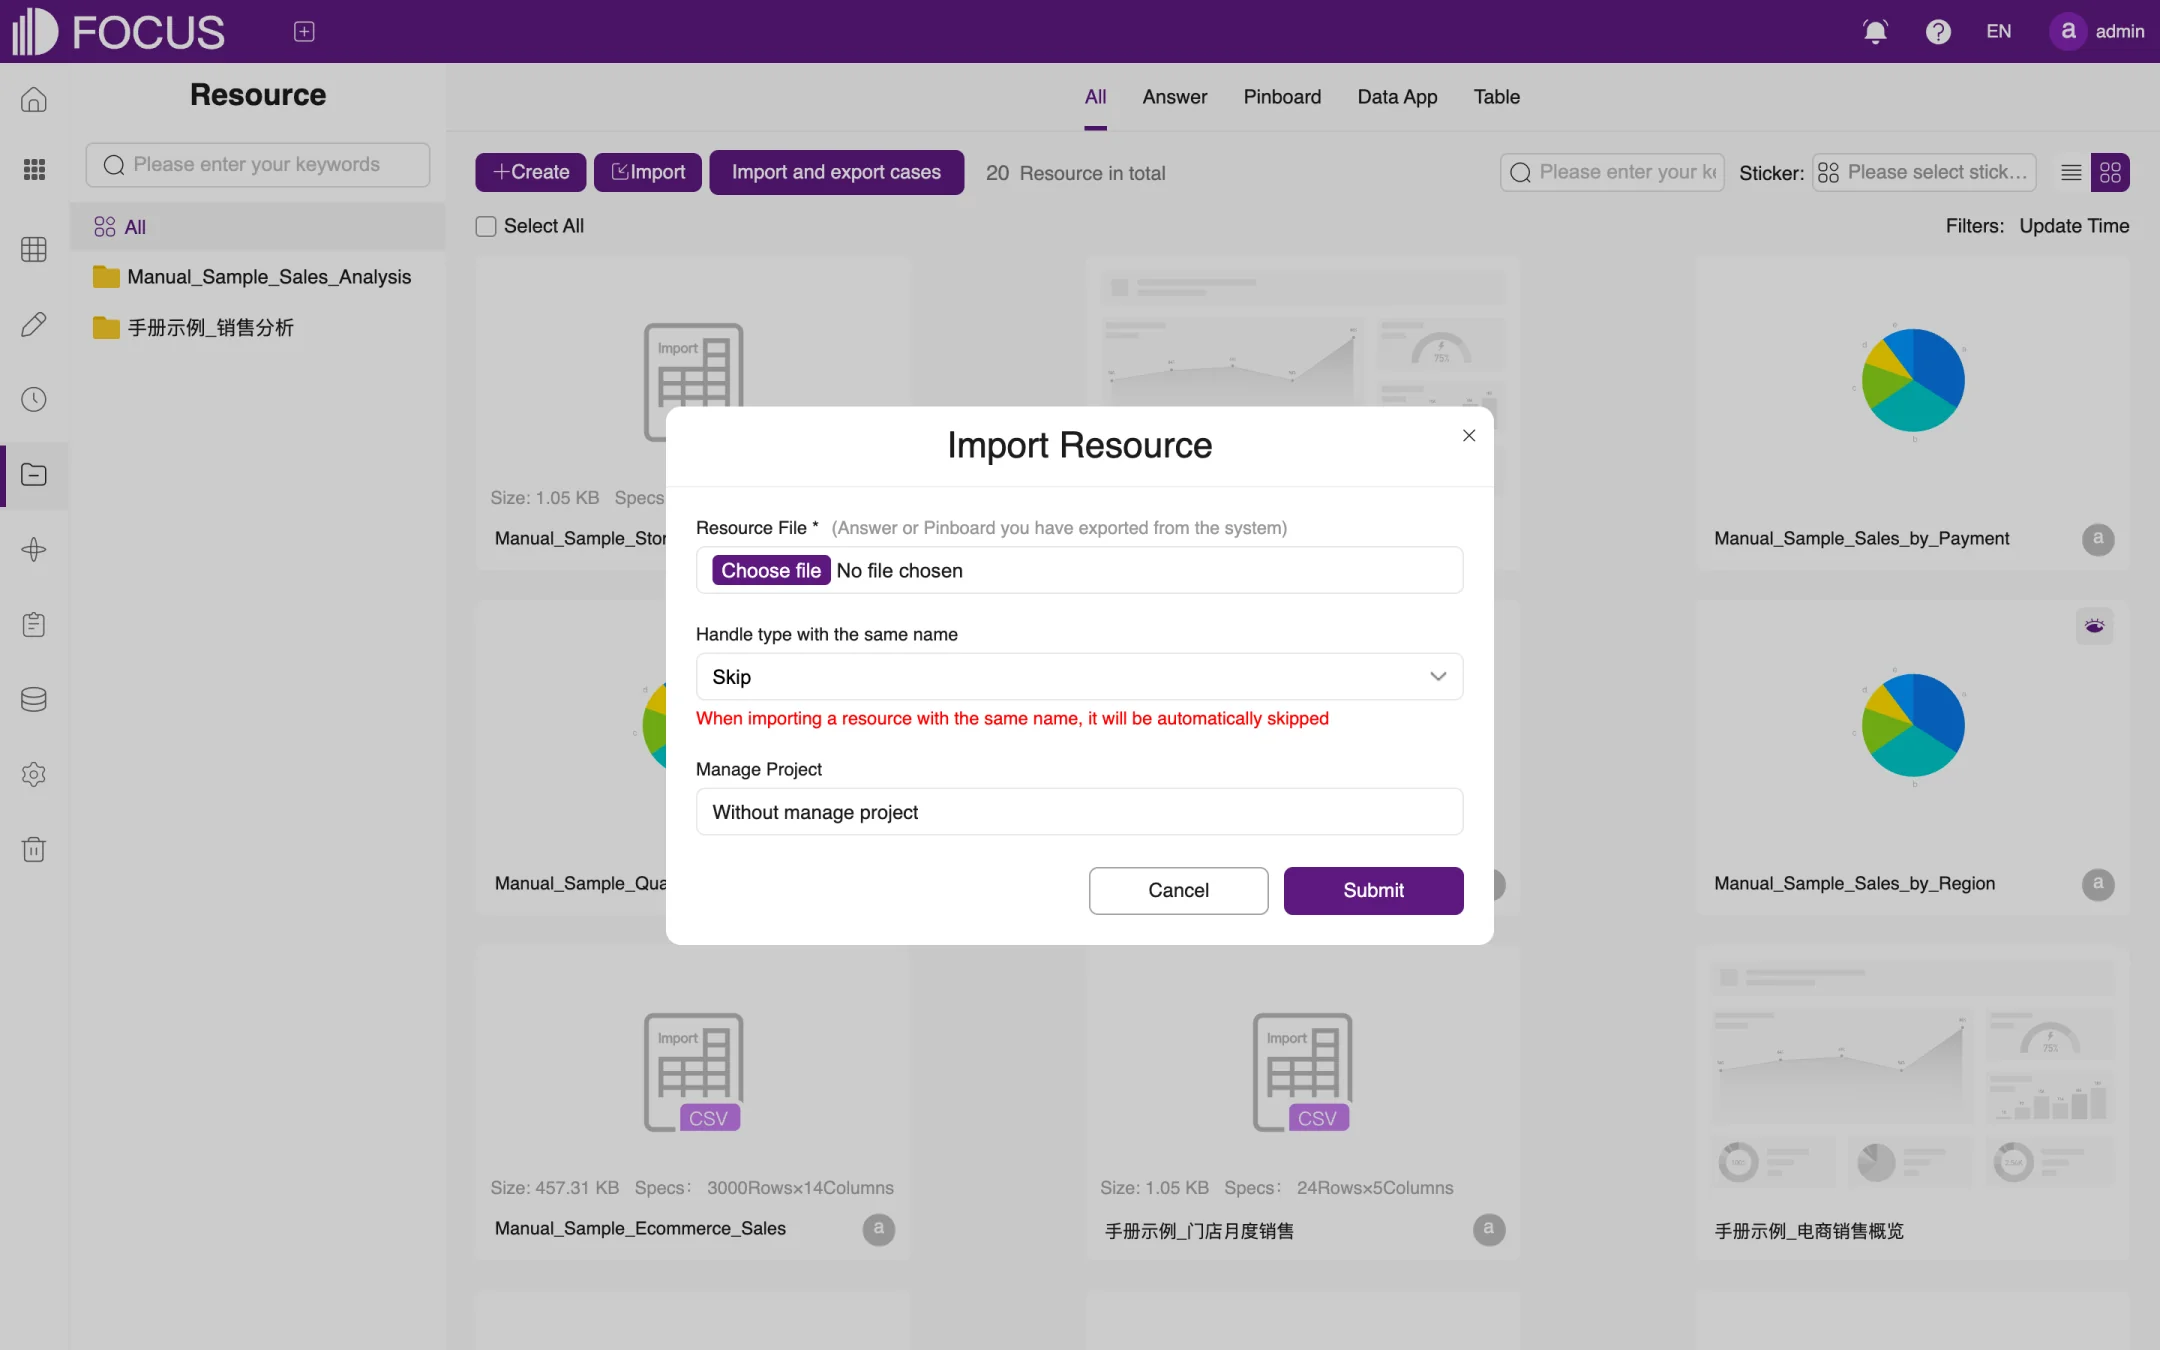
Click Import to open the Import Resource dialog, as shown in Figure 9-5:
Under Resource File, choose an answer or pinboard file that was exported from this system.
Under Handle type with the same name, choose what happens when a resource with the same name already exists, for example Skip.
Under Manage Project, choose the project to import into.
Click Submit.
Figure 9-5. Importing resources
9.5Importing and exporting cases
The OT Flash website offers case packages for a number of industries, with sample data, answers, pinboards and more. When you import a case, the system creates a separate project for it, so you can follow the case's walkthrough step by step.
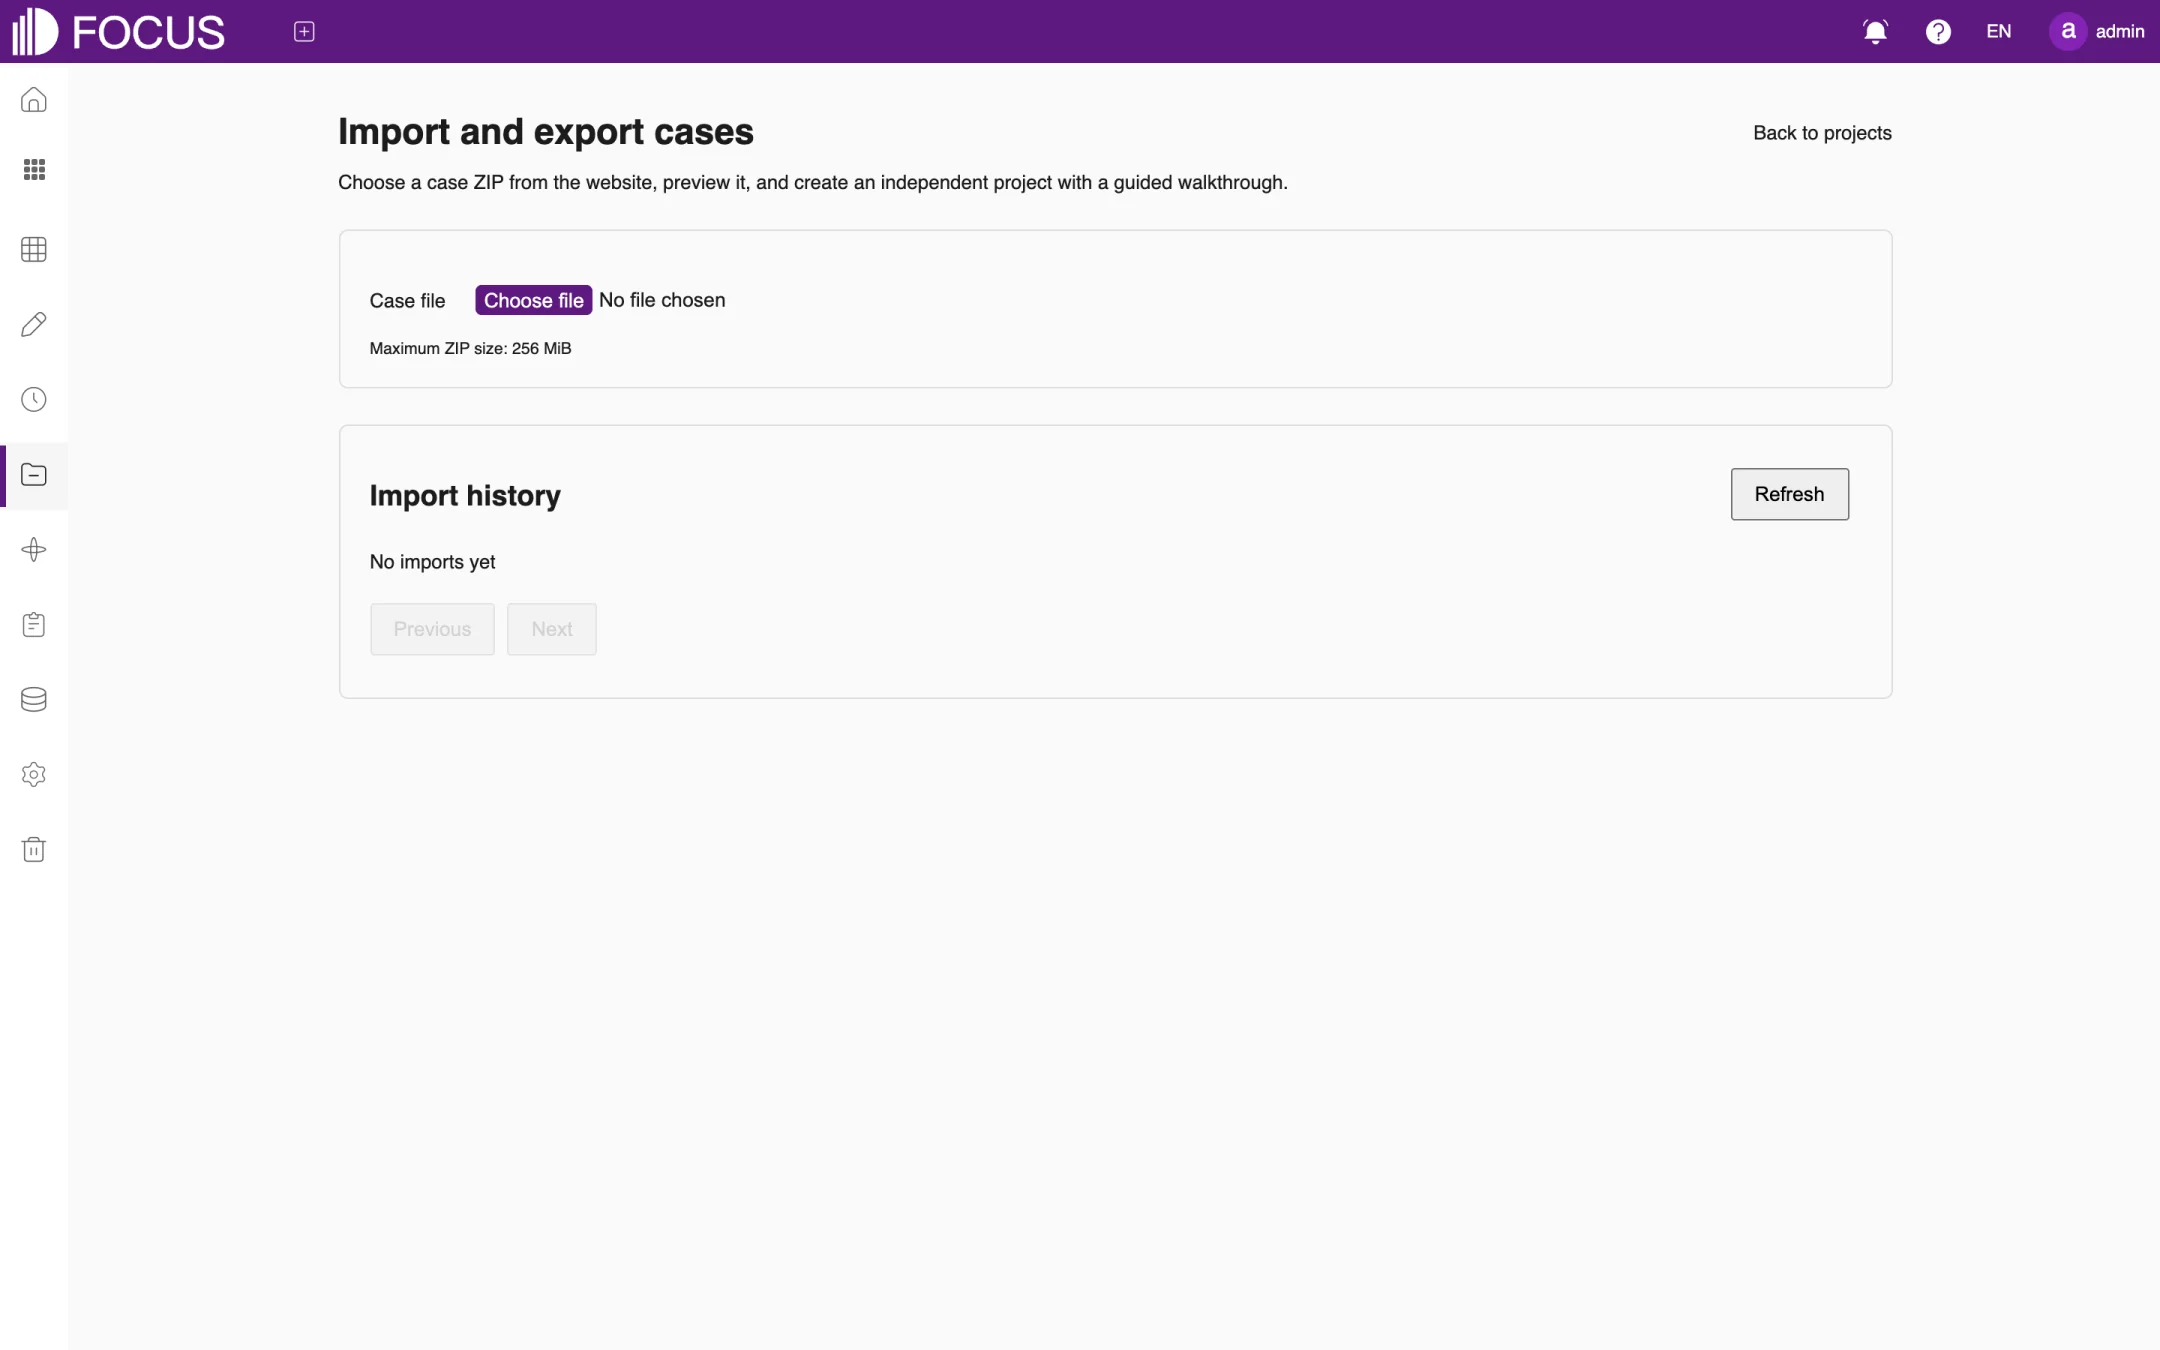
Click Import and export cases to open the case page, as shown in Figure 9-6.
Under Case file, choose the case ZIP file you downloaded from the website. The maximum ZIP size is 256 MiB.
Preview the contents of the case, then confirm the import. The system creates a separate project for the case.
Import history below shows the status of each import and export; click Refresh to update it.
Click Back to projects at the top right to return to the Resource page.
Figure 9-6. Importing and exporting cases
Chapter 10Ontology
An ontology is a knowledge space organized around one business topic. It brings together the related tables, business documents, indicators and pinboards, and comes with an ontology agent: when you ask it a question in plain language, the agent answers from the ontology's data and documents and can also call executions to run an analysis or write results back.
This chapter uses the preset ontology 闭环Demo-采购审批流程挖掘与优化 (closed-loop demo – purchase approval process mining and optimization) as its example. It is built-in demo content, so its names, tables, documents and control panel appear in Chinese even in the English UI. Click Ontology in the left menu to open this module.
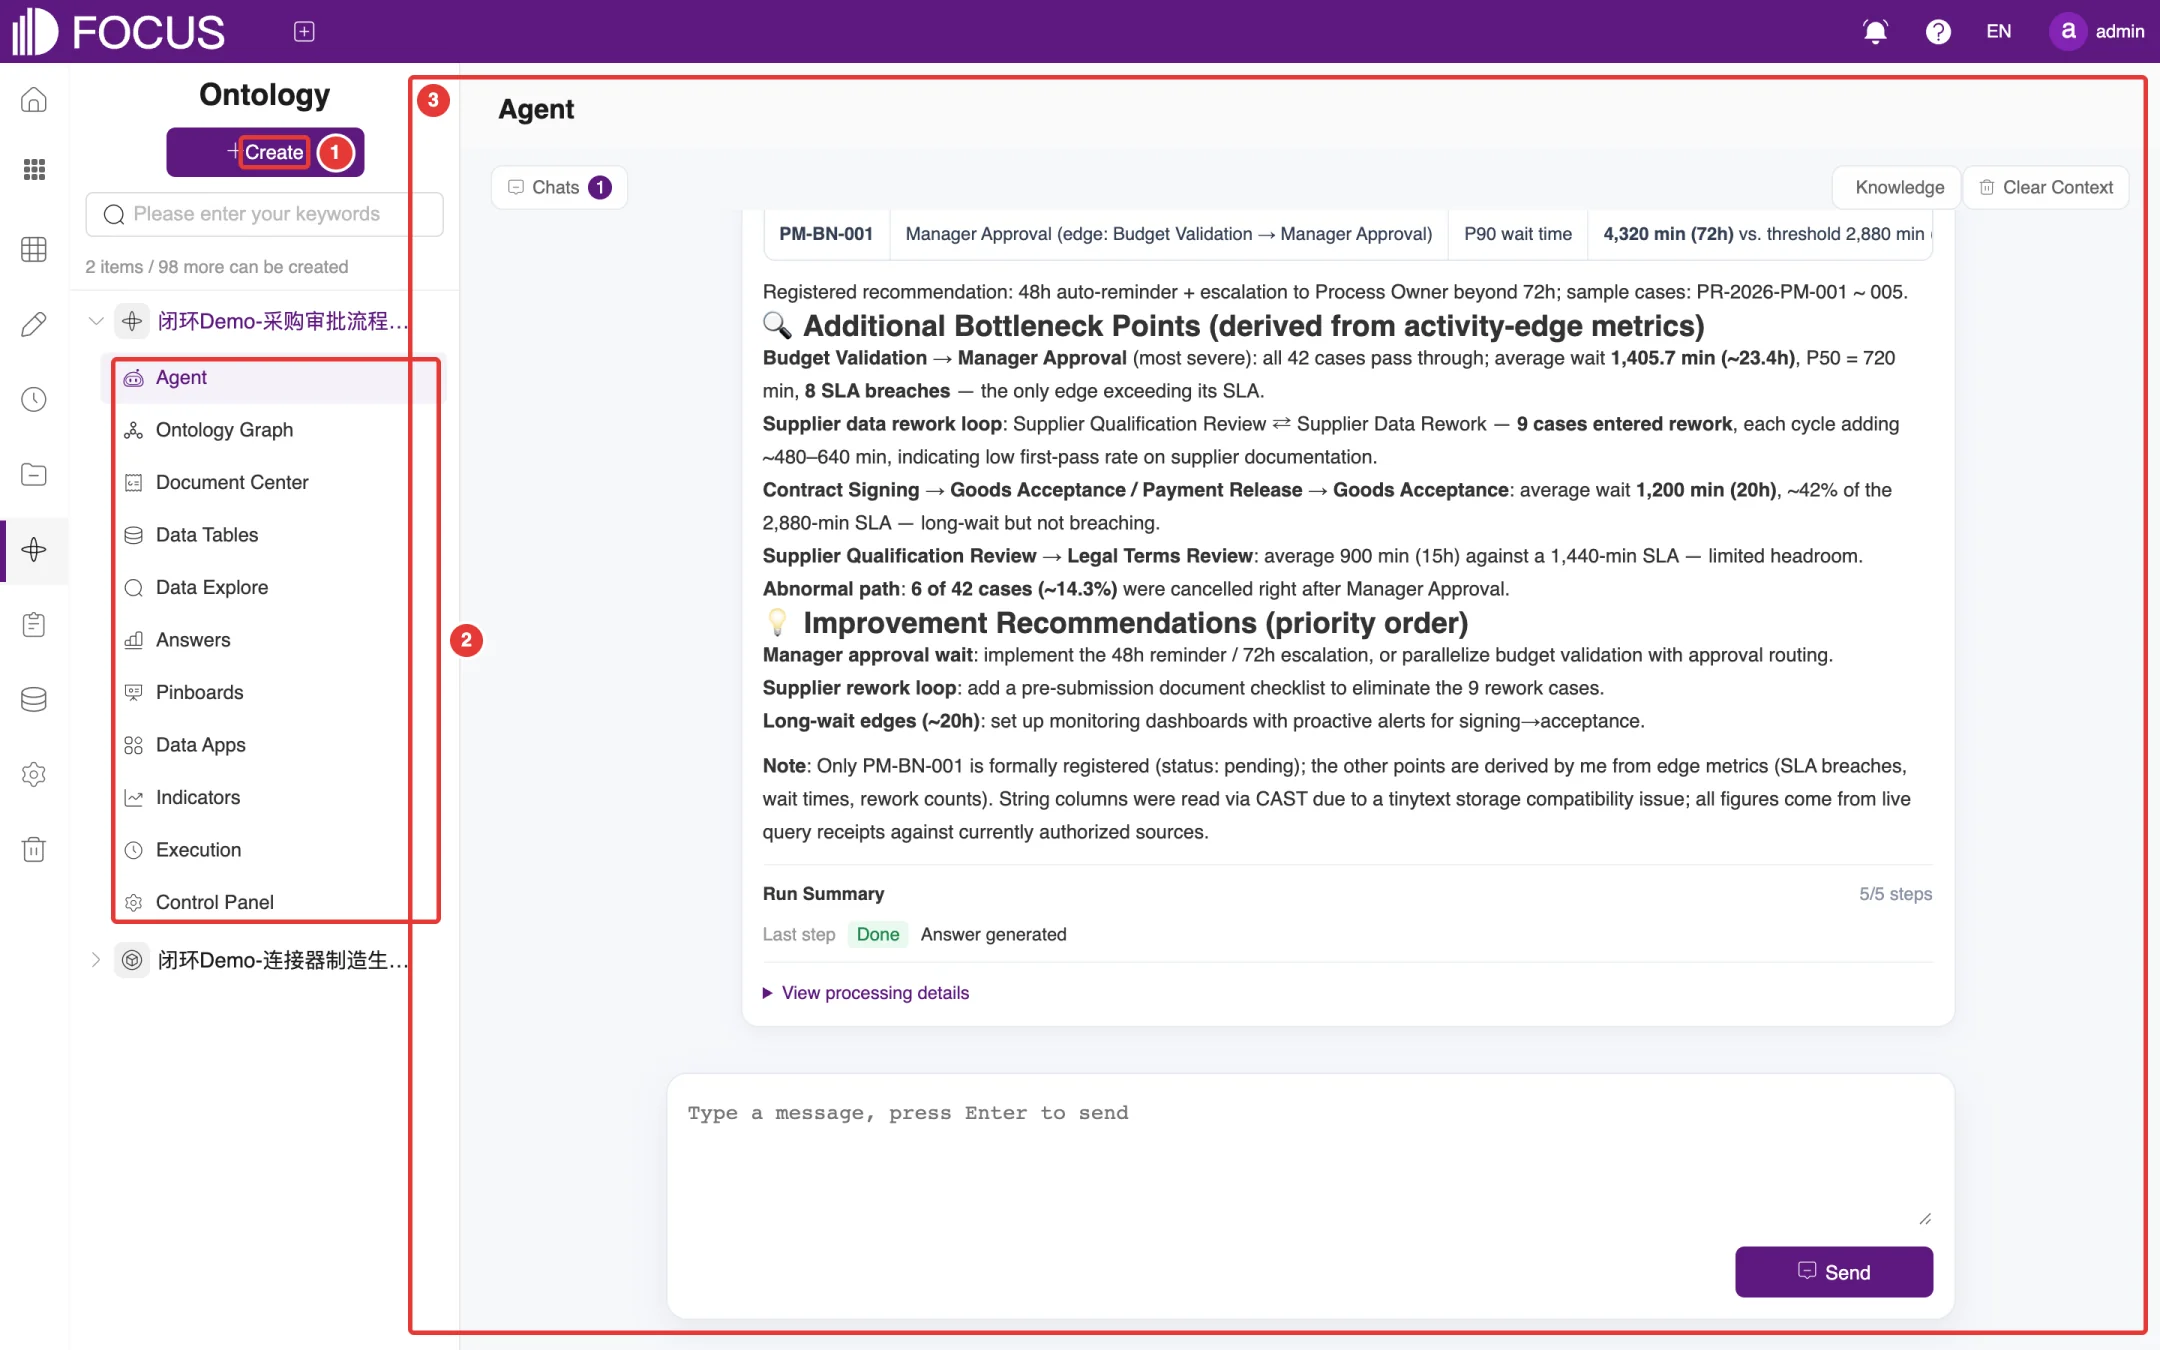
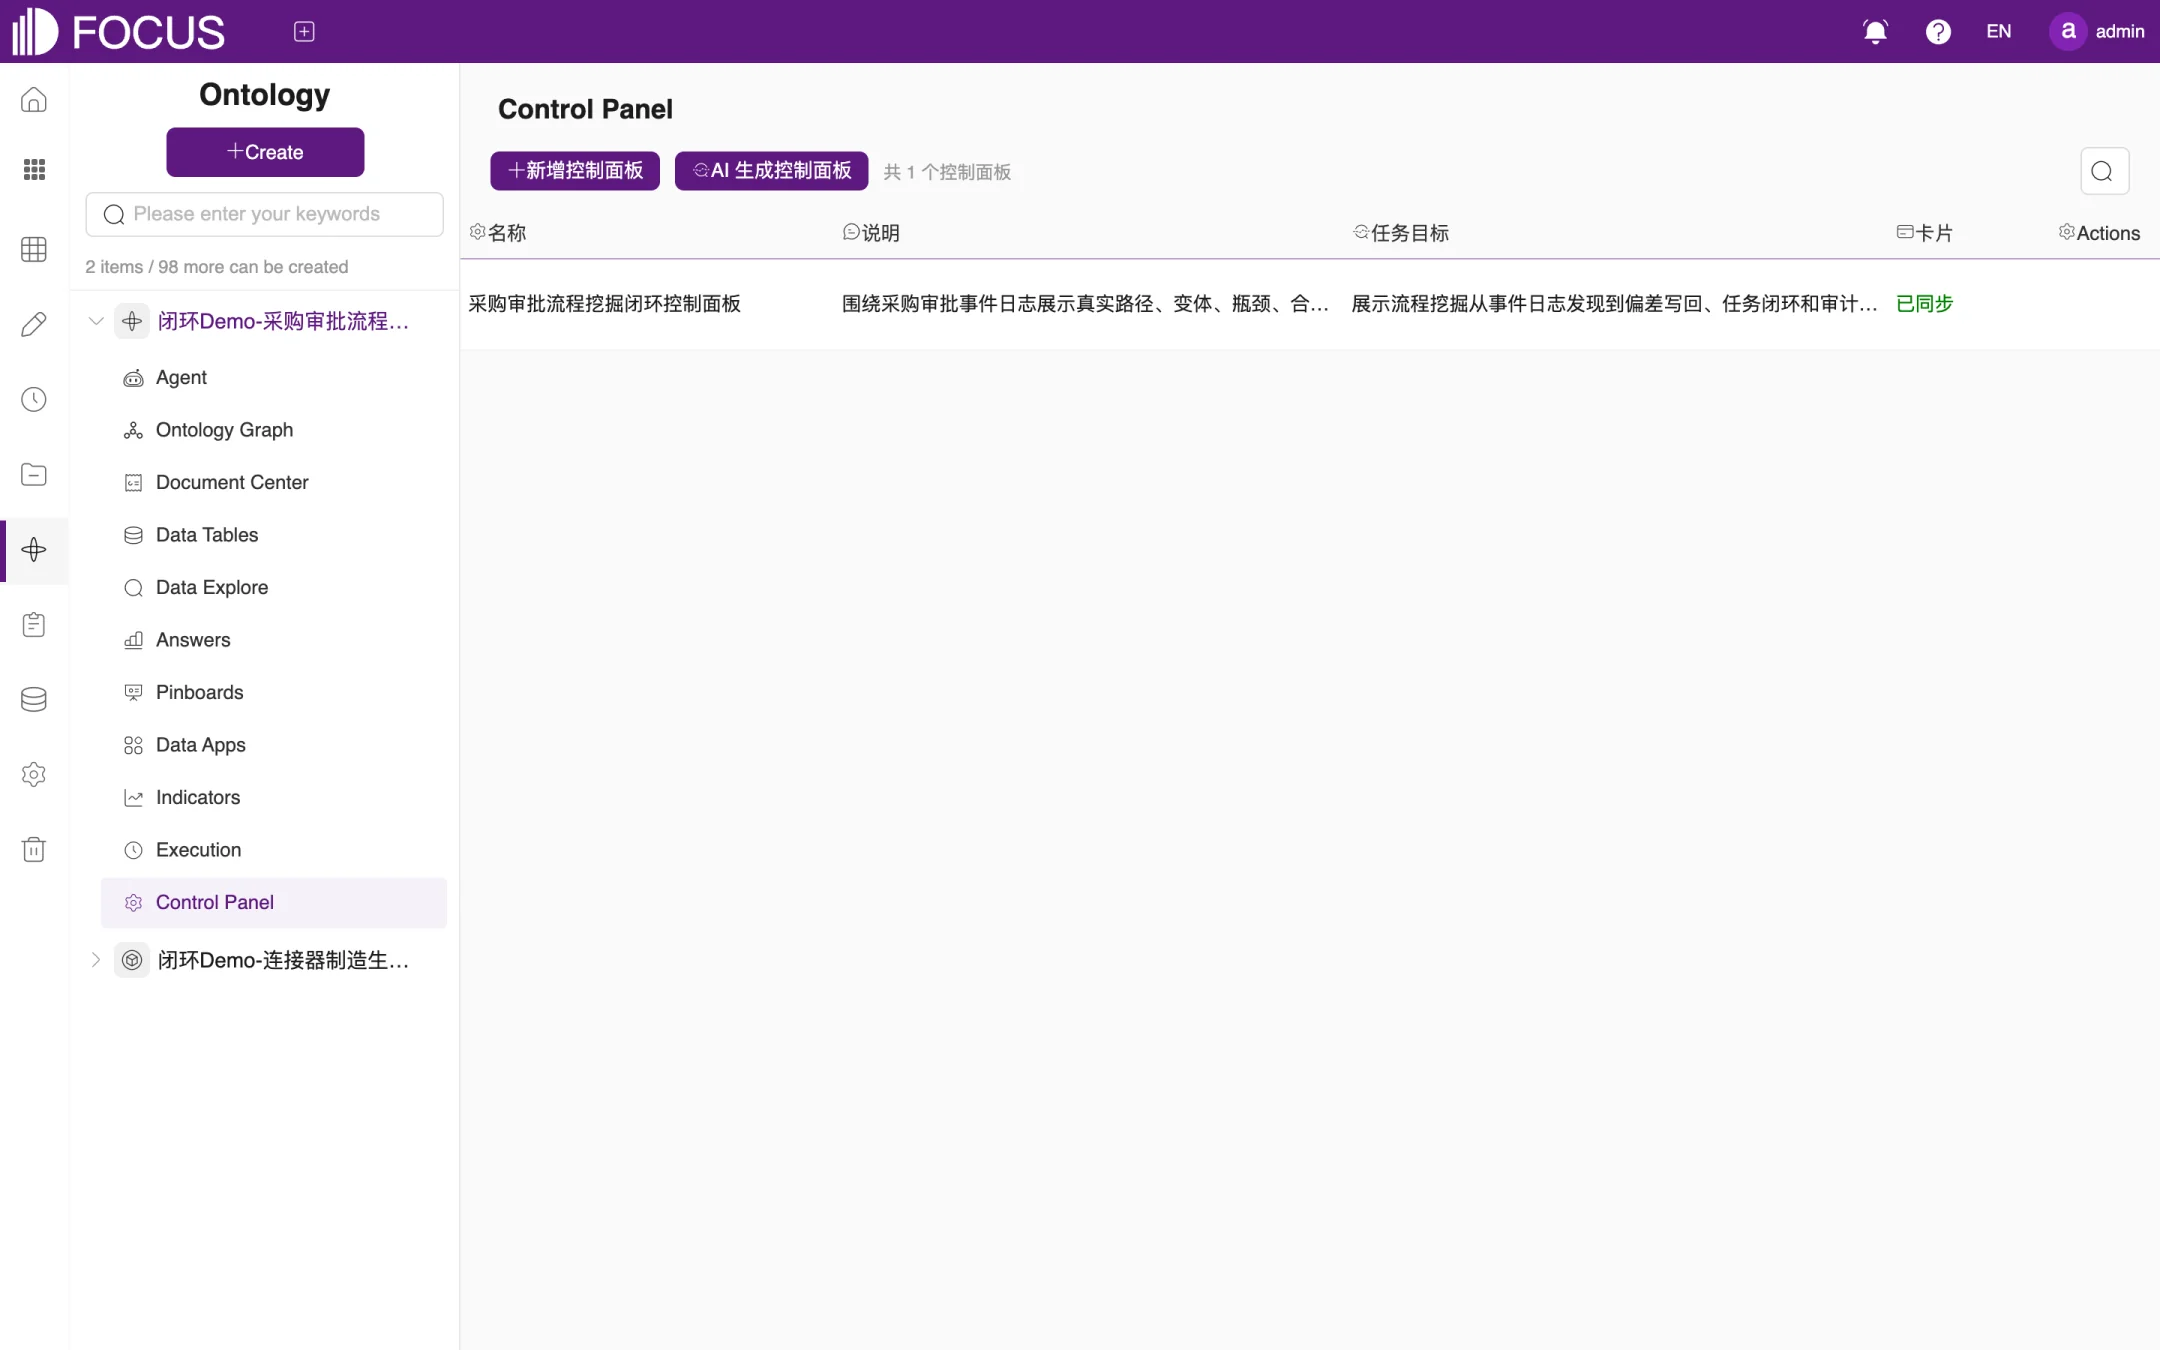
① Create: creates a new ontology. The line under the search box shows how many ontologies exist and how many more can be created (here "2 items / 98 more can be created").
② Ontologies and modules: the left panel lists all ontologies. Expand an ontology to see its 11 modules: Agent, Ontology Graph, Document Center, Data Tables, Data Explore, Answers, Pinboards, Data Apps, Indicators, Execution and Control Panel.
③ Work area: shows the content of the selected module.
Figure 10-1. Ontology
10.2Create an ontology
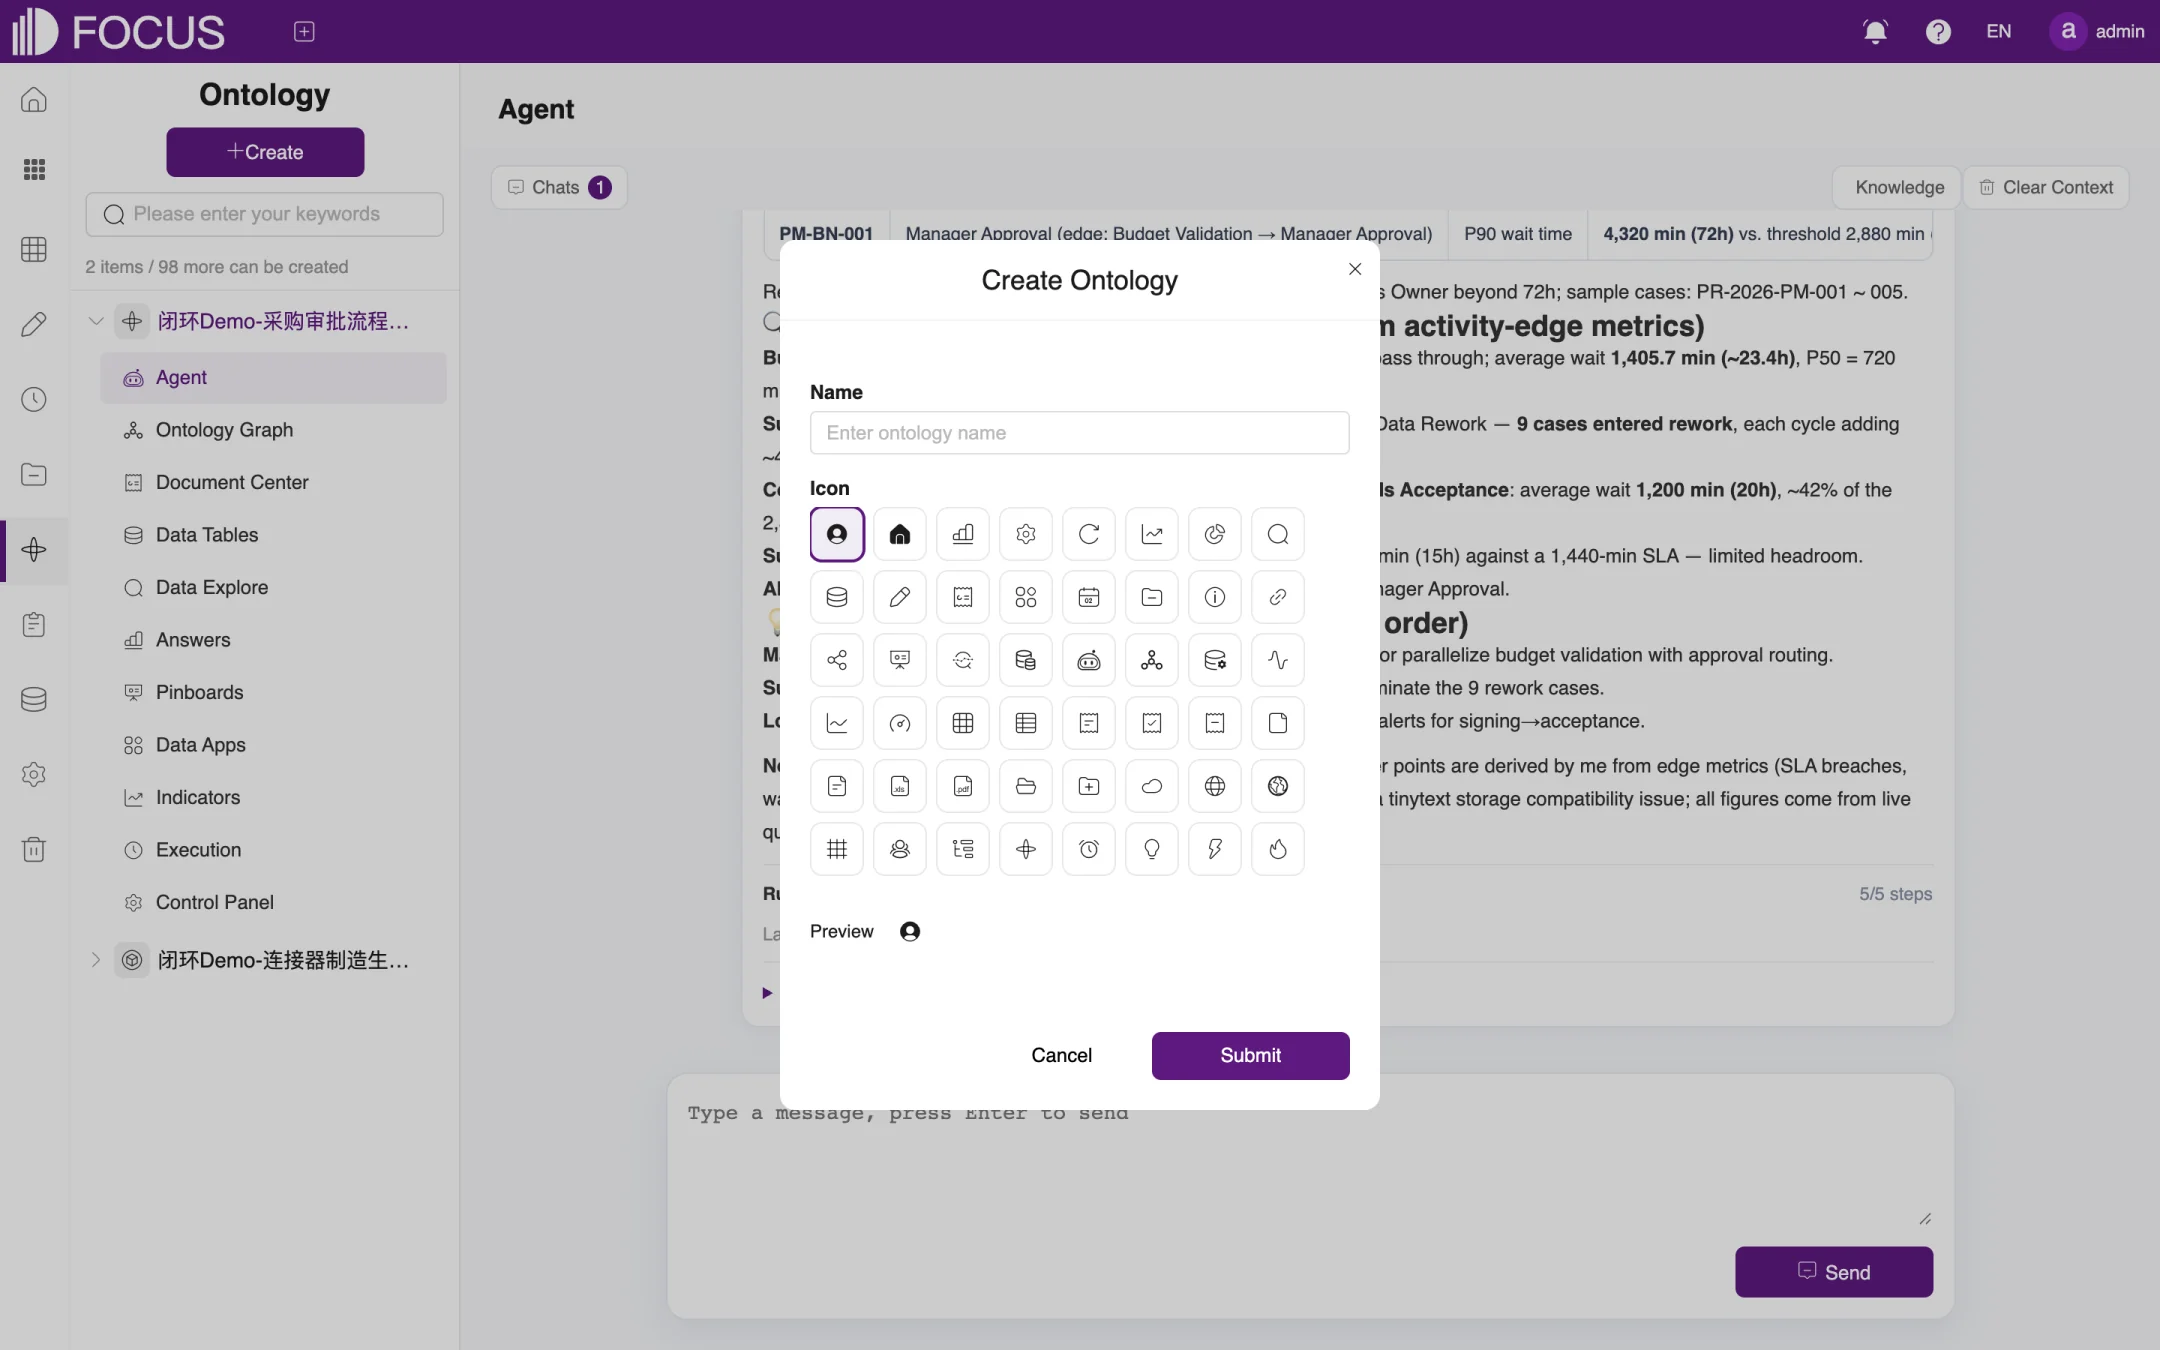
Click Create to open the Create Ontology window, as shown in Figure 10-2.
Enter the ontology Name and choose an icon under Icon. Preview shows how it will look.
Click Submit. The new ontology appears in the list on the left.
Import the related tables in the Data Tables module and upload business documents in Document Center. You can then start using the agent.
Figure 10-2. Create an ontology
10.3Agent
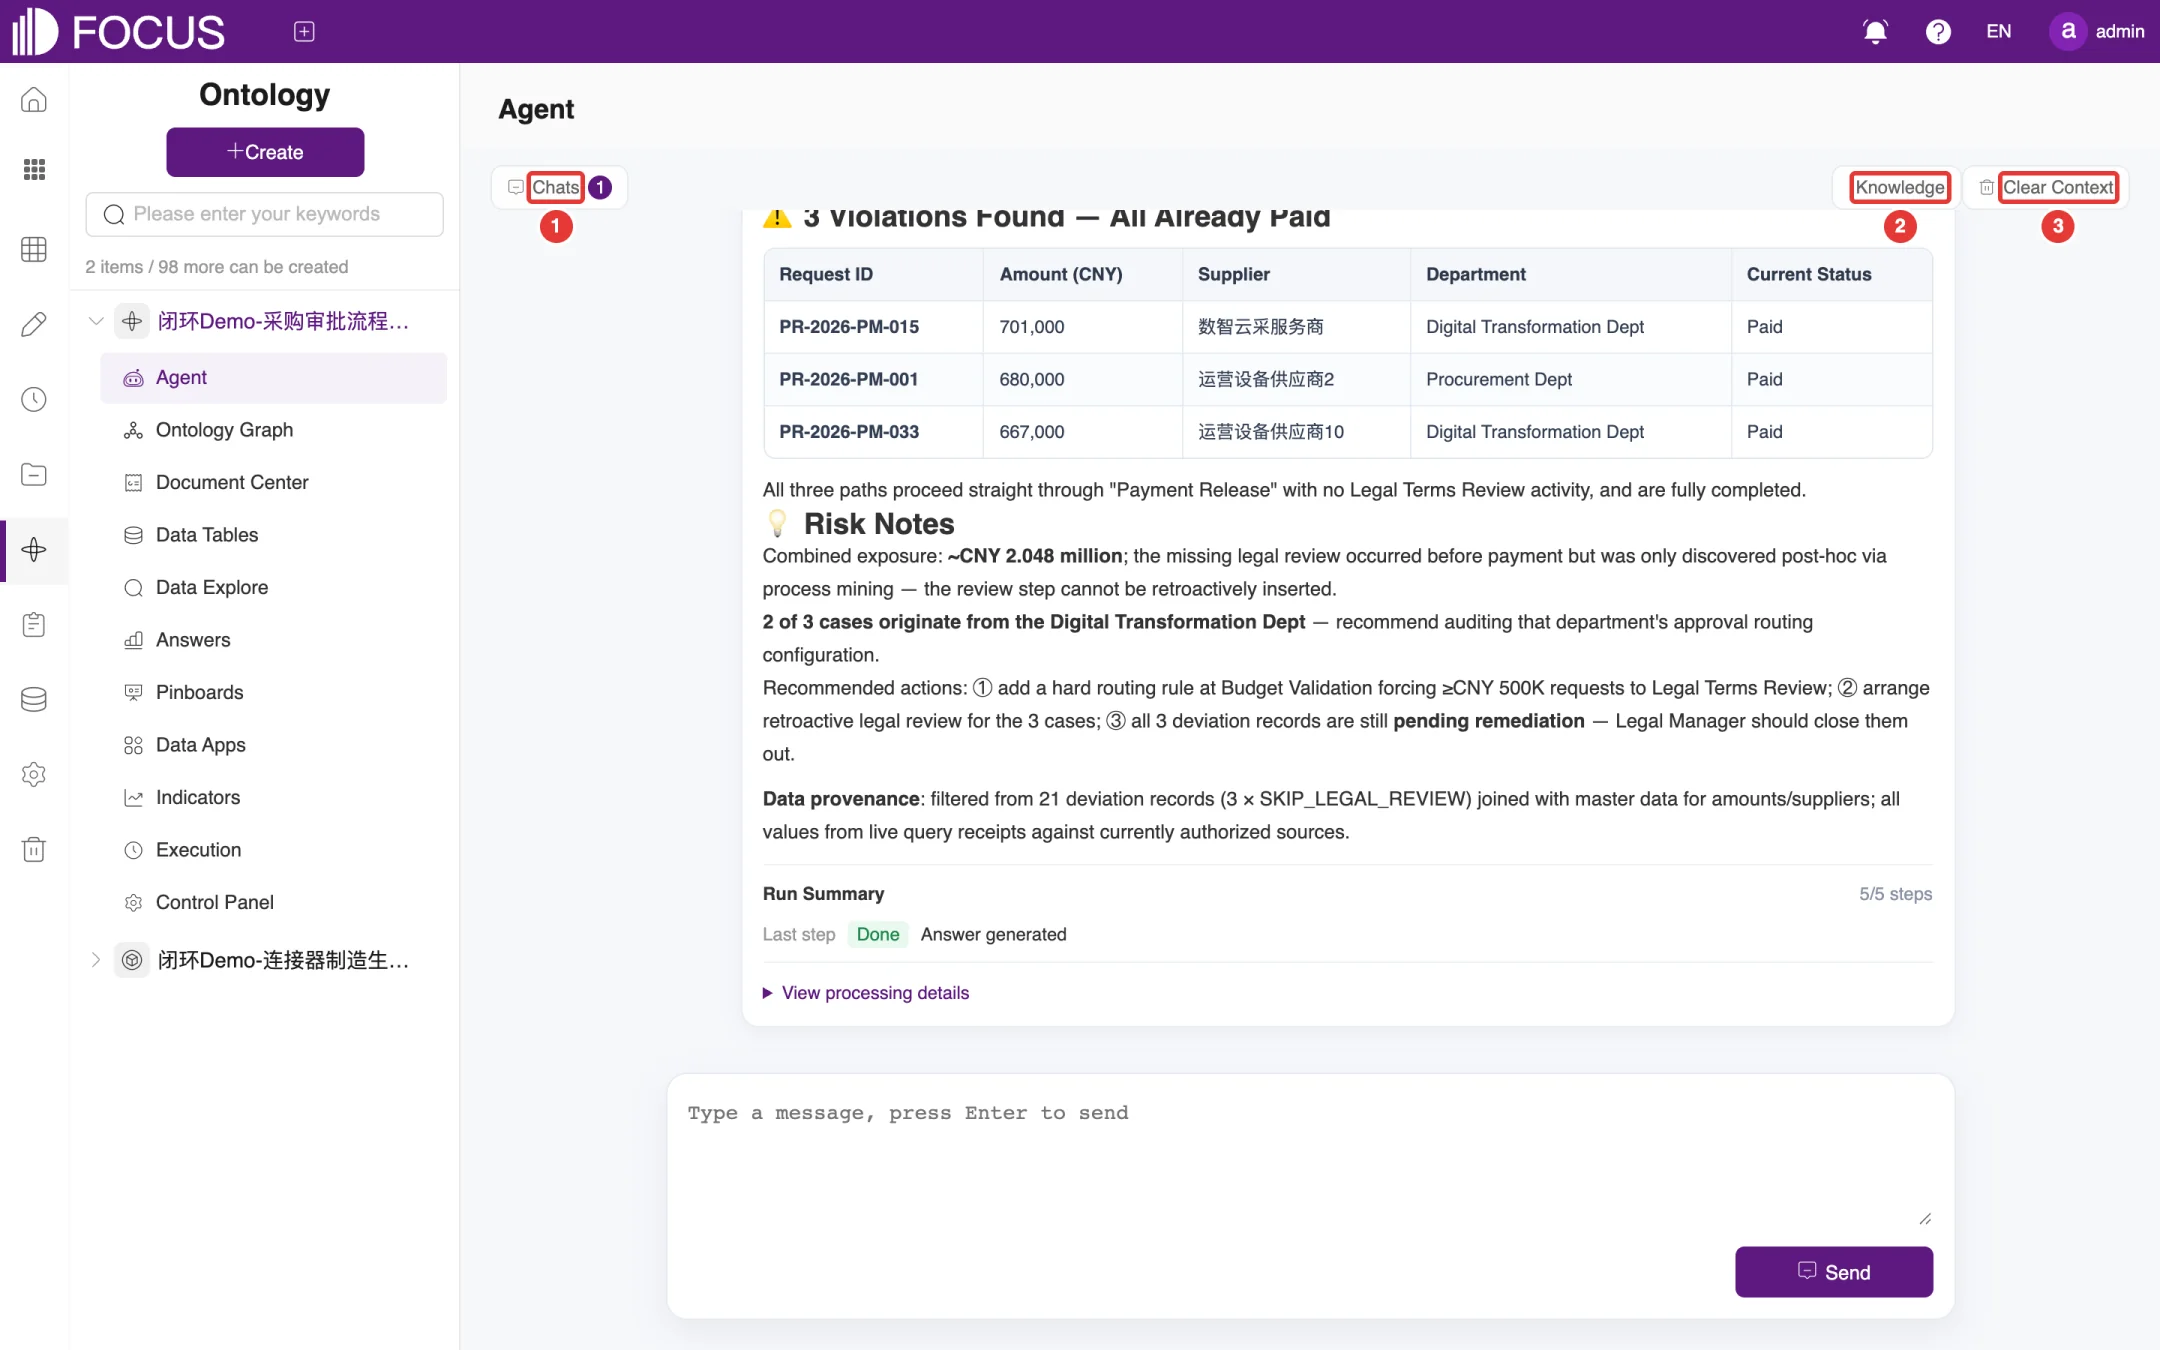
The Agent module is where you talk to the ontology, as shown in Figure 10-3:
Type a question in the input box at the bottom, for example Among high-value purchase requests, which ones skipped legal review?, and press Enter or click Send.
The agent reads the ontology's tables and documents and works through the question step by step. To interrupt it, click Stop task.
When it finishes, the answer gives the conclusion, the detailed records, risk notes and recommended actions, and states which tables the data came from. Run Summary shows the number of steps; click View processing details to expand each step.
The buttons at the top of the page:
① Chats: view previous chats and switch between them;
② Knowledge: opens the Agent Knowledge Bases window, where you bind knowledge bases to the agent. Bound knowledge bases serve as read-only evidence sources for the agent;
③ Clear Context: starts a new topic; the agent no longer takes the earlier conversation into account.
Figure 10-3. Ontology agent
The chat with the ontology on the home page uses this same agent; see Chapter 1.
10.4Ontology Graph
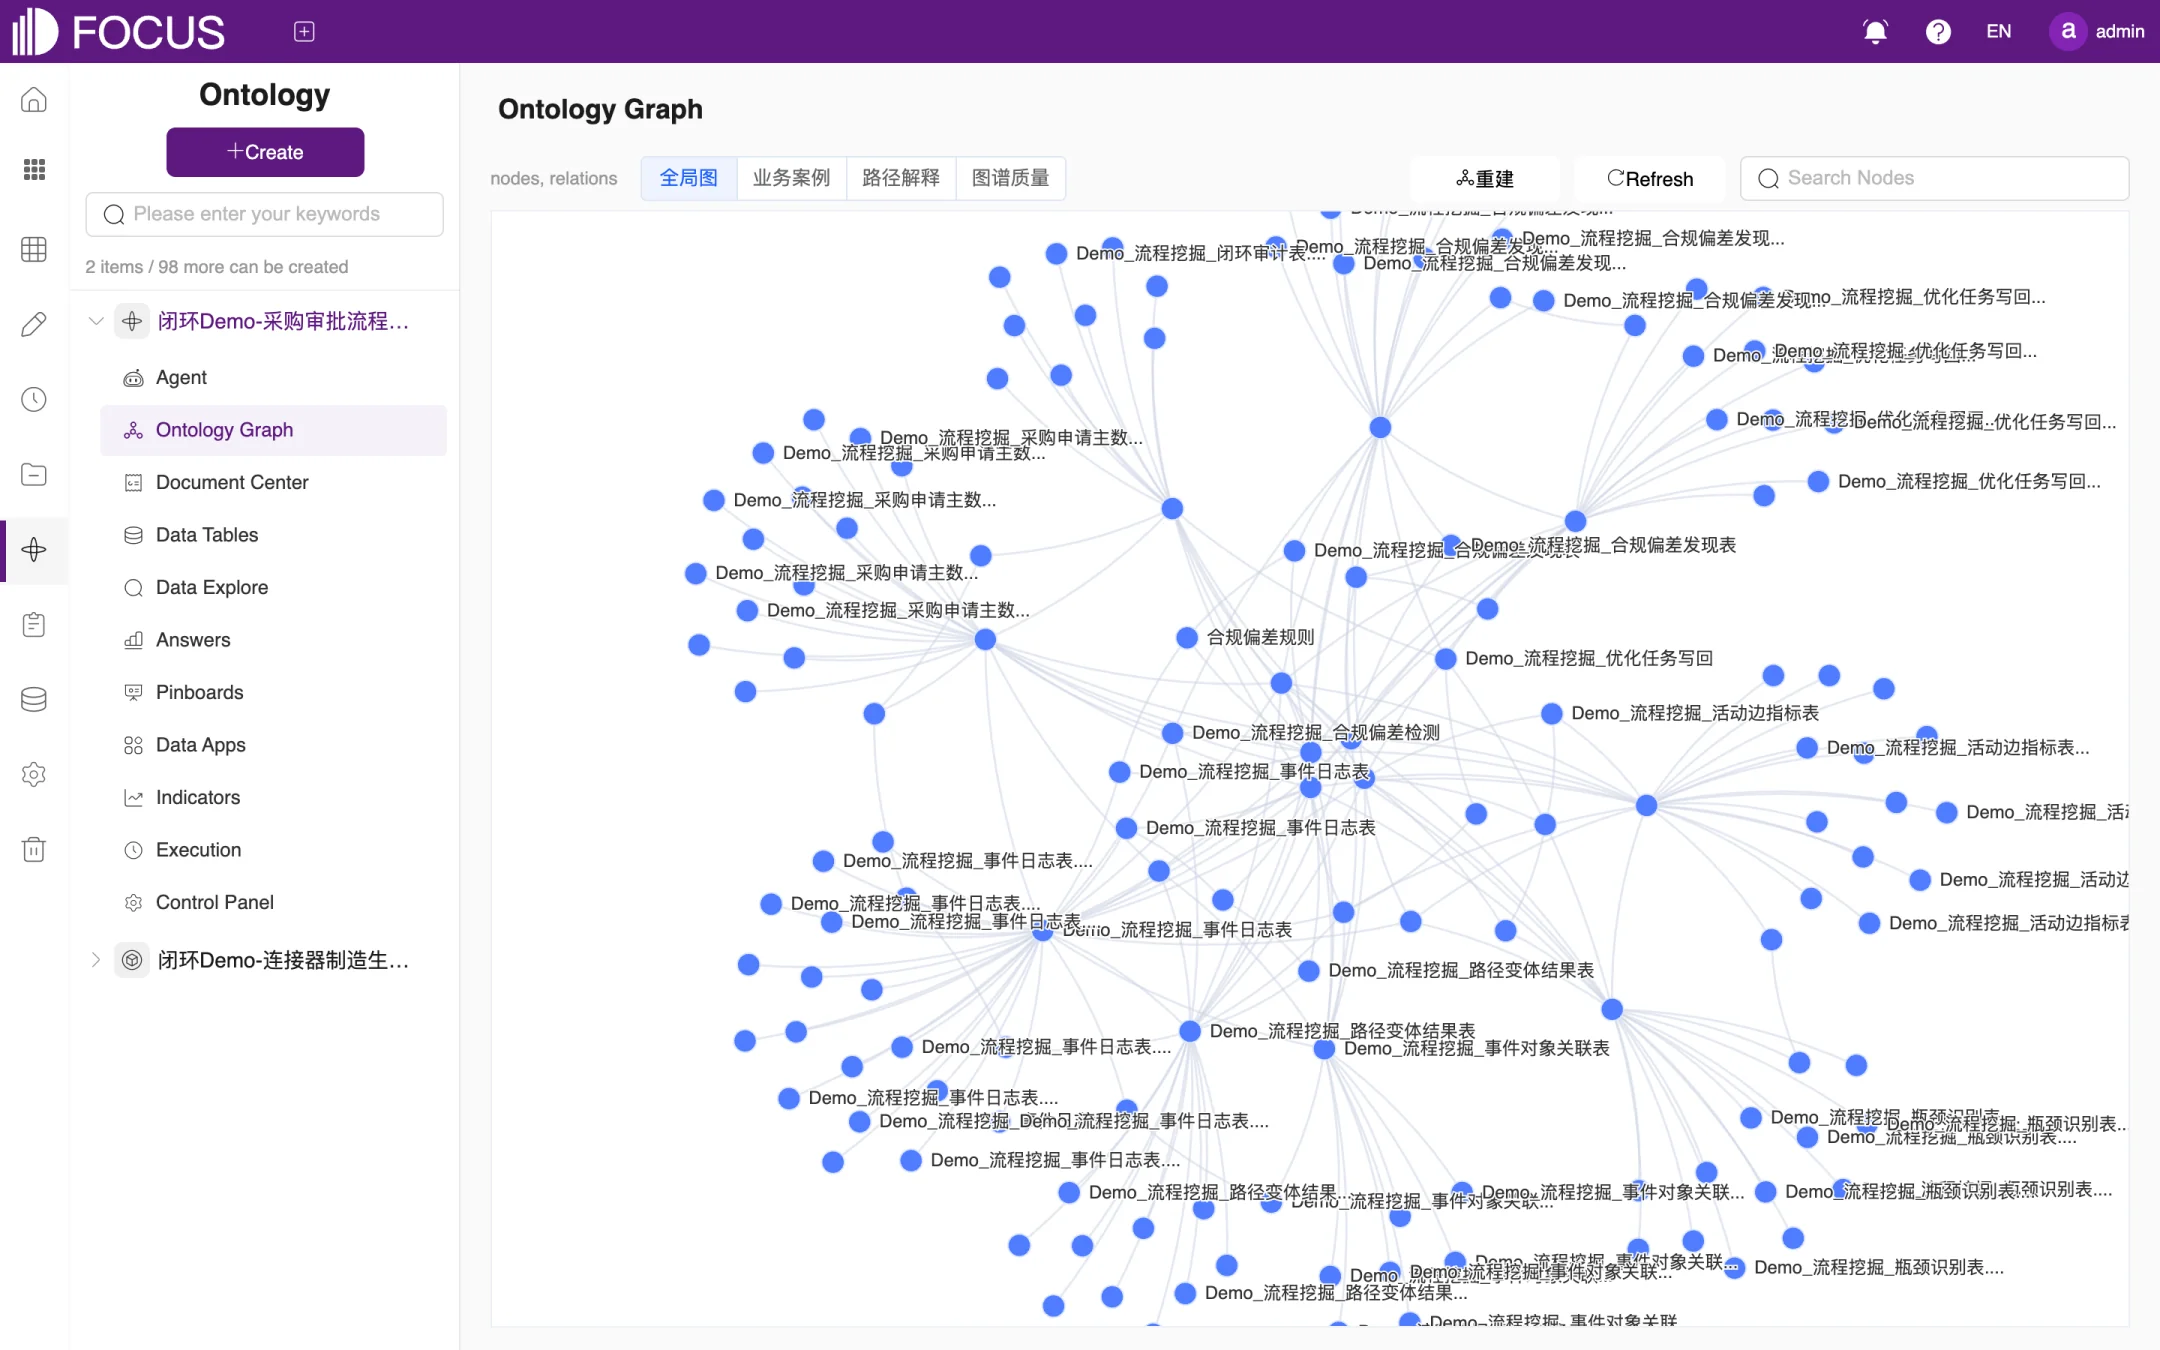
Ontology Graph shows the knowledge nodes in the ontology, such as tables, documents and fields, and the relations between them as a network graph, as shown in Figure 10-4. The toolbar of this view is in Chinese in the English UI:
全局图 ("Global graph"): shows the graph of the whole ontology. You can drag and zoom it, and find a node with the Search Nodes box in the upper-right corner;
业务案例 ("Business cases"): graphs built for individual business cases; click 生成 ("Generate") to create one;
路径解释 ("Path explanation"): shows the paths that connect nodes;
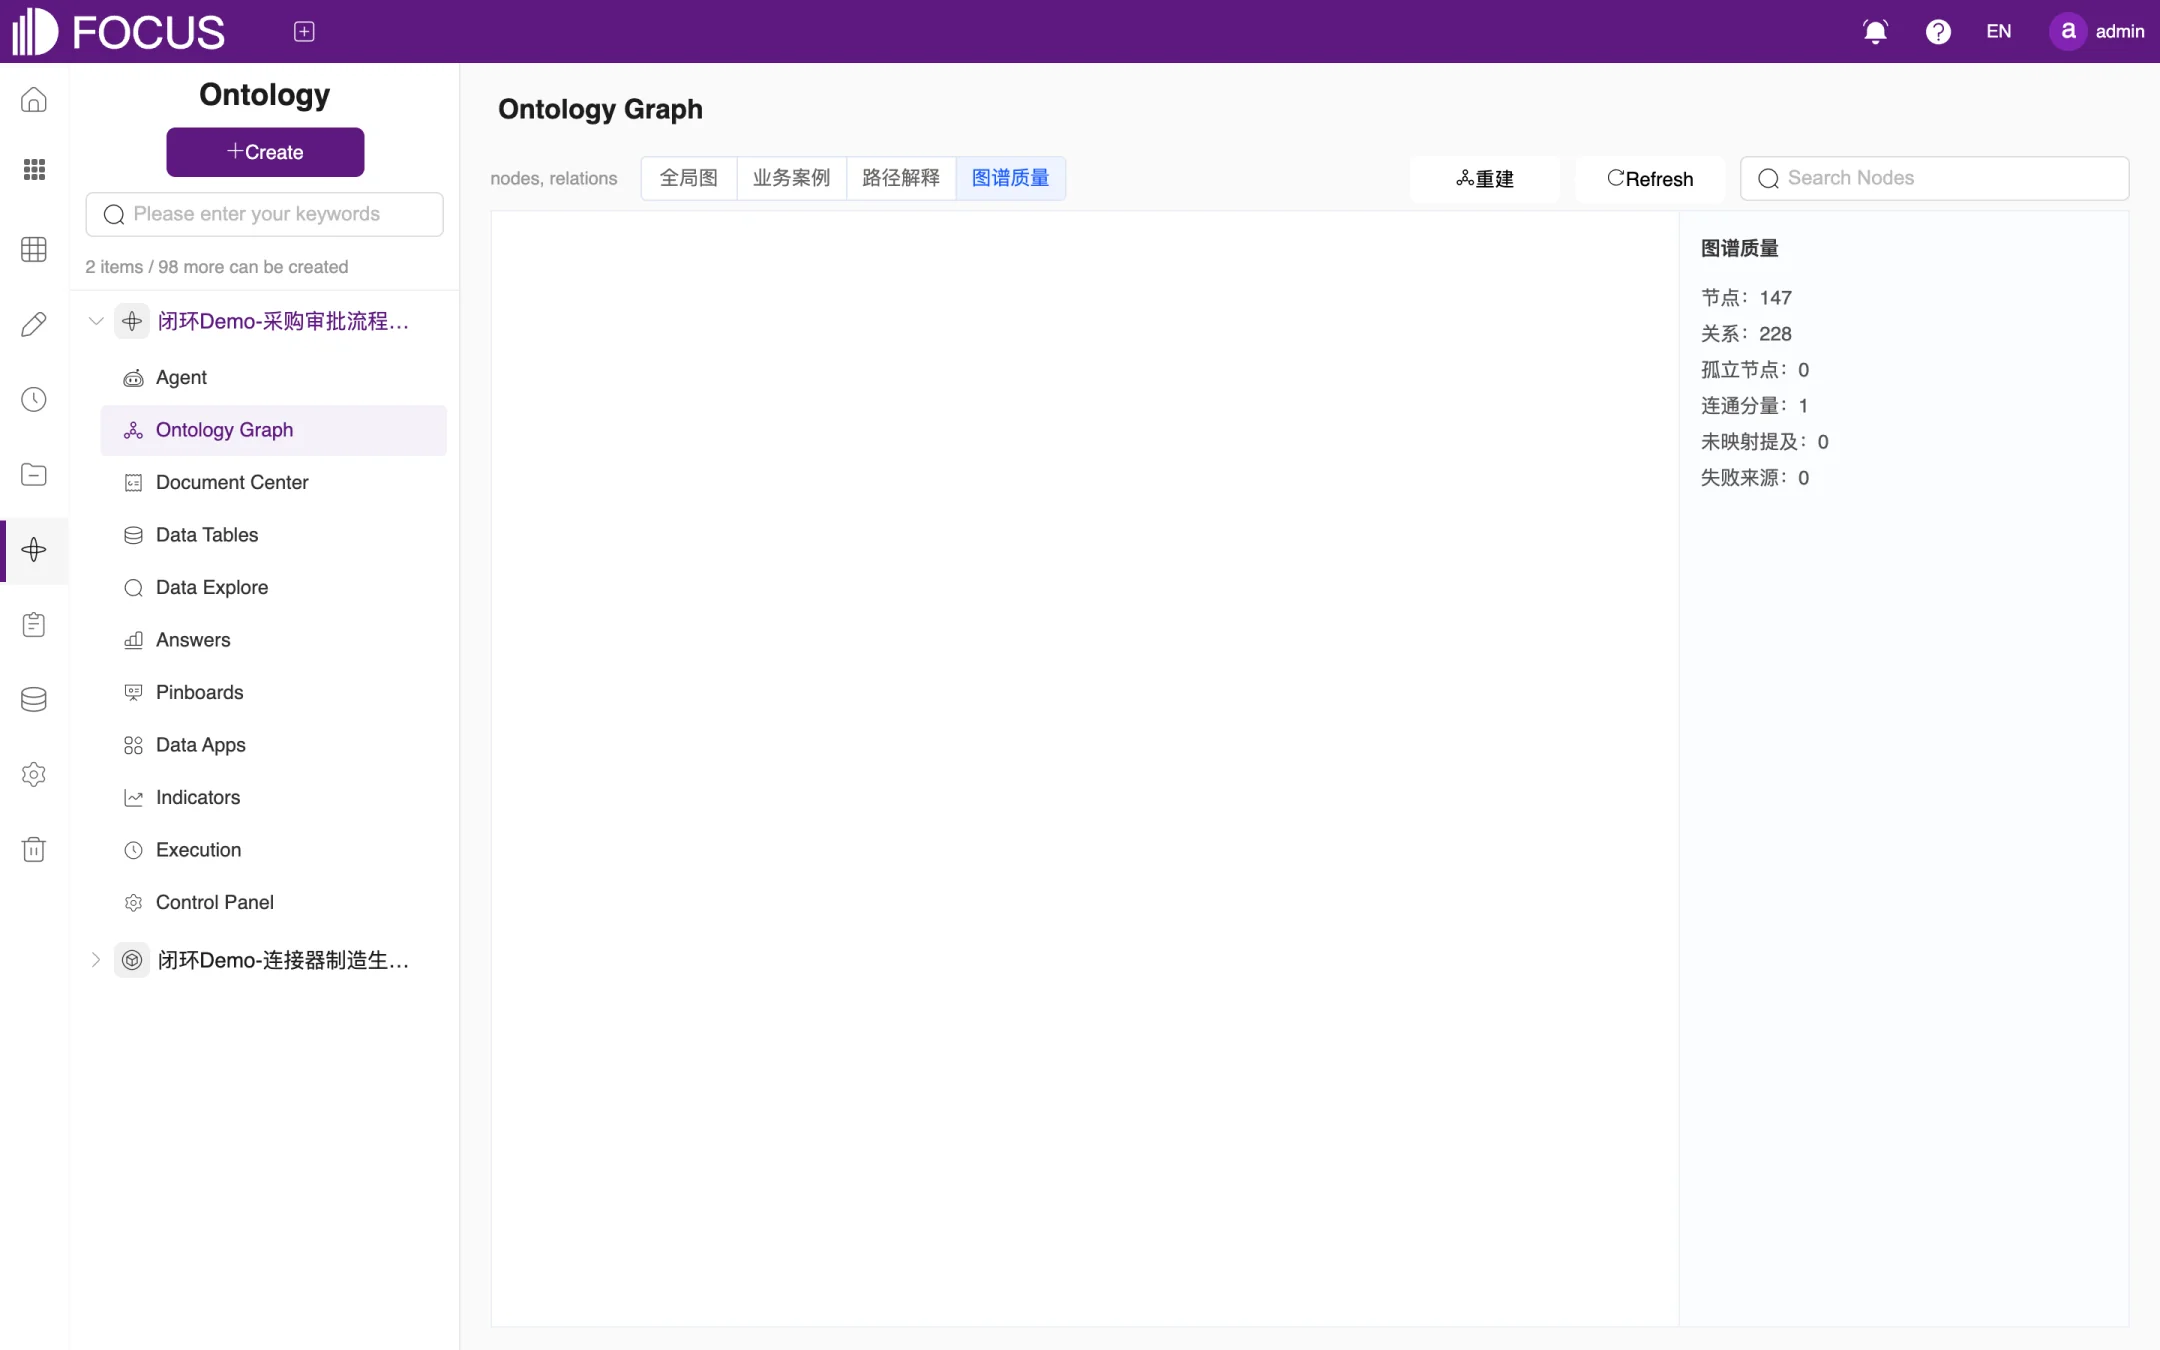
图谱质量 ("Graph quality"): checks how complete the graph is, as shown in Figure 10-5. The panel lists 节点 (nodes), 关系 (relations), 孤立节点 (isolated nodes), 连通分量 (connected components), 未映射提及 (unmapped mentions) and 失败来源 (failed sources). Use it to see how many nodes and relations the graph has;
重建 ("Rebuild") and Refresh: regenerate or refresh the graph after the data or documents have changed.
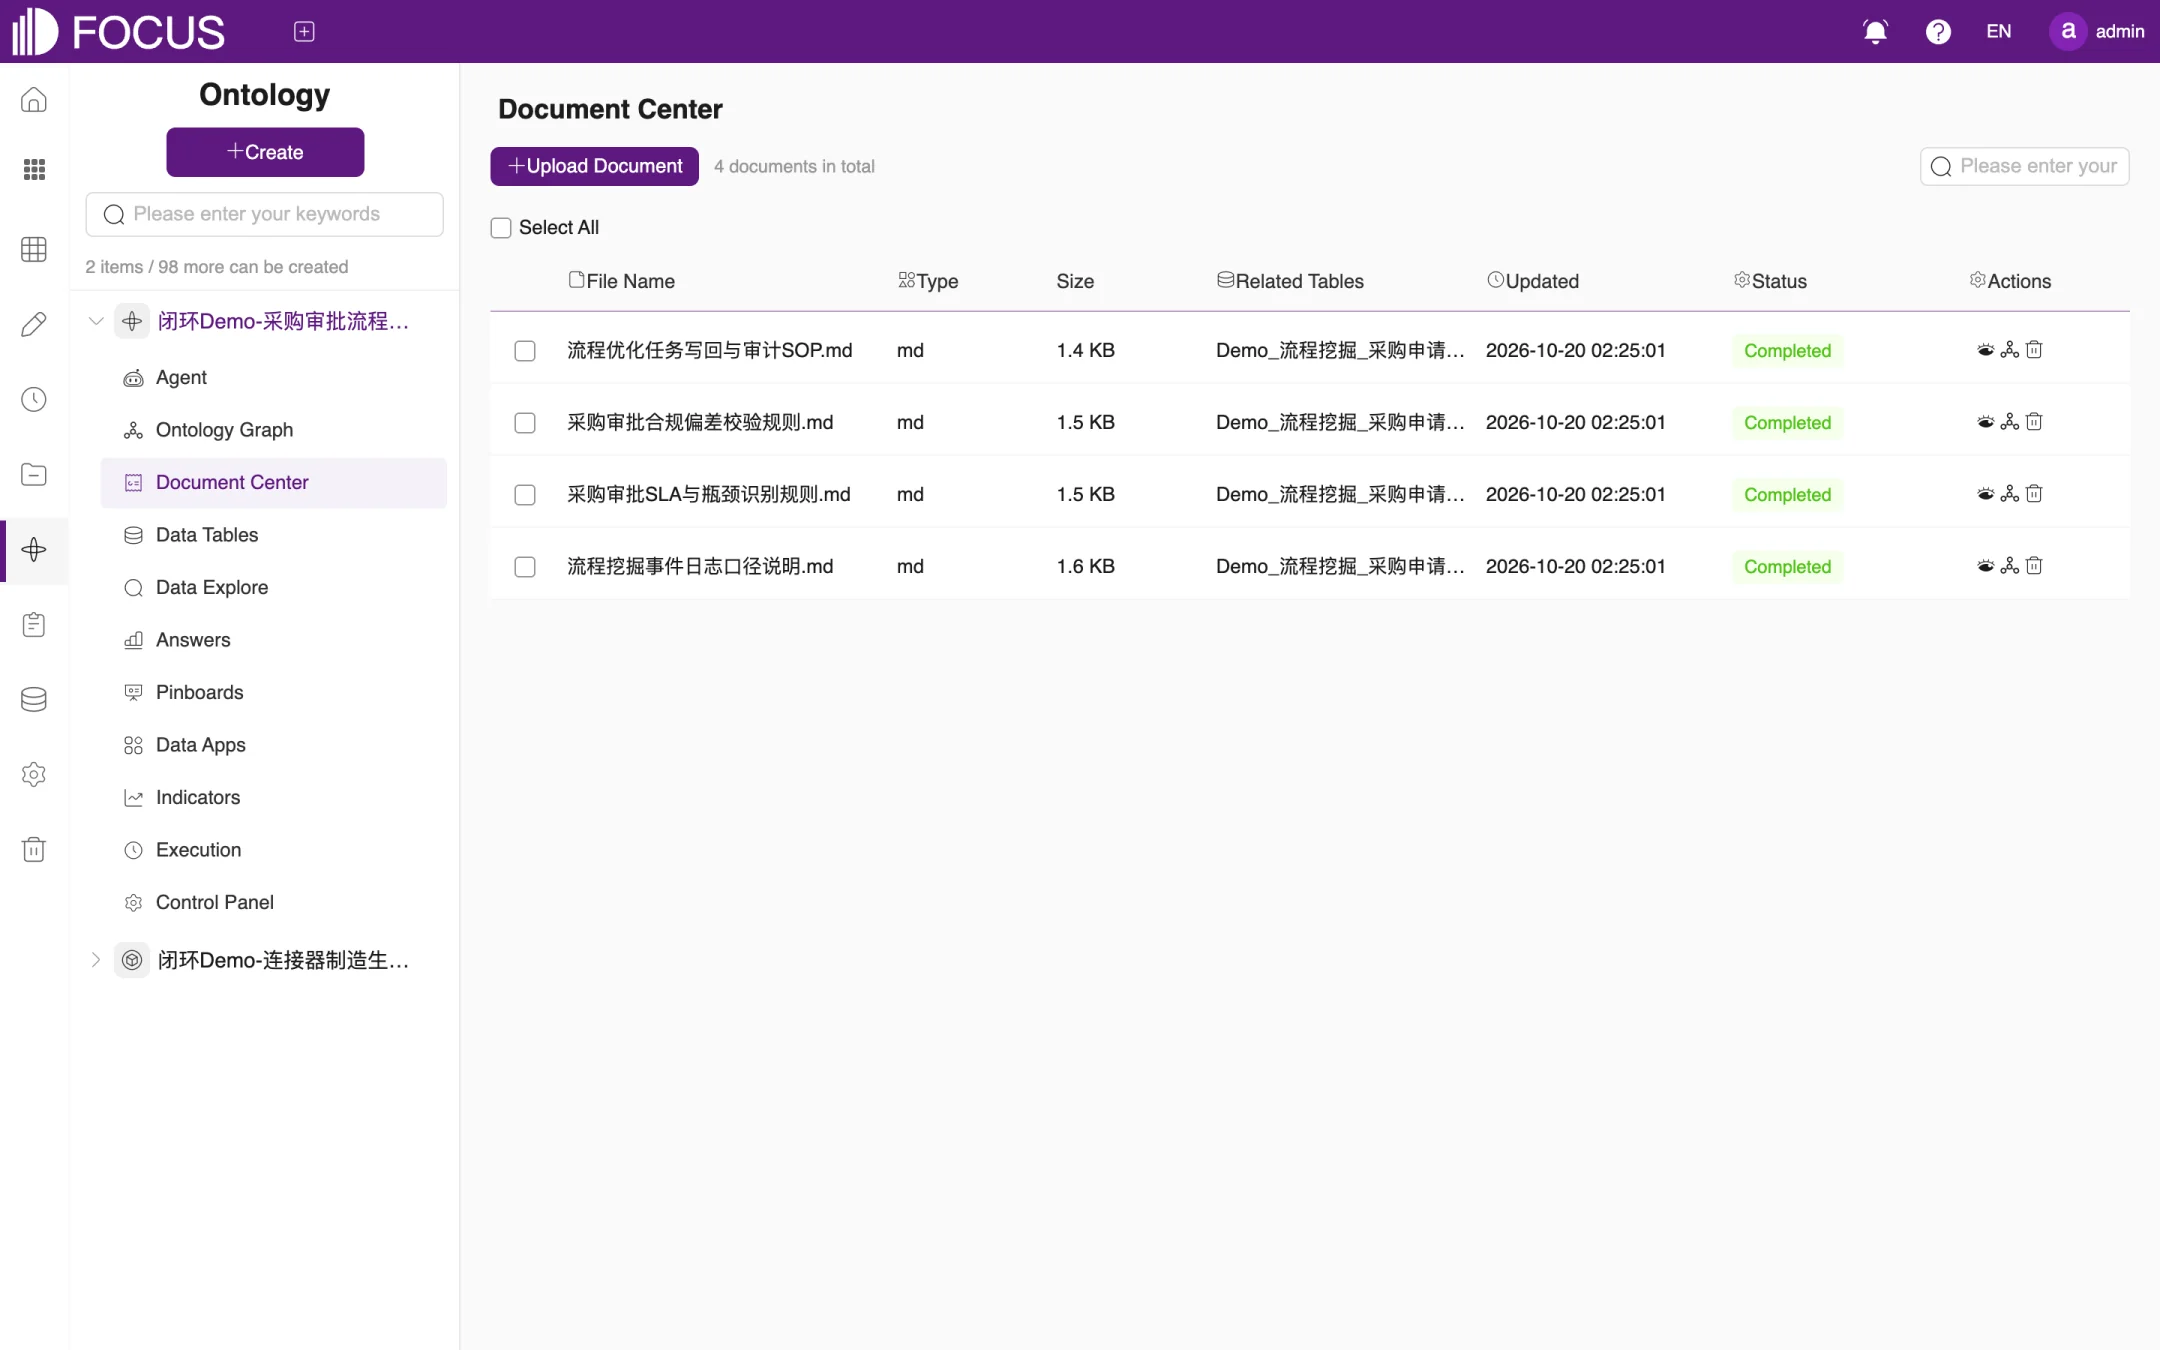
Document Center manages the business documents bound to the ontology, such as metric definitions, business rules and operating procedures, as shown in Figure 10-6.
Click Upload Document to upload a file.
The list shows each document's File Name, Type, Size, Related Tables, Updated time and Status. When the status is Completed, the agent can search and cite the document's content.
In the Actions column, click the eye icon to view a document, or the trash icon to delete it.
Figure 10-6. Document Center
10.6Data Tables and Data Explore
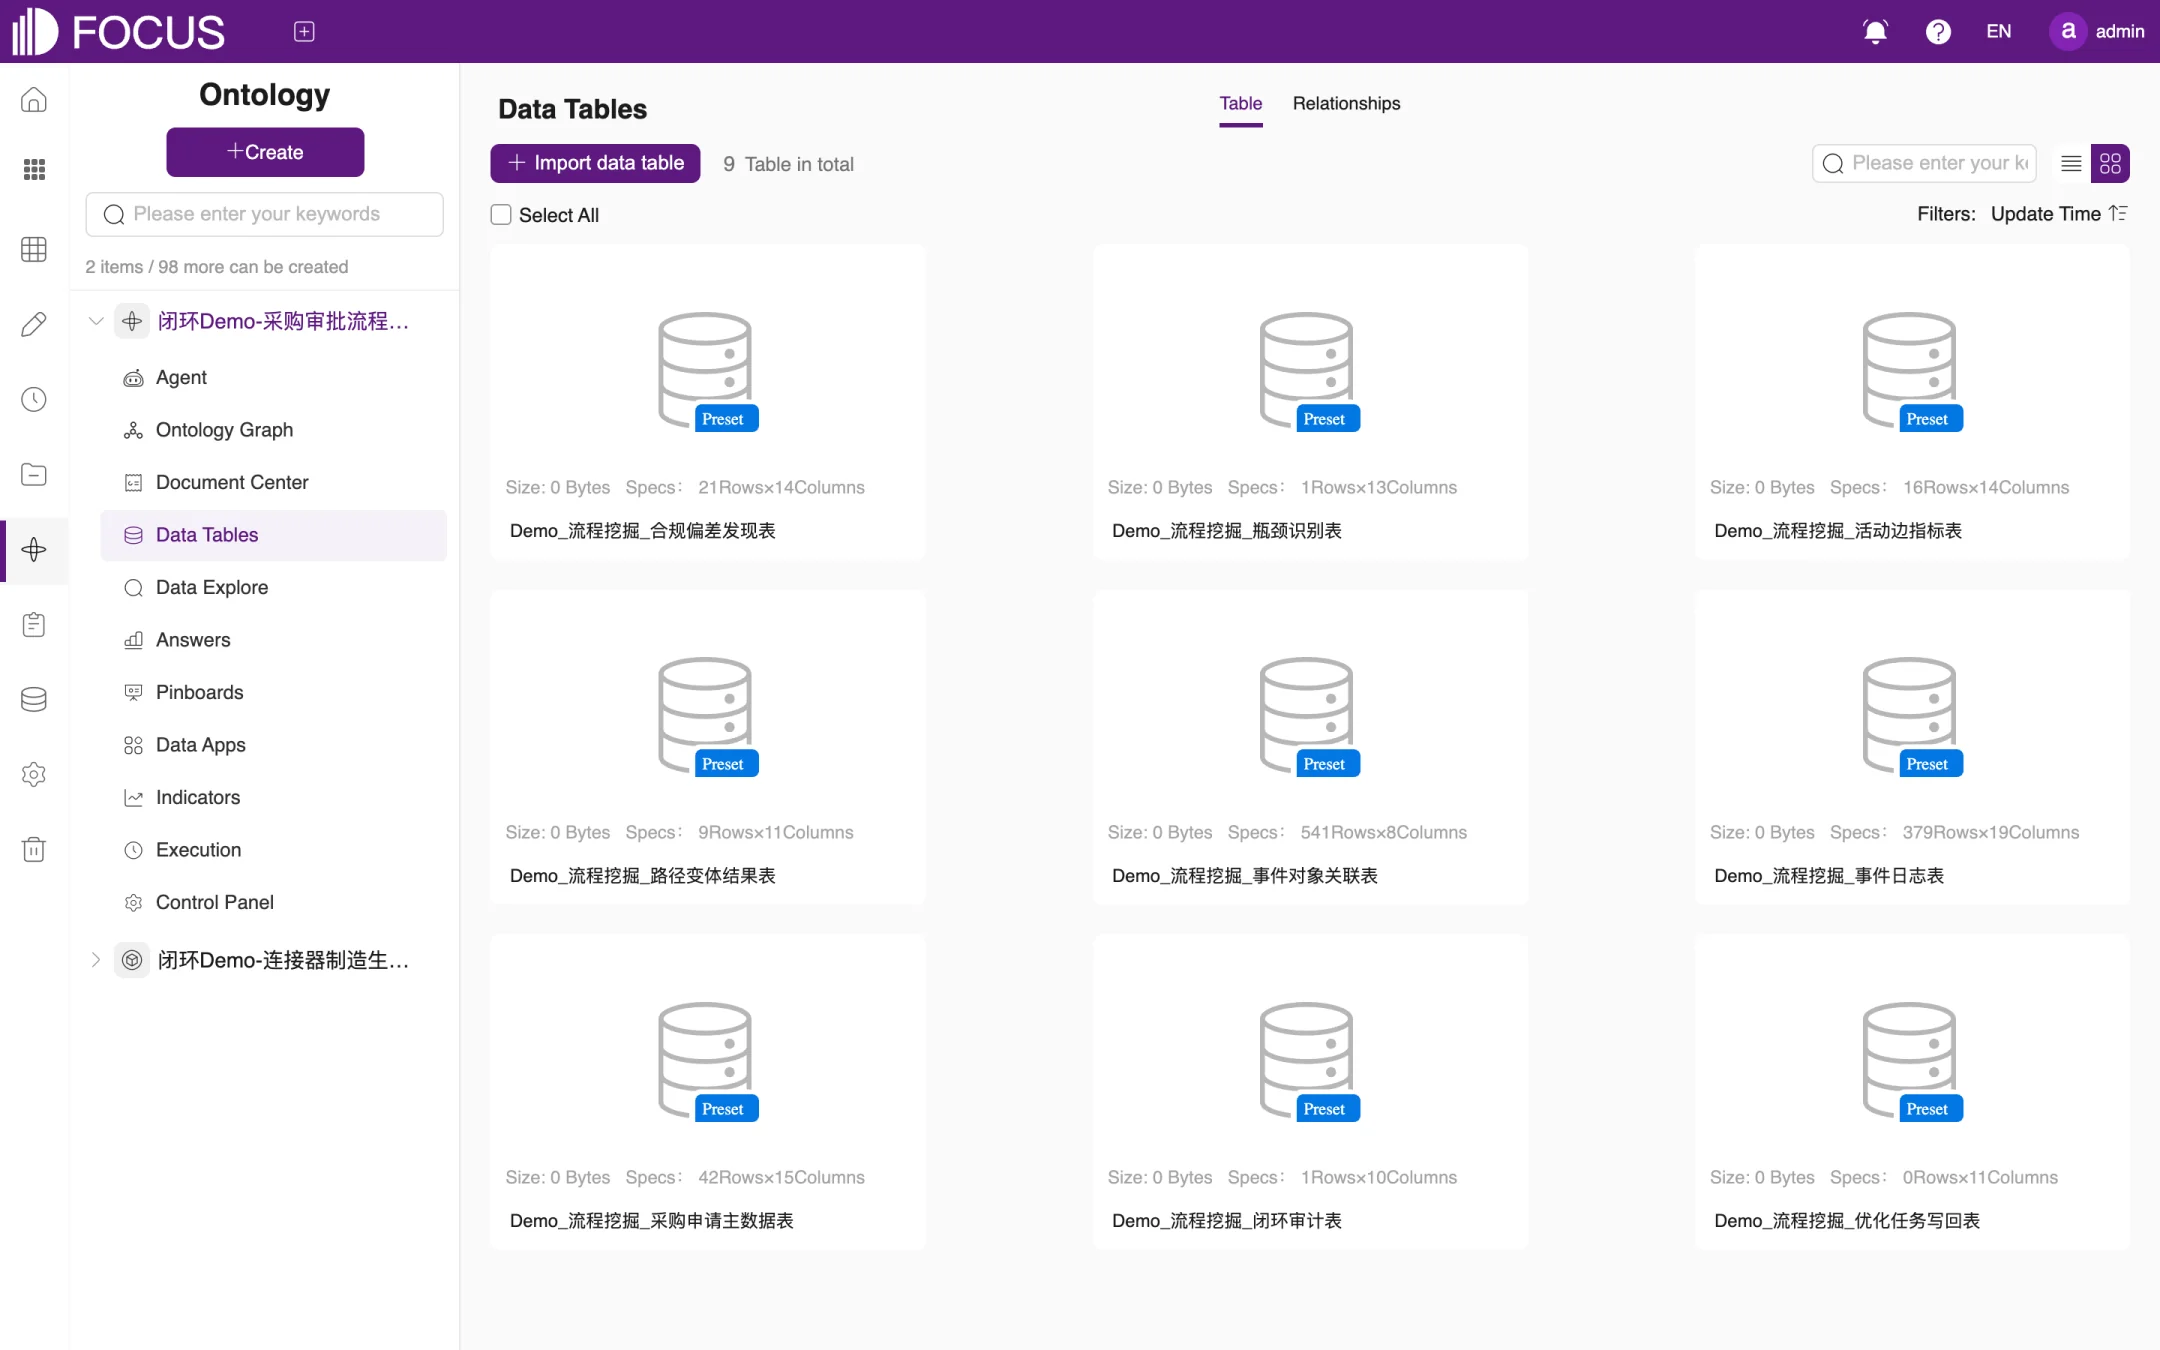
The Data Tables module lists the tables bound to the ontology, as shown in Figure 10-7. Click Import data table to add more tables from the system to the ontology. The Relationships tab sets up the joins between these tables, the same way as in Chapter 6.
Figure 10-7. Tables in an ontology
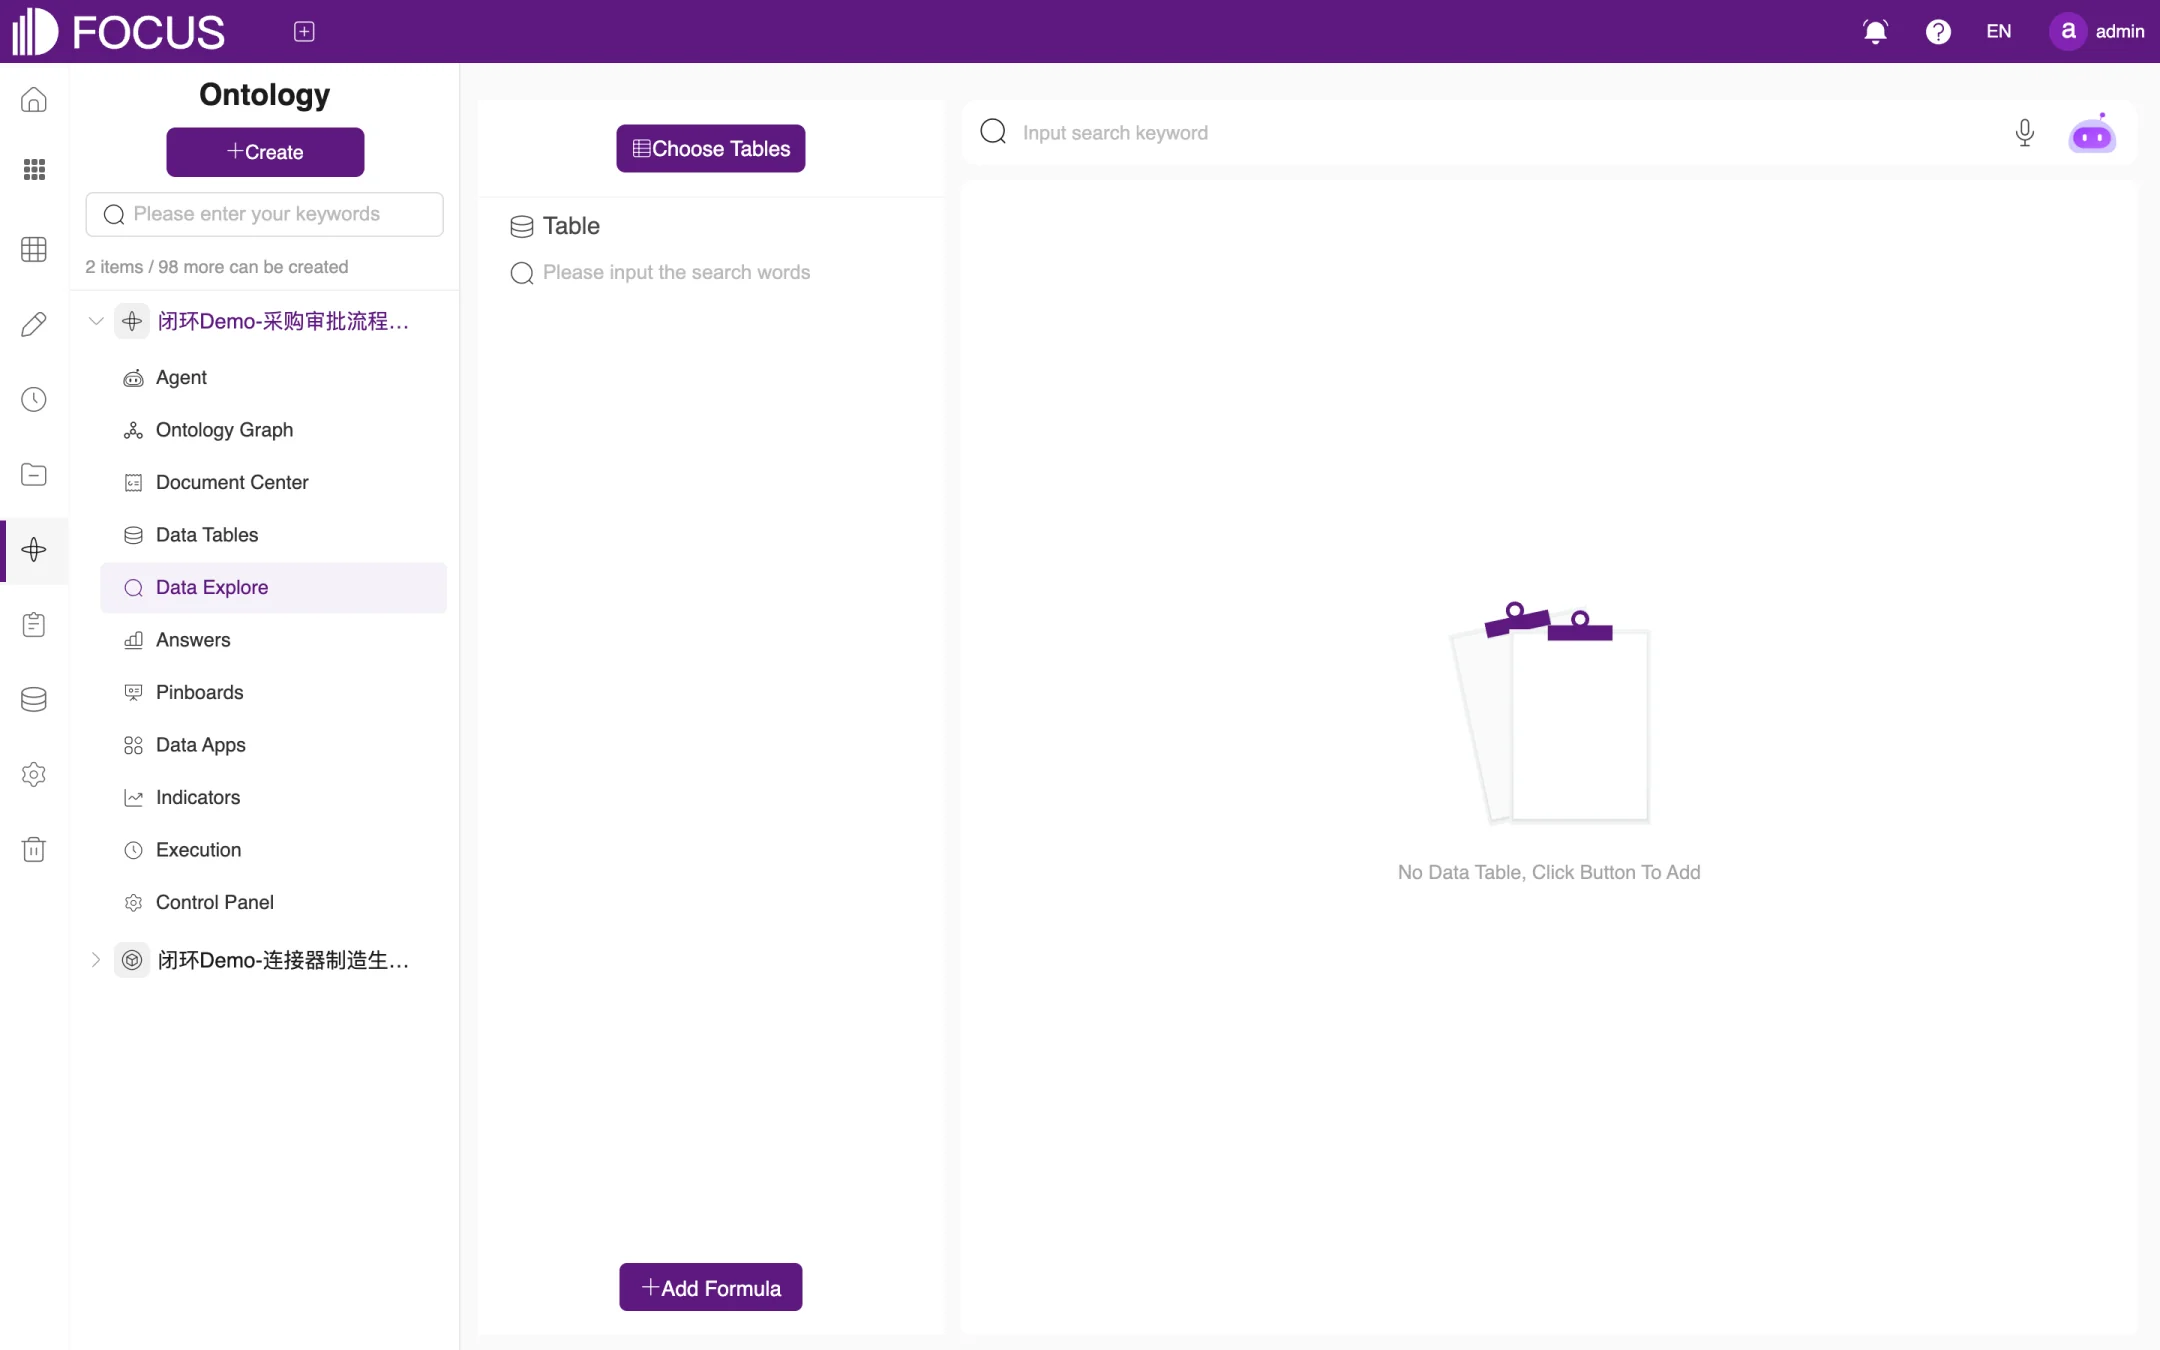
Data Explore offers the same search features as Data Search, but you can only choose tables that belong to the ontology (Choose Tables), as shown in Figure 10-8. For how to search, see Chapter 2.
Figure 10-8. Data Explore
10.7Answers, Pinboards and Data Apps
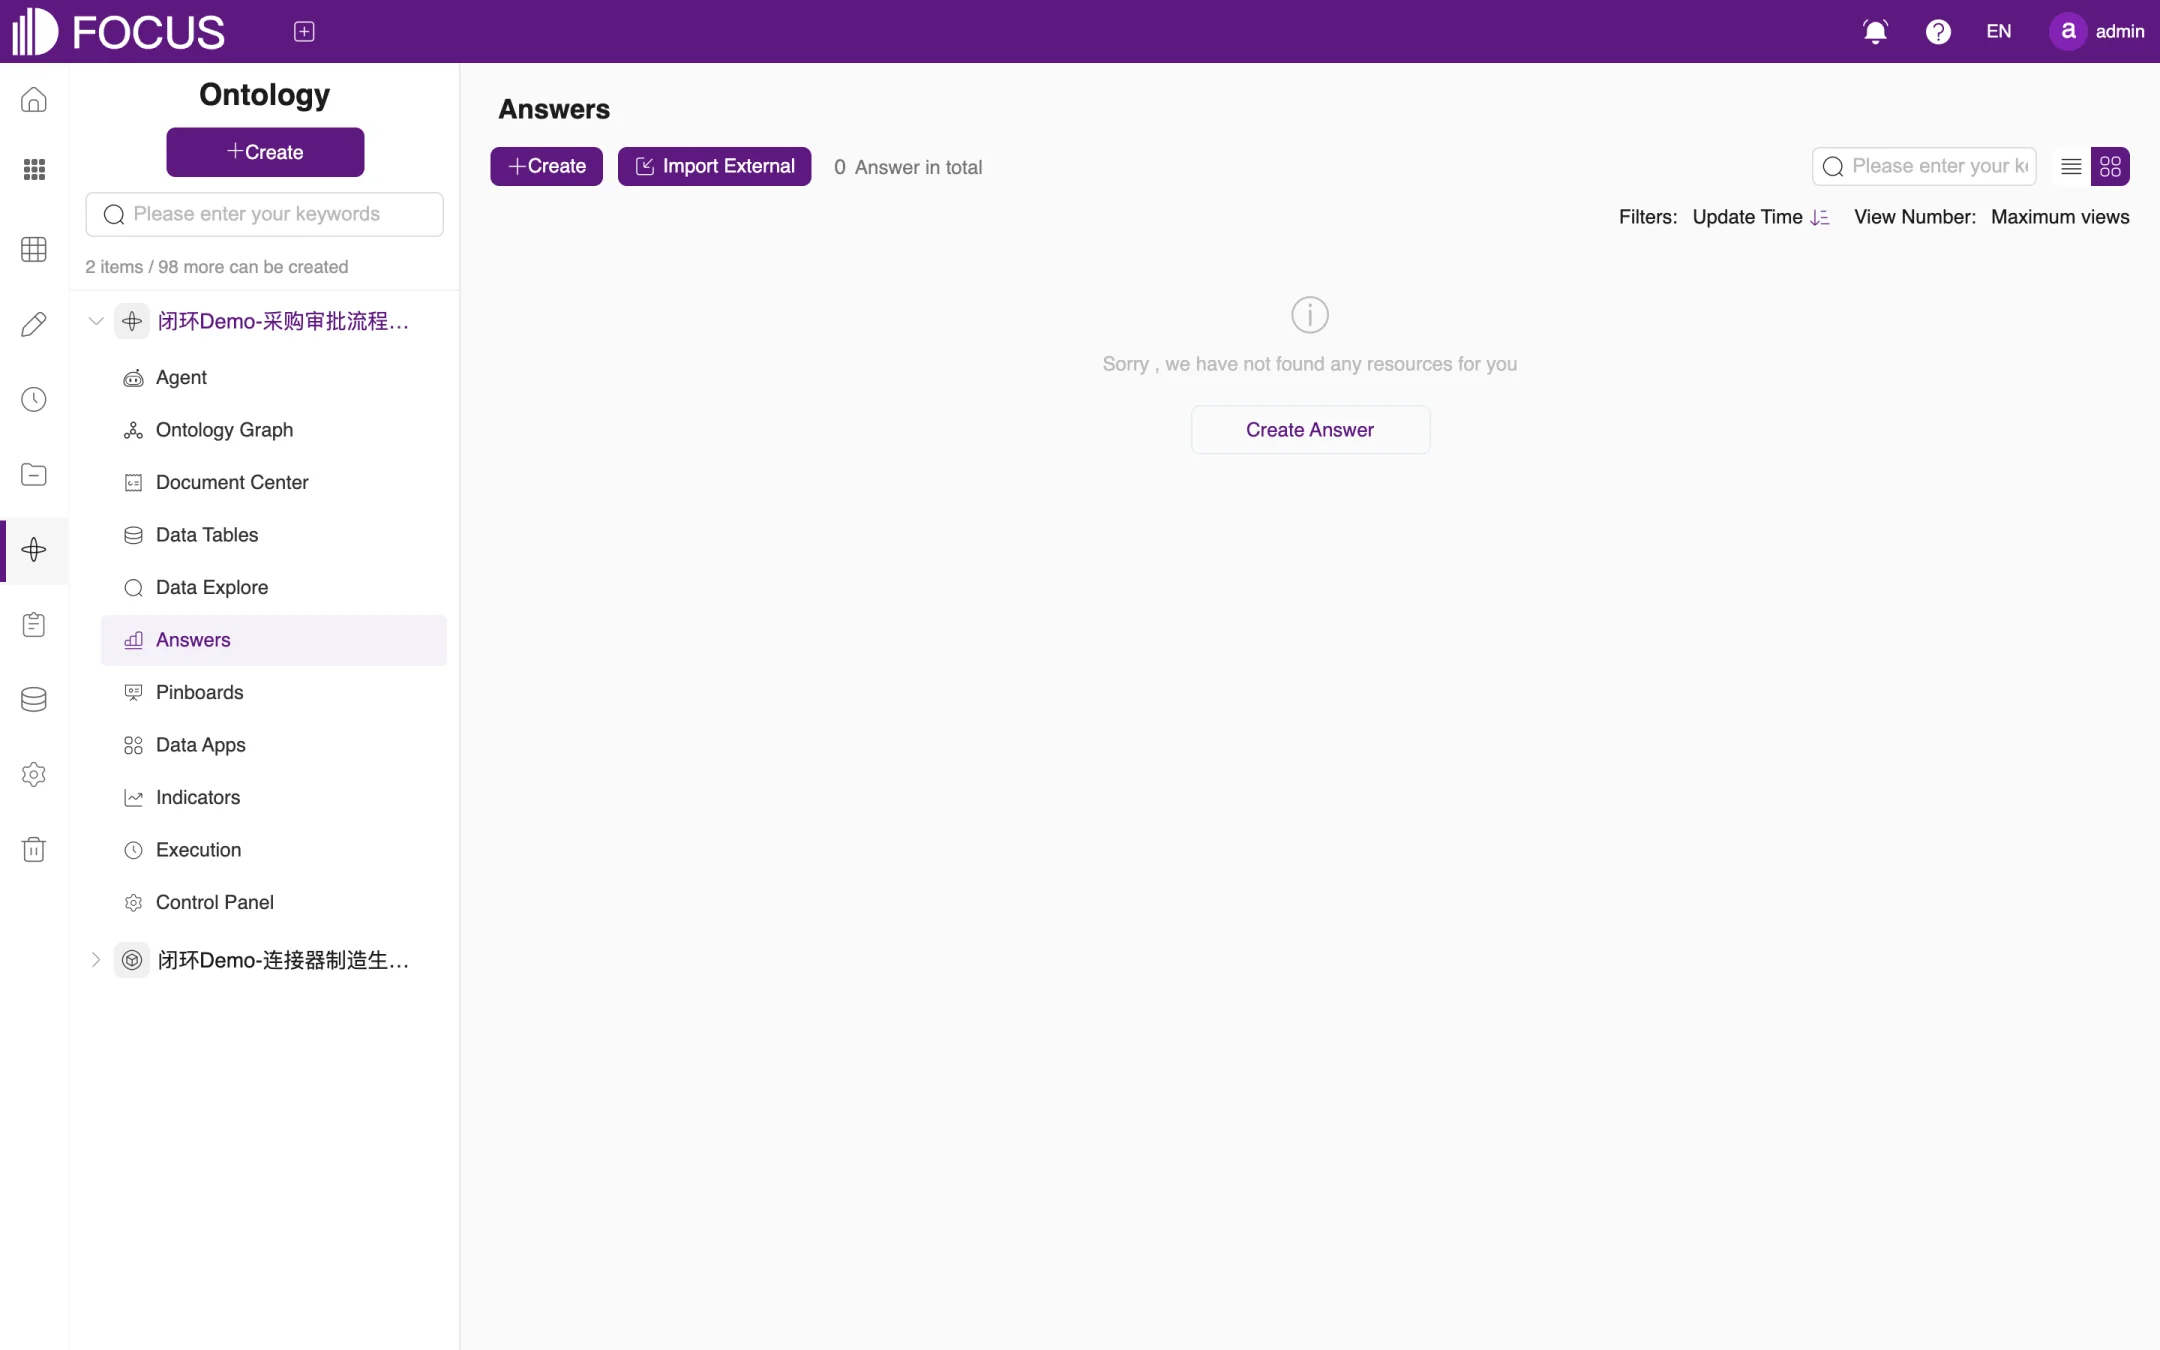
These three modules manage the ontology's own answers, pinboards and data apps. They work the same way as the corresponding features in the BI Workspace (see Chapters 4 and 5). In addition, Answers has an Import External button that brings answers already saved in the BI Workspace into the ontology, and Pinboards and Data Apps have matching import buttons, as shown in Figure 10-9.
Figure 10-9. Answers
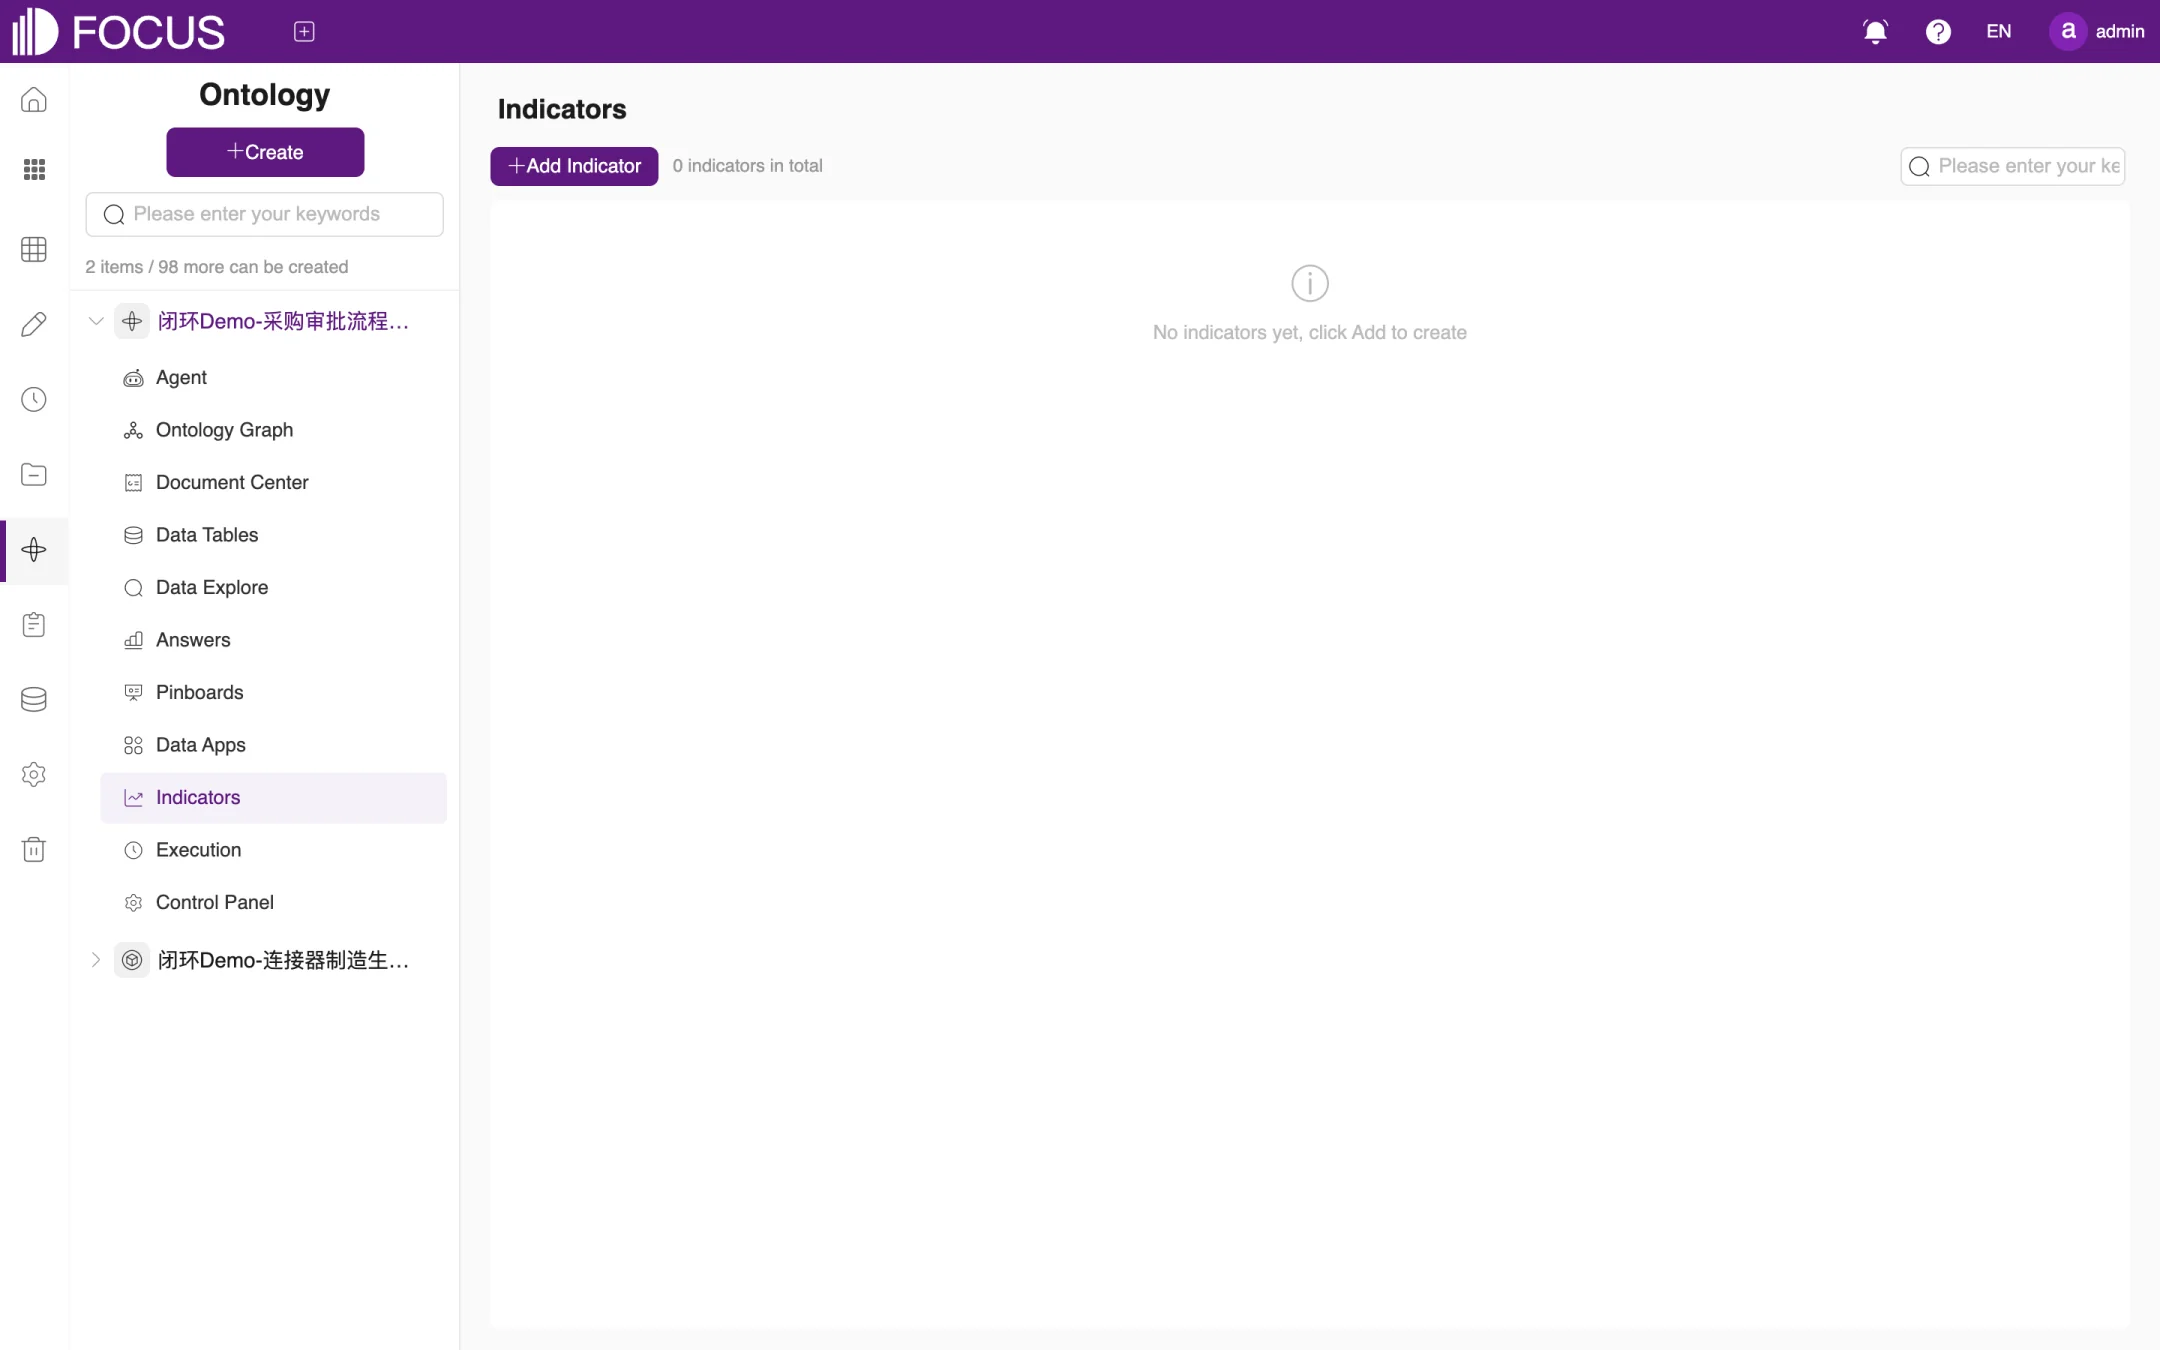
10.8Indicators
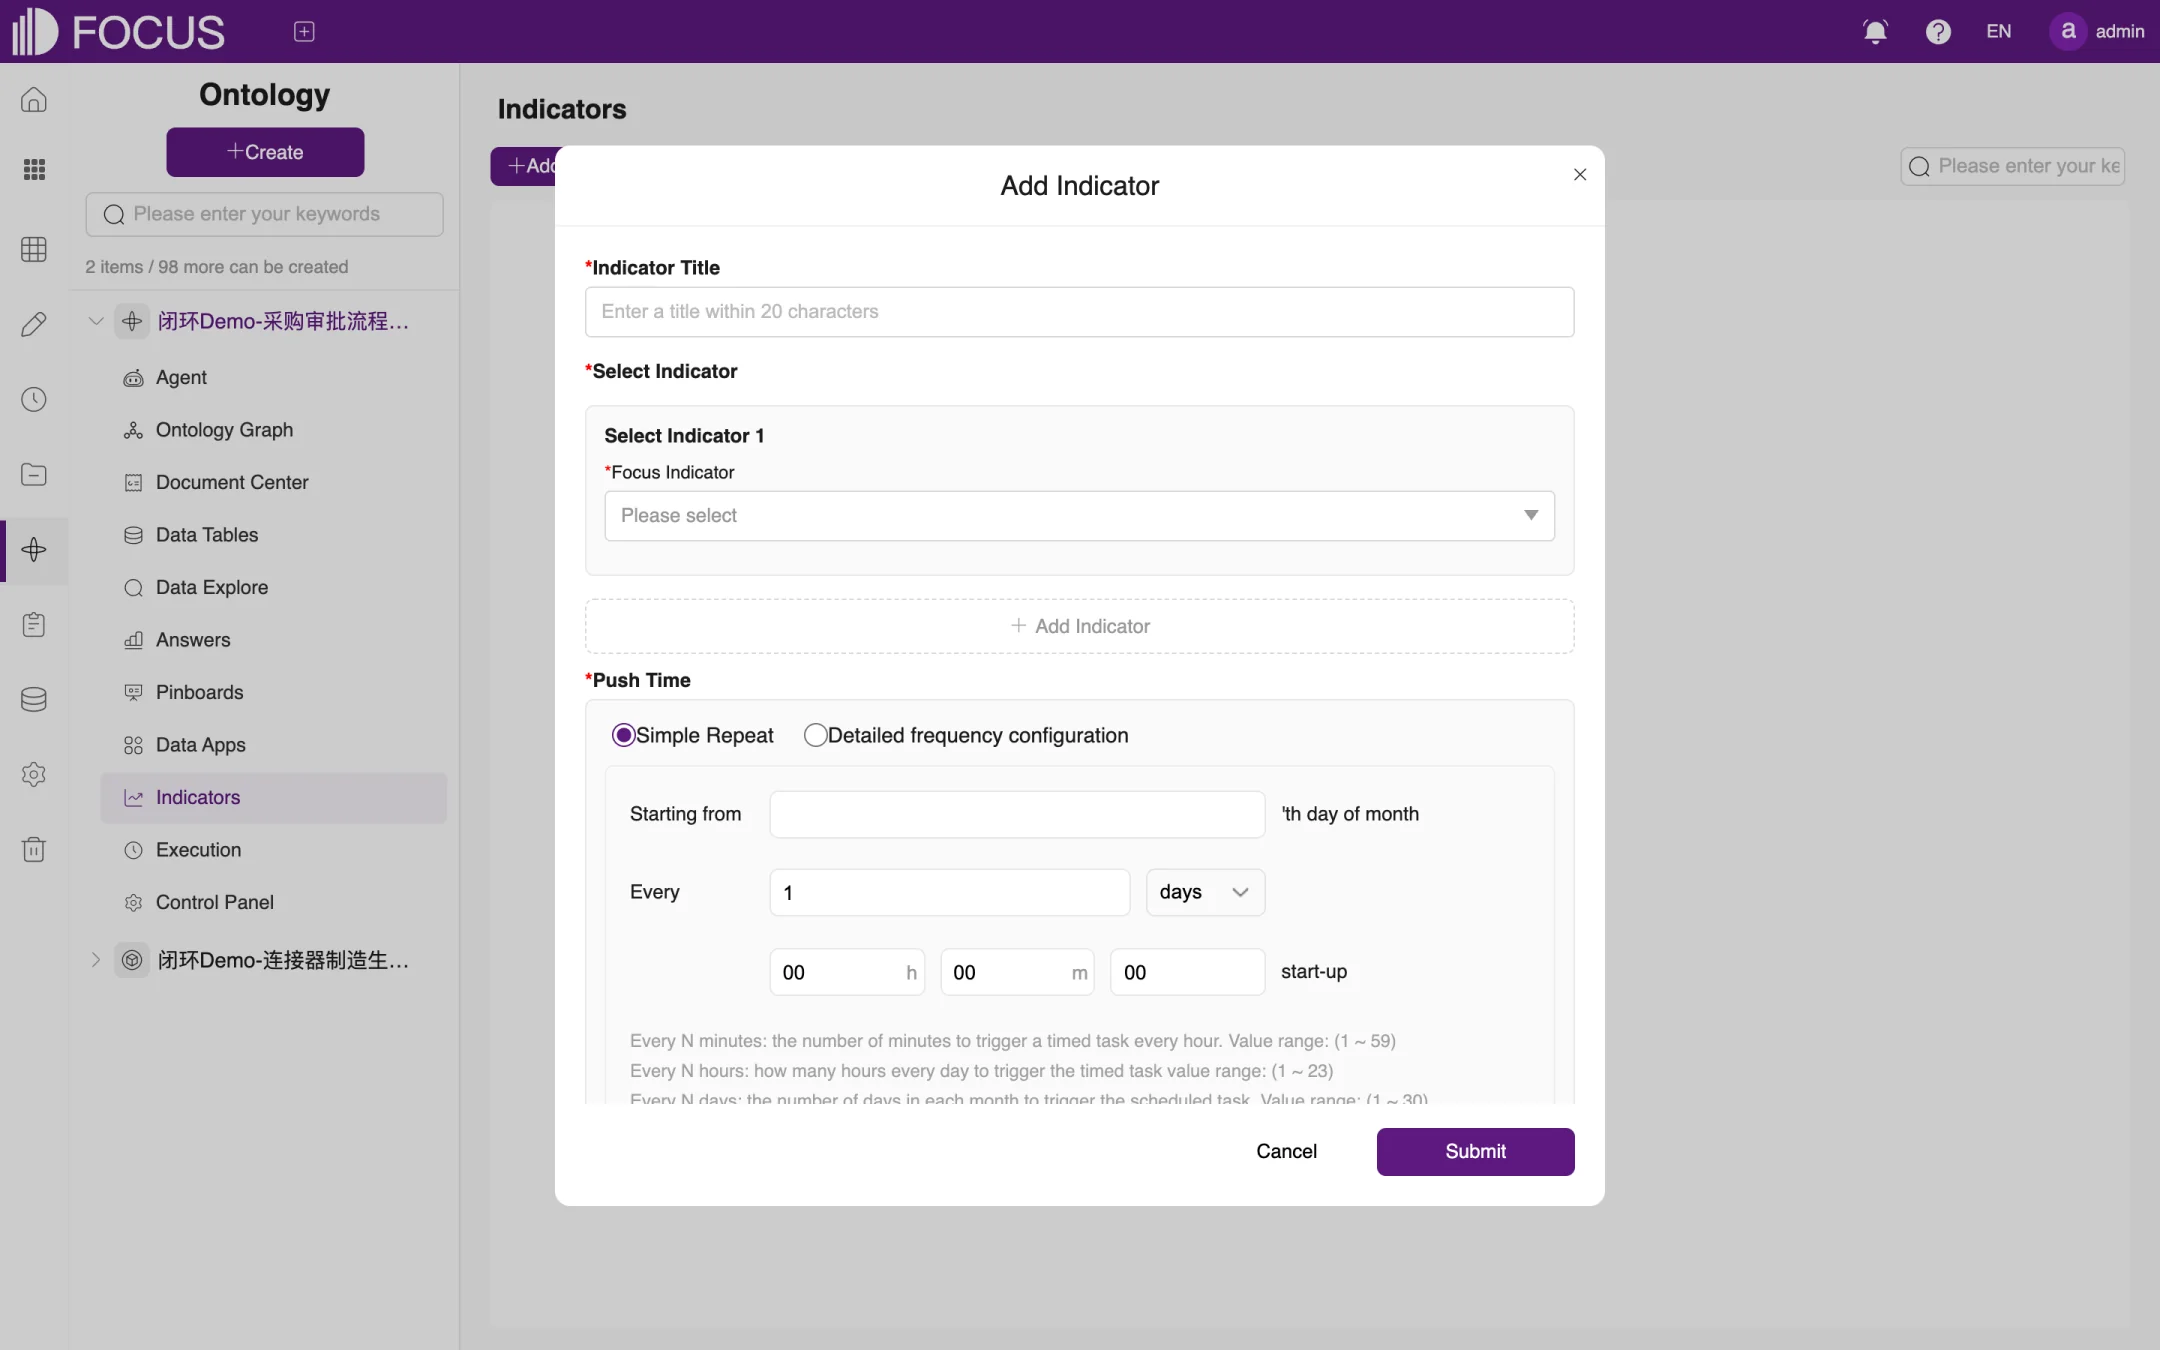
Indicators lets you follow important indicators and have them pushed to you on a schedule, as shown in Figure 10-10. Click Add Indicator to open the Add Indicator window, as shown in Figure 10-11:
Enter the Indicator Title.
Under Select Indicator, choose the indicator to follow in Focus Indicator. To follow several indicators at once, click Add Indicator below the first one.
Set the Push Time: either Simple Repeat (every N minutes, N hours or N days) or Detailed frequency configuration (start on a given day of each month, at a set hour and minute).
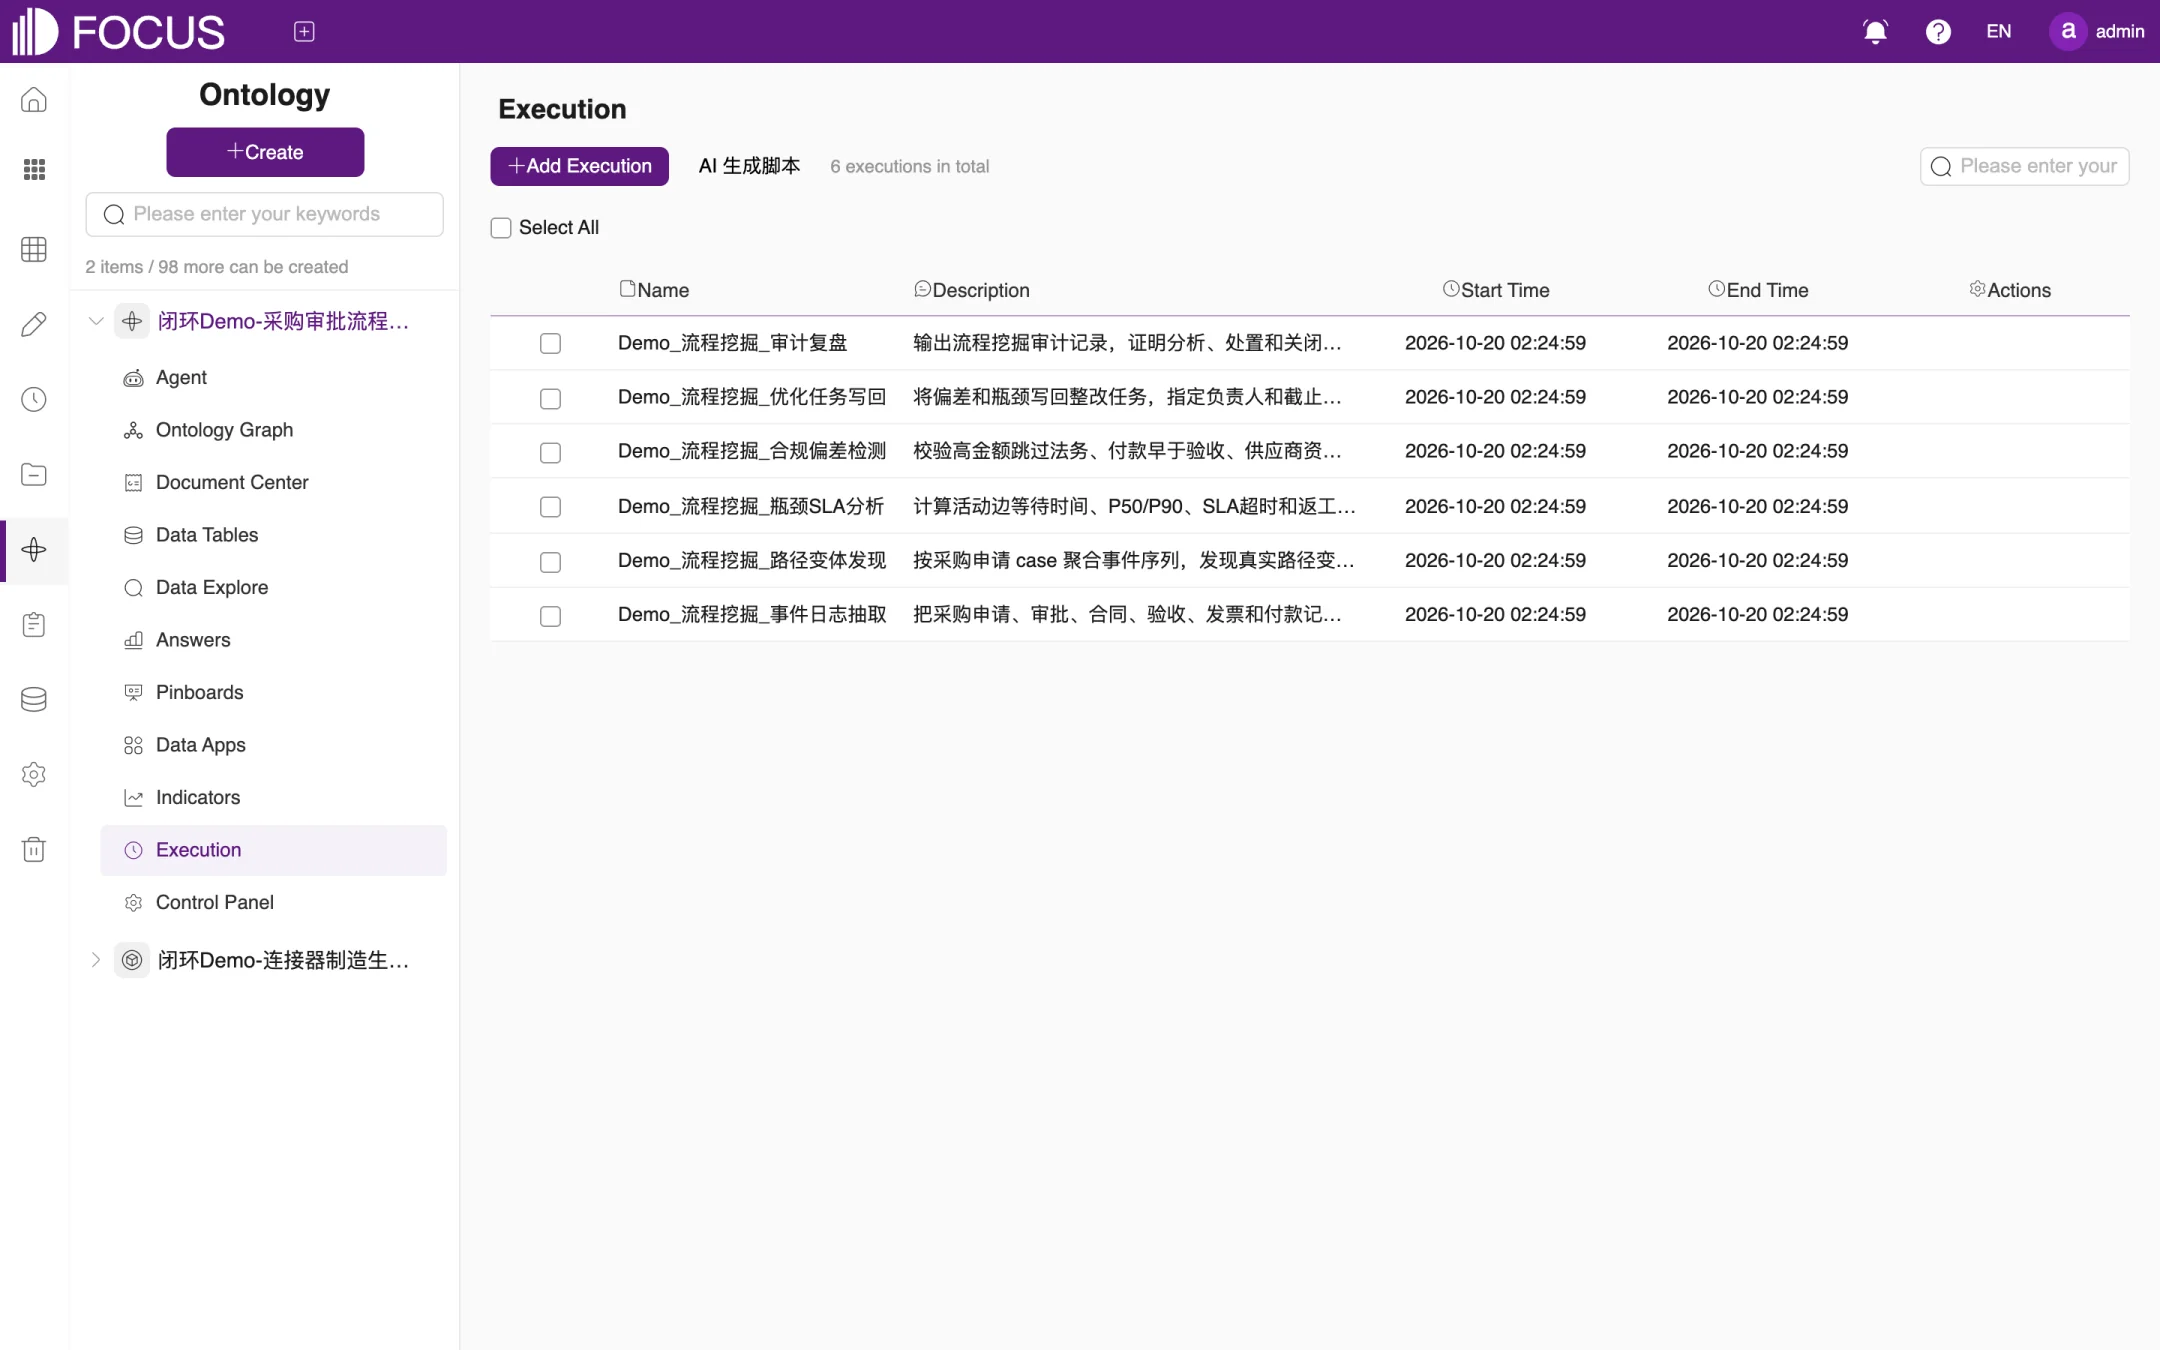
Executions are Python scripts that the agent or a user can trigger to perform calculations, checks, write-backs and similar operations. The Execution module lists the ontology's executions with their Description, Start Time and End Time, as shown in Figure 10-12. For example, Demo_流程挖掘_合规偏差检测 (process mining – compliance deviation check) in the sample ontology checks for deviations such as high-value requests that skipped legal review or payments made before goods acceptance.
Figure 10-12. Execution
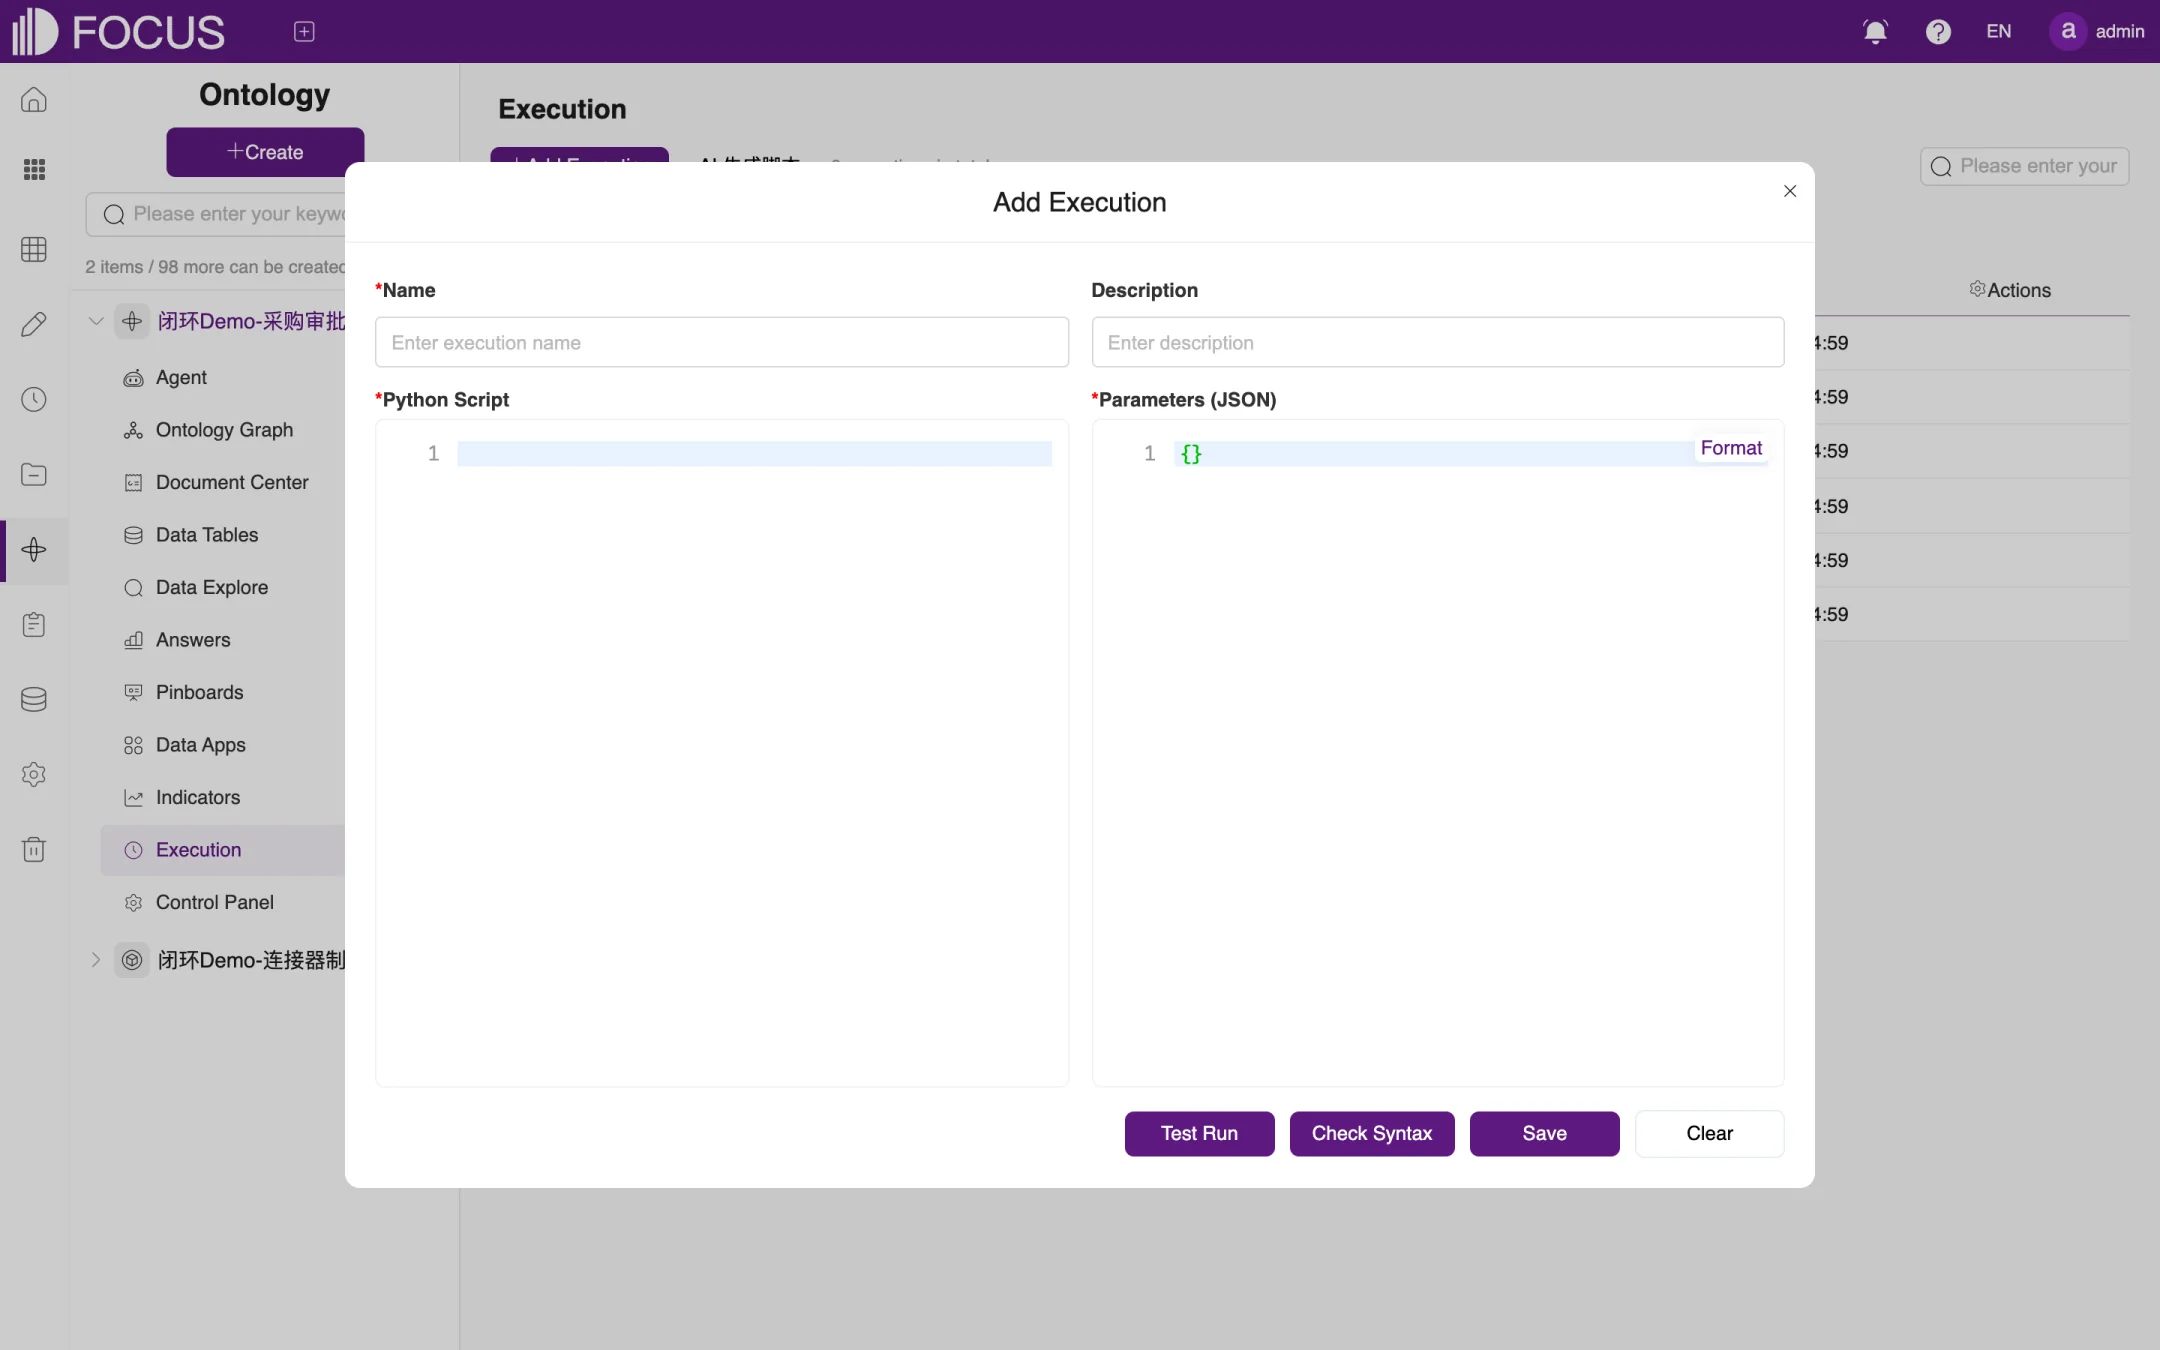
Click Add Execution to open the Add Execution window, as shown in Figure 10-13:
Enter a Name and a Description.
Write the script under Python Script and enter the run parameters under Parameters (JSON). Click Format to tidy up the JSON.
Click Check Syntax to check the script, and Test Run to try it out.
When everything is correct, click Save. Clear empties the form.
You can also click AI 生成脚本 ("AI-generate script") next to Add Execution, describe what the script should do, and let AI write a draft. Then check and save it as described above.
Figure 10-13. Add Execution
Note: Executions actually read or change data. Save a script only after a test run has confirmed that its results are correct, and grant it only to the people who need it.
10.10Control Panel
A control panel is an operations view for business users. It shows the ontology's data as cards and offers business actions that can be run directly from the panel. The Control Panel module lists each panel's name, description, task goal, cards and sync status, as shown in Figure 10-14. Apart from Actions, the list is in Chinese in the English UI: the column headers read 名称 (Name), 说明 (Description), 任务目标 (Task goal) and 卡片 (Cards, which shows the sync status, such as 已同步 "Synced").
Click 新增控制面板 ("New control panel") to create a panel yourself, or AI 生成控制面板 ("AI-generate control panel") to have one generated from a description;
In the Actions column, whose icons appear when you point to a row, the eye icon opens the panel; the other icons open the panel's cards and edit the panel.
Figure 10-14. Control panel list
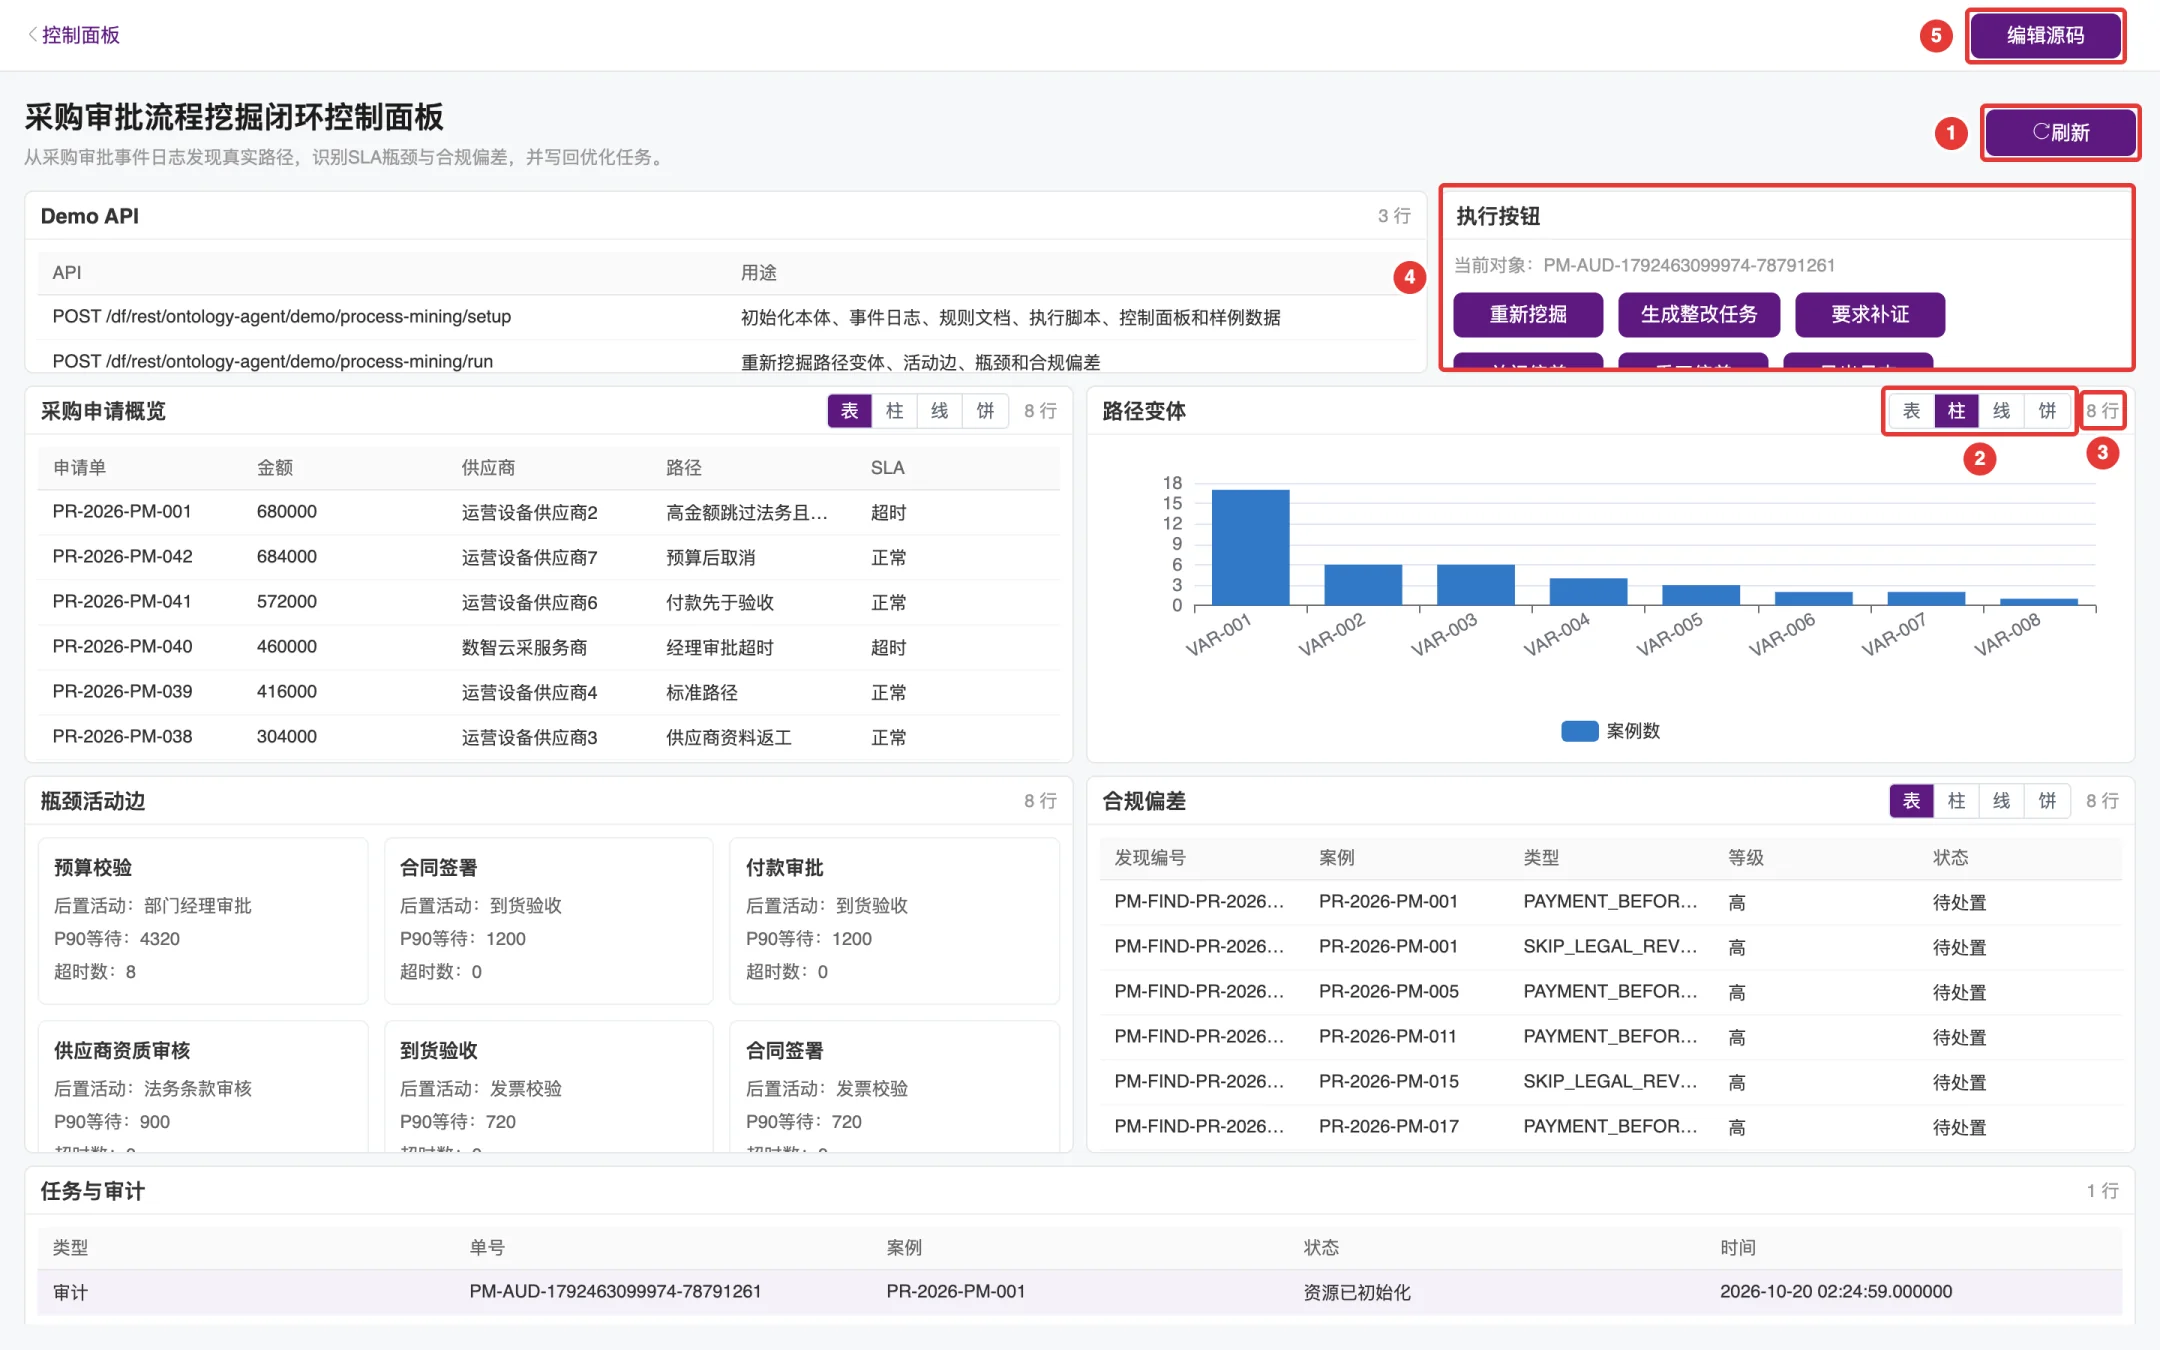
Click the eye icon of a panel in the list to open it, as shown in Figure 10-15. The panel view is entirely in Chinese. The sample panel 采购审批流程挖掘闭环控制面板 (purchase approval process mining closed-loop control panel) contains cards such as 采购申请概览 (purchase request overview), 路径变体 (path variants), 瓶颈活动边 (bottleneck activity edges), 合规偏差 (compliance deviations) and 任务与审计 (tasks and audit):
① 刷新 ("Refresh"): queries all cards again to get the latest data.
② Display mode: switches between 表, 柱, 线 and 饼, that is, table, column chart, line chart and pie chart. In the figure, the 路径变体 card has been switched to a column chart. The switch only changes the current view; when you open the panel again, each card returns to its original display mode.
③ Rows: the number of rows of data in the card (for example "8 行", 8 rows).
④ 执行按钮 ("Action buttons"): lists the business actions you can run. The sample panel has 重新挖掘 (re-mine), 生成整改任务 (create remediation task), 要求补证 (request supporting evidence), 关闭偏差 (close deviation), 重开偏差 (reopen deviation) and 导出日志 (export log). 当前对象 ("current object") shows the record that an action will process. Click a record in any card, for example the case PR-2026-PM-005 in 合规偏差, and the current object changes to that record; then click the action you want to run.
⑤ 编辑源码 ("Edit source"): opens the panel editing page, where you can change the panel's name, description, task goal and source code (JSON). You can also use AI 修改当前面板 ("AI-modify current panel") to generate a draft change, then validate and preview it before applying it.
Figure 10-15. Viewing a control panel
Note: The action buttons really perform the business action, such as creating a remediation task or closing a deviation, on the current object. Before you click one, make sure the current object is the record you intend to process.
Chapter 11Operate Logs
Operate Logs records the operations performed in the system, such as logins, table imports, new projects and pinboard changes, for auditing and troubleshooting. Viewing the logs requires the log manager (LOG_MANAGER) or system administrator (SYSTEM_MANAGER) role.
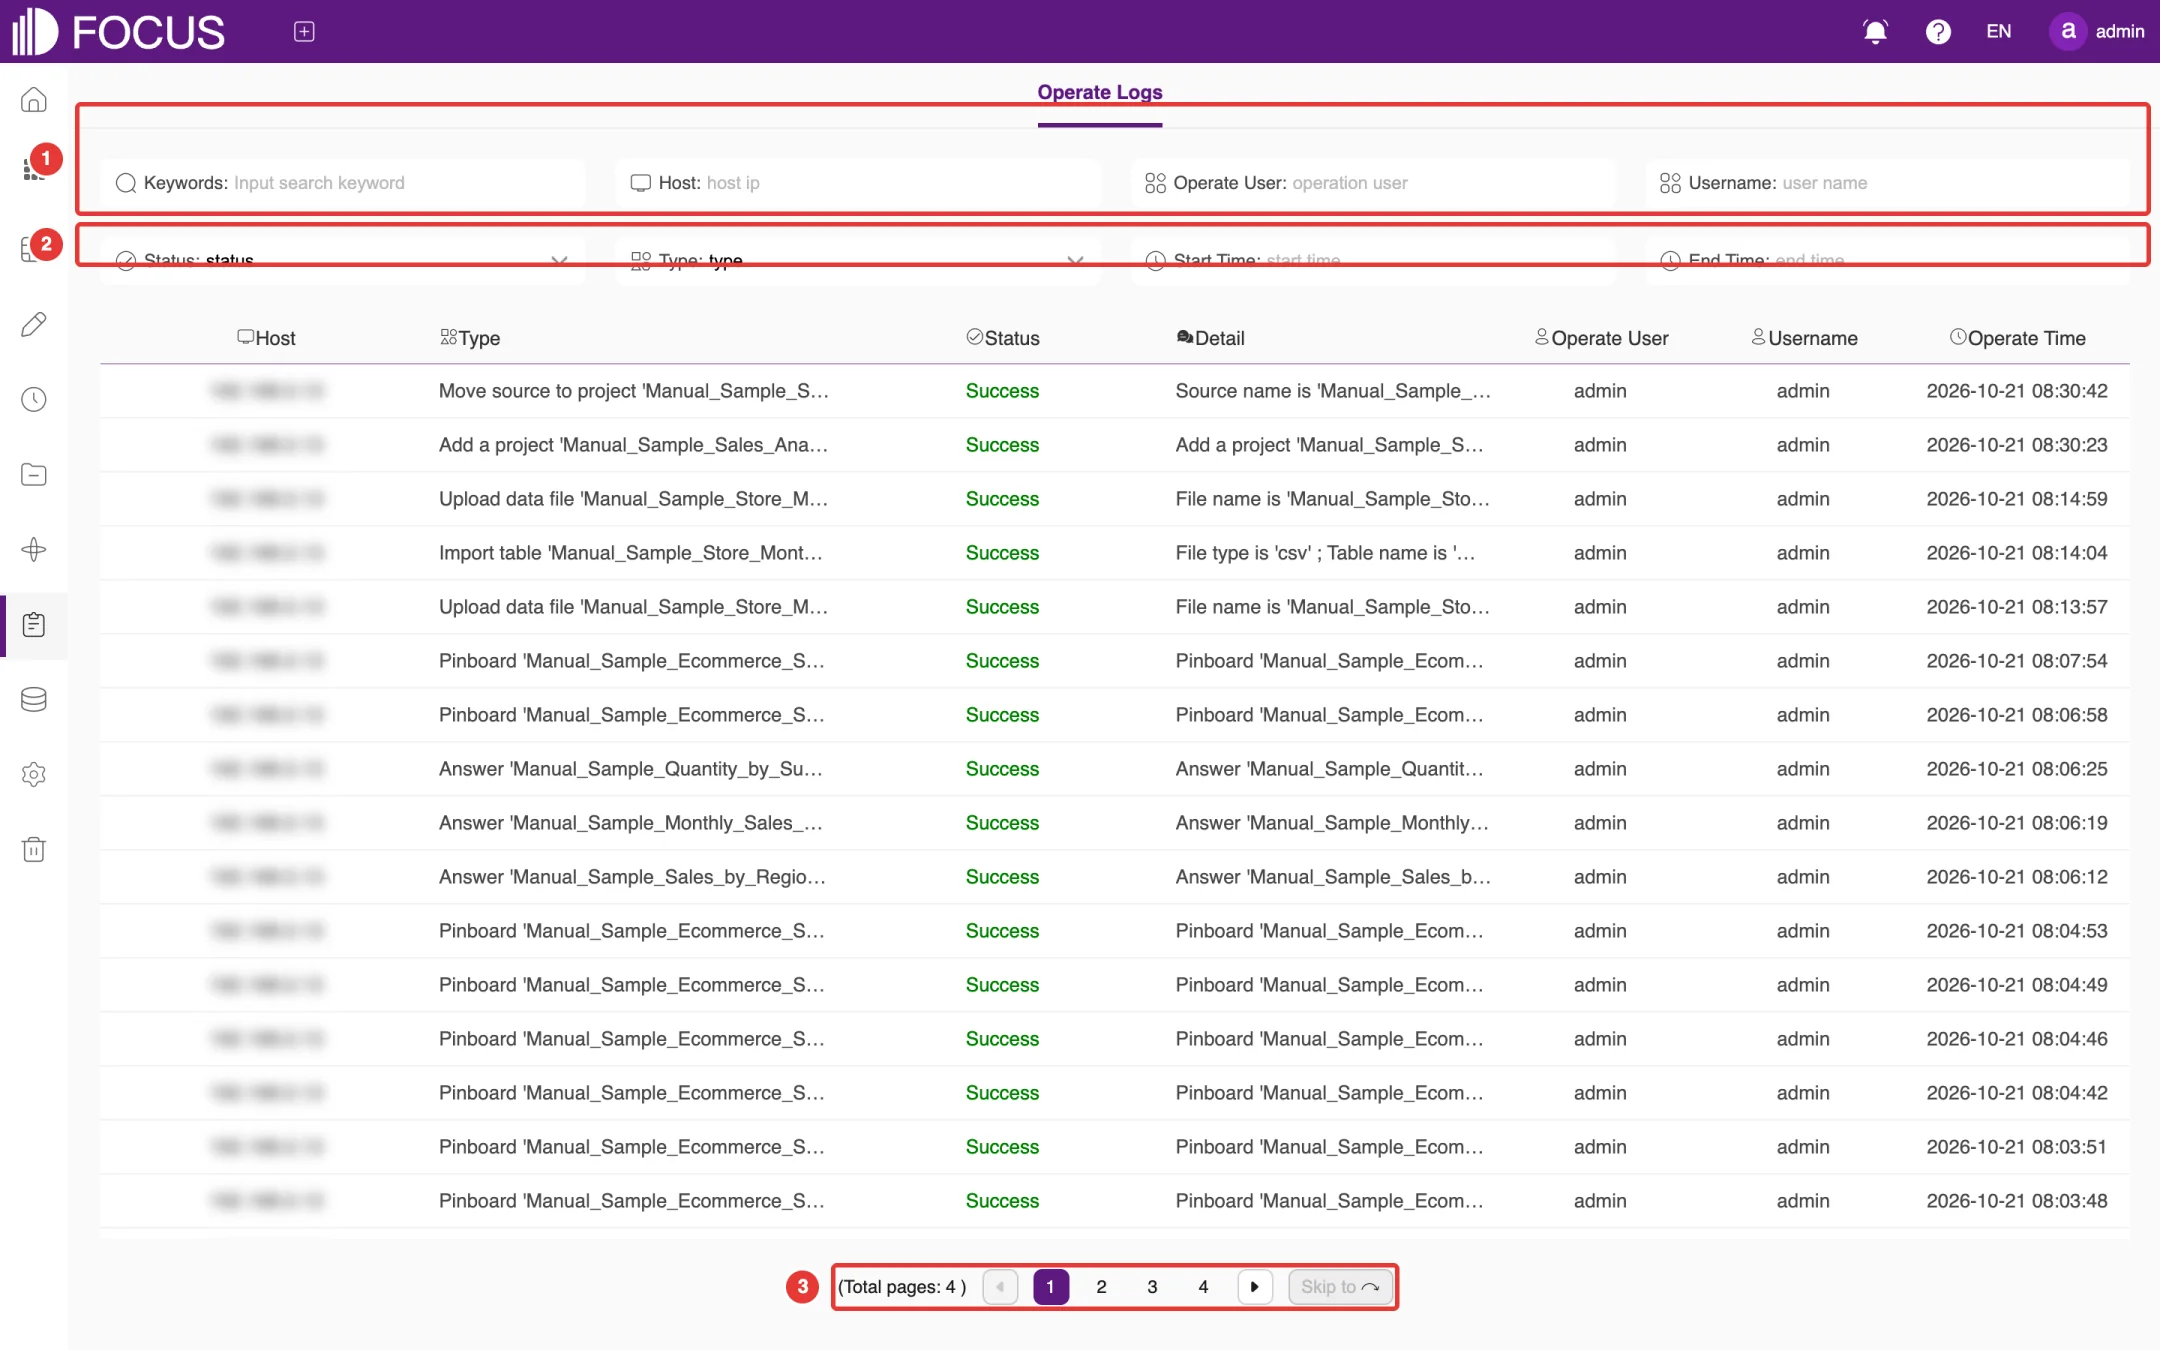
Click Logs in the left menu to open the Operate Logs page, as shown in Figure 11-1:
① Filters: filter by Keywords, Host, Operate User or Username;
② More filters: filter by Status (success or failure), Type, Start Time and End Time;
③ Pages: the bottom of the list shows the total number of pages. Click a page number or the arrows to move between pages, or use Skip to to jump to a page.
Figure 11-1. Operate Logs
Each log entry shows the Host, Type, Status, Detail, Operate User (the account), Username (the person's name) and Operate Time. Type names the operation and the object it acted on, for example Import table 'Manual_Sample_Store_Monthly_Sales' or Add a project 'Manual_Sample_Sales_Analysis'; Detail adds the specifics, such as the file type and table name of an import.
Tip: To investigate login problems, set Type to login operations and Status to failure, then read the reason for each failure, for example an incorrect username or password.
Chapter 12Data Governance
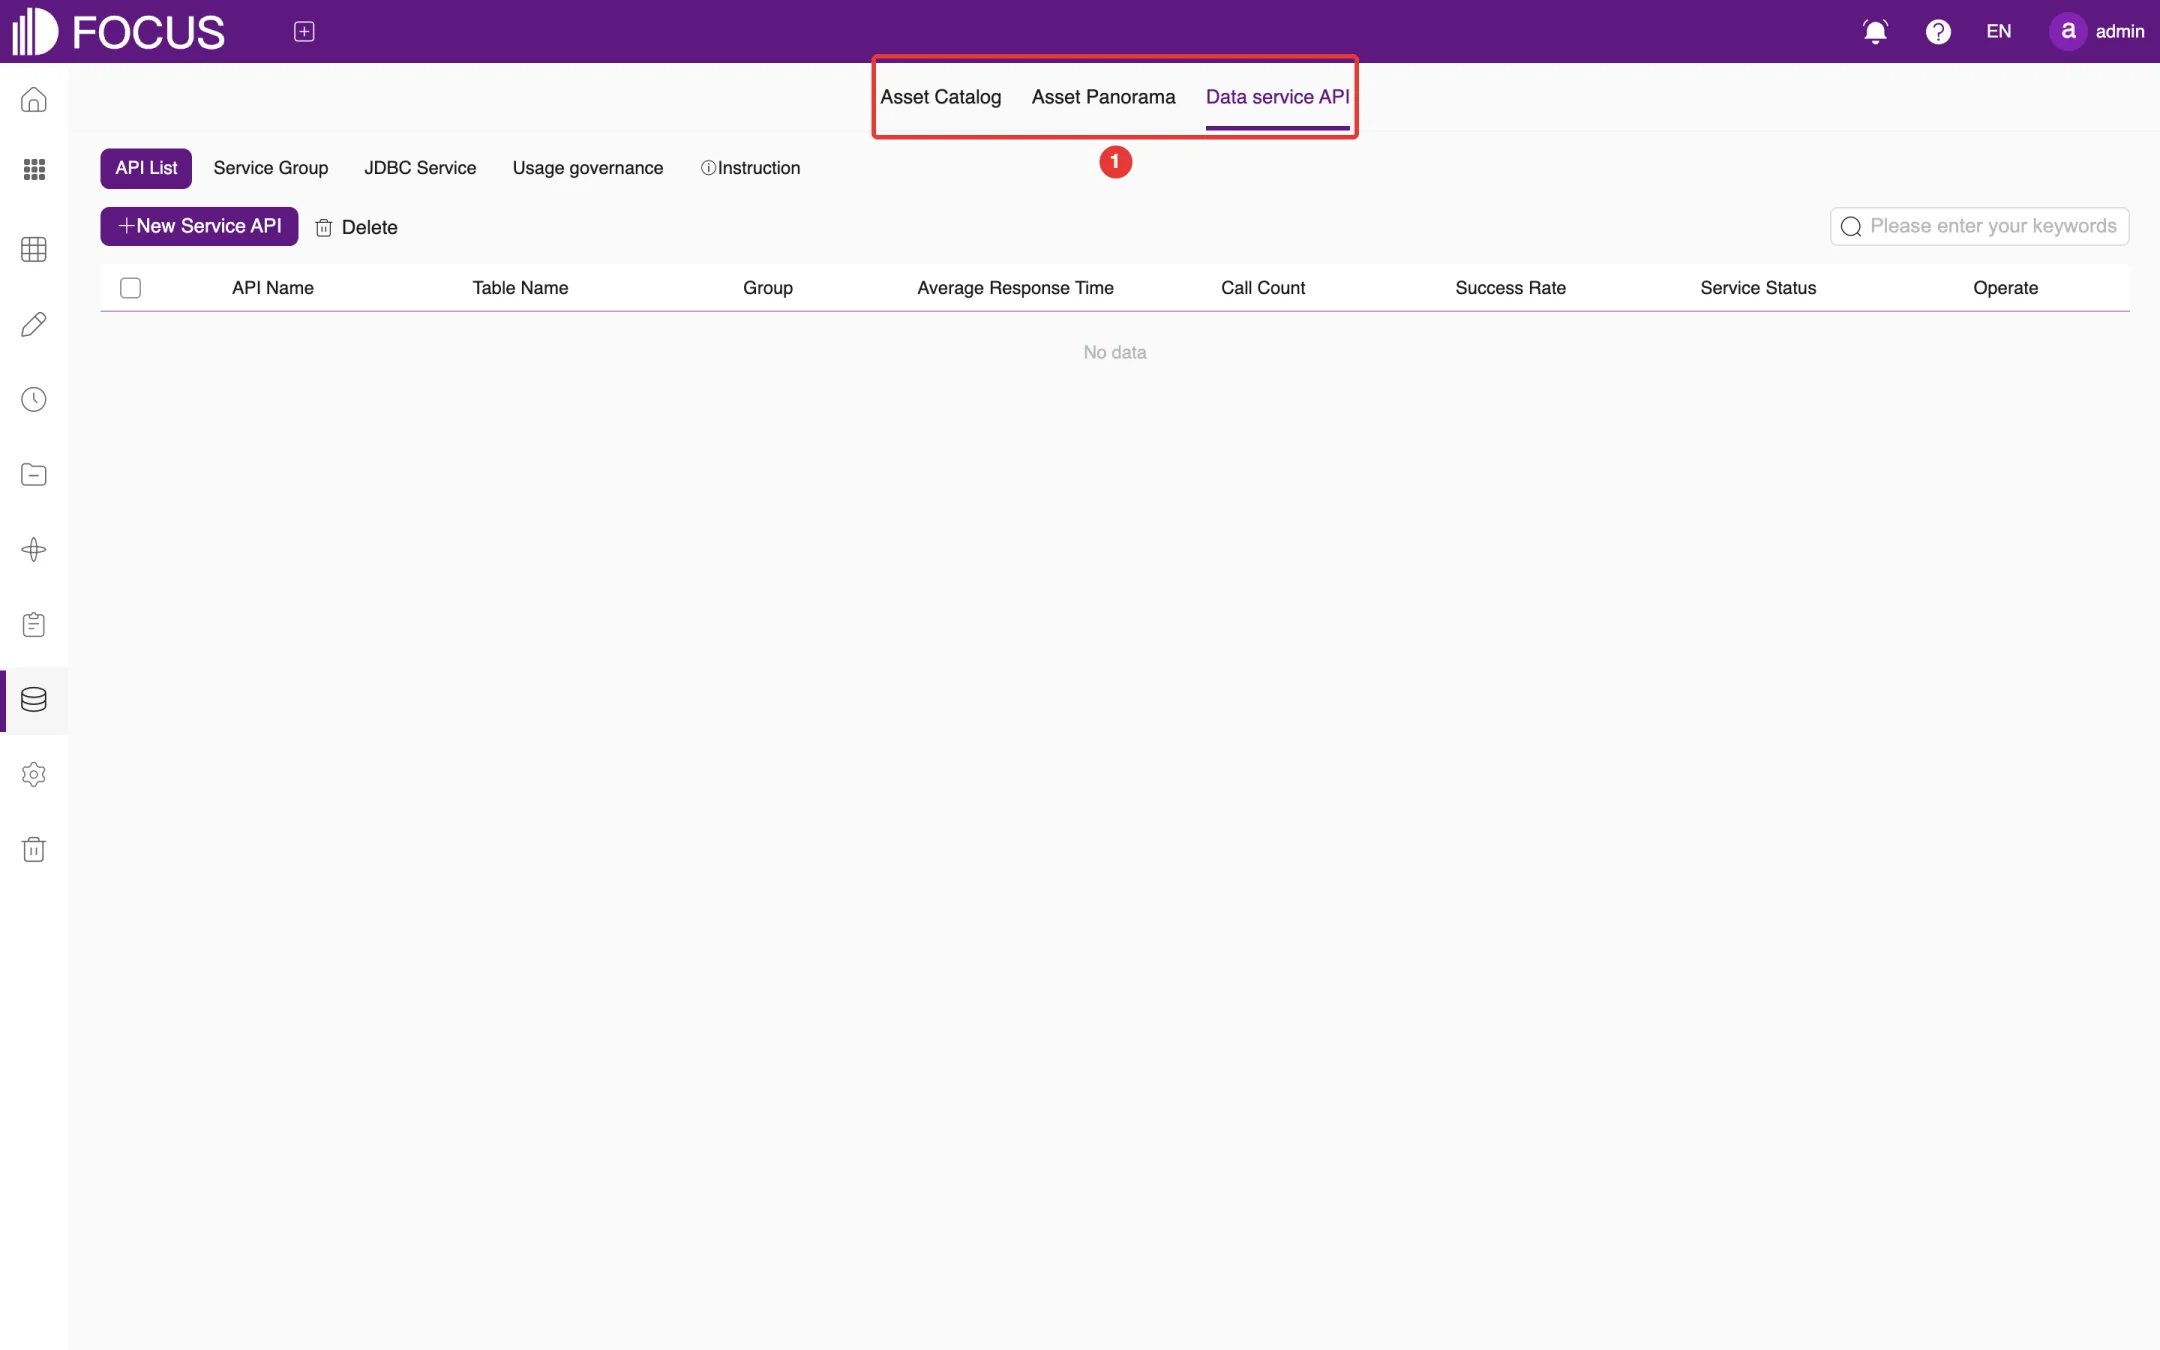
Data governance gives administrators an overview of the data assets in the system and lets them provide data safely to other systems through APIs or JDBC. The page has three tabs at the top: Asset Catalog, Asset Panorama and Data service API.
Click Data in the left menu to open this module.
12.1Asset Catalog
Asset Catalog shows all tables grouped by data source. The tree on the left lists the data sources (such as Local and DataFocus system Doris) and the number of tables in each. The cylinder icon in the middle shows the selected data source's total number of tables, the number of tables that have relationships, and the number of isolated tables. On the right, the tables of the data source are listed as cards; click more on a card to see the table's details. Use the search box in the upper-left corner to find a table.
12.2Asset Panorama
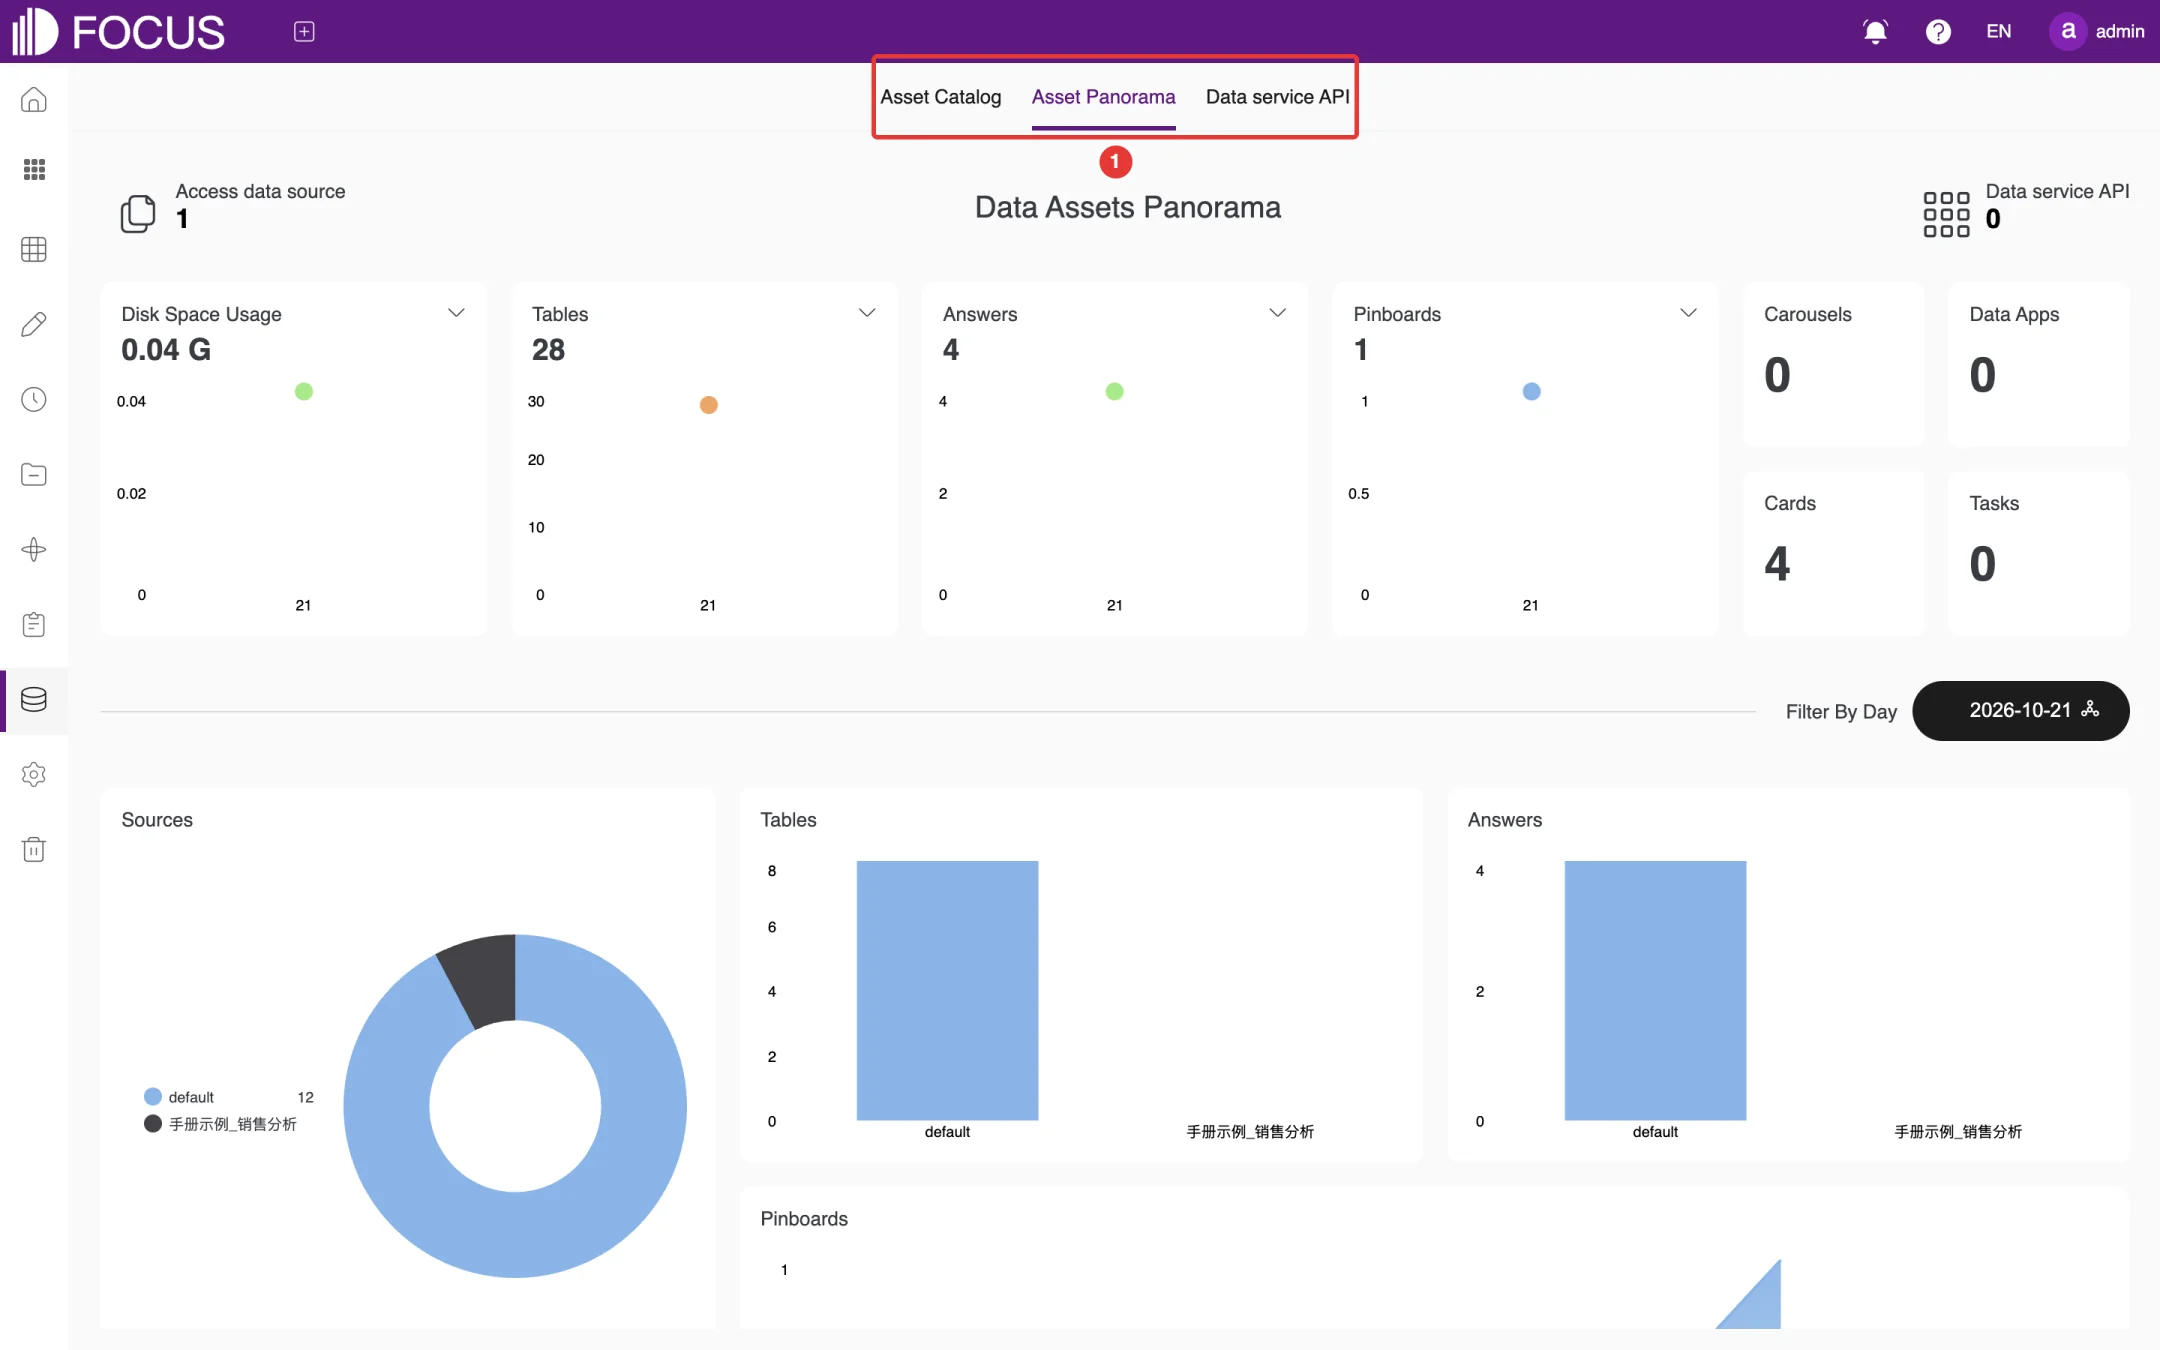
Asset Panorama shows the overall state of the data assets in charts, as shown in Figure 12-1: Access data source, Disk Space Usage, Tables, Answers, Pinboards, Carousels, Data Apps, Cards, Tasks and Data service API. For the statistics that have a drop-down, you can choose the time range (for example, the last 30 days). In the lower part of the page, use Filter By Day to see the details for a given day, such as the total number of resources.
Figure 12-1. Asset Panorama
12.3Data service API
Data service API publishes tables in the system as APIs that other systems can call, as shown in Figure 12-2. It has the sub-tabs API List, Service Group, JDBC Service, Usage governance and Instruction.
Figure 12-2. Data service API
12.3.1Add a data API
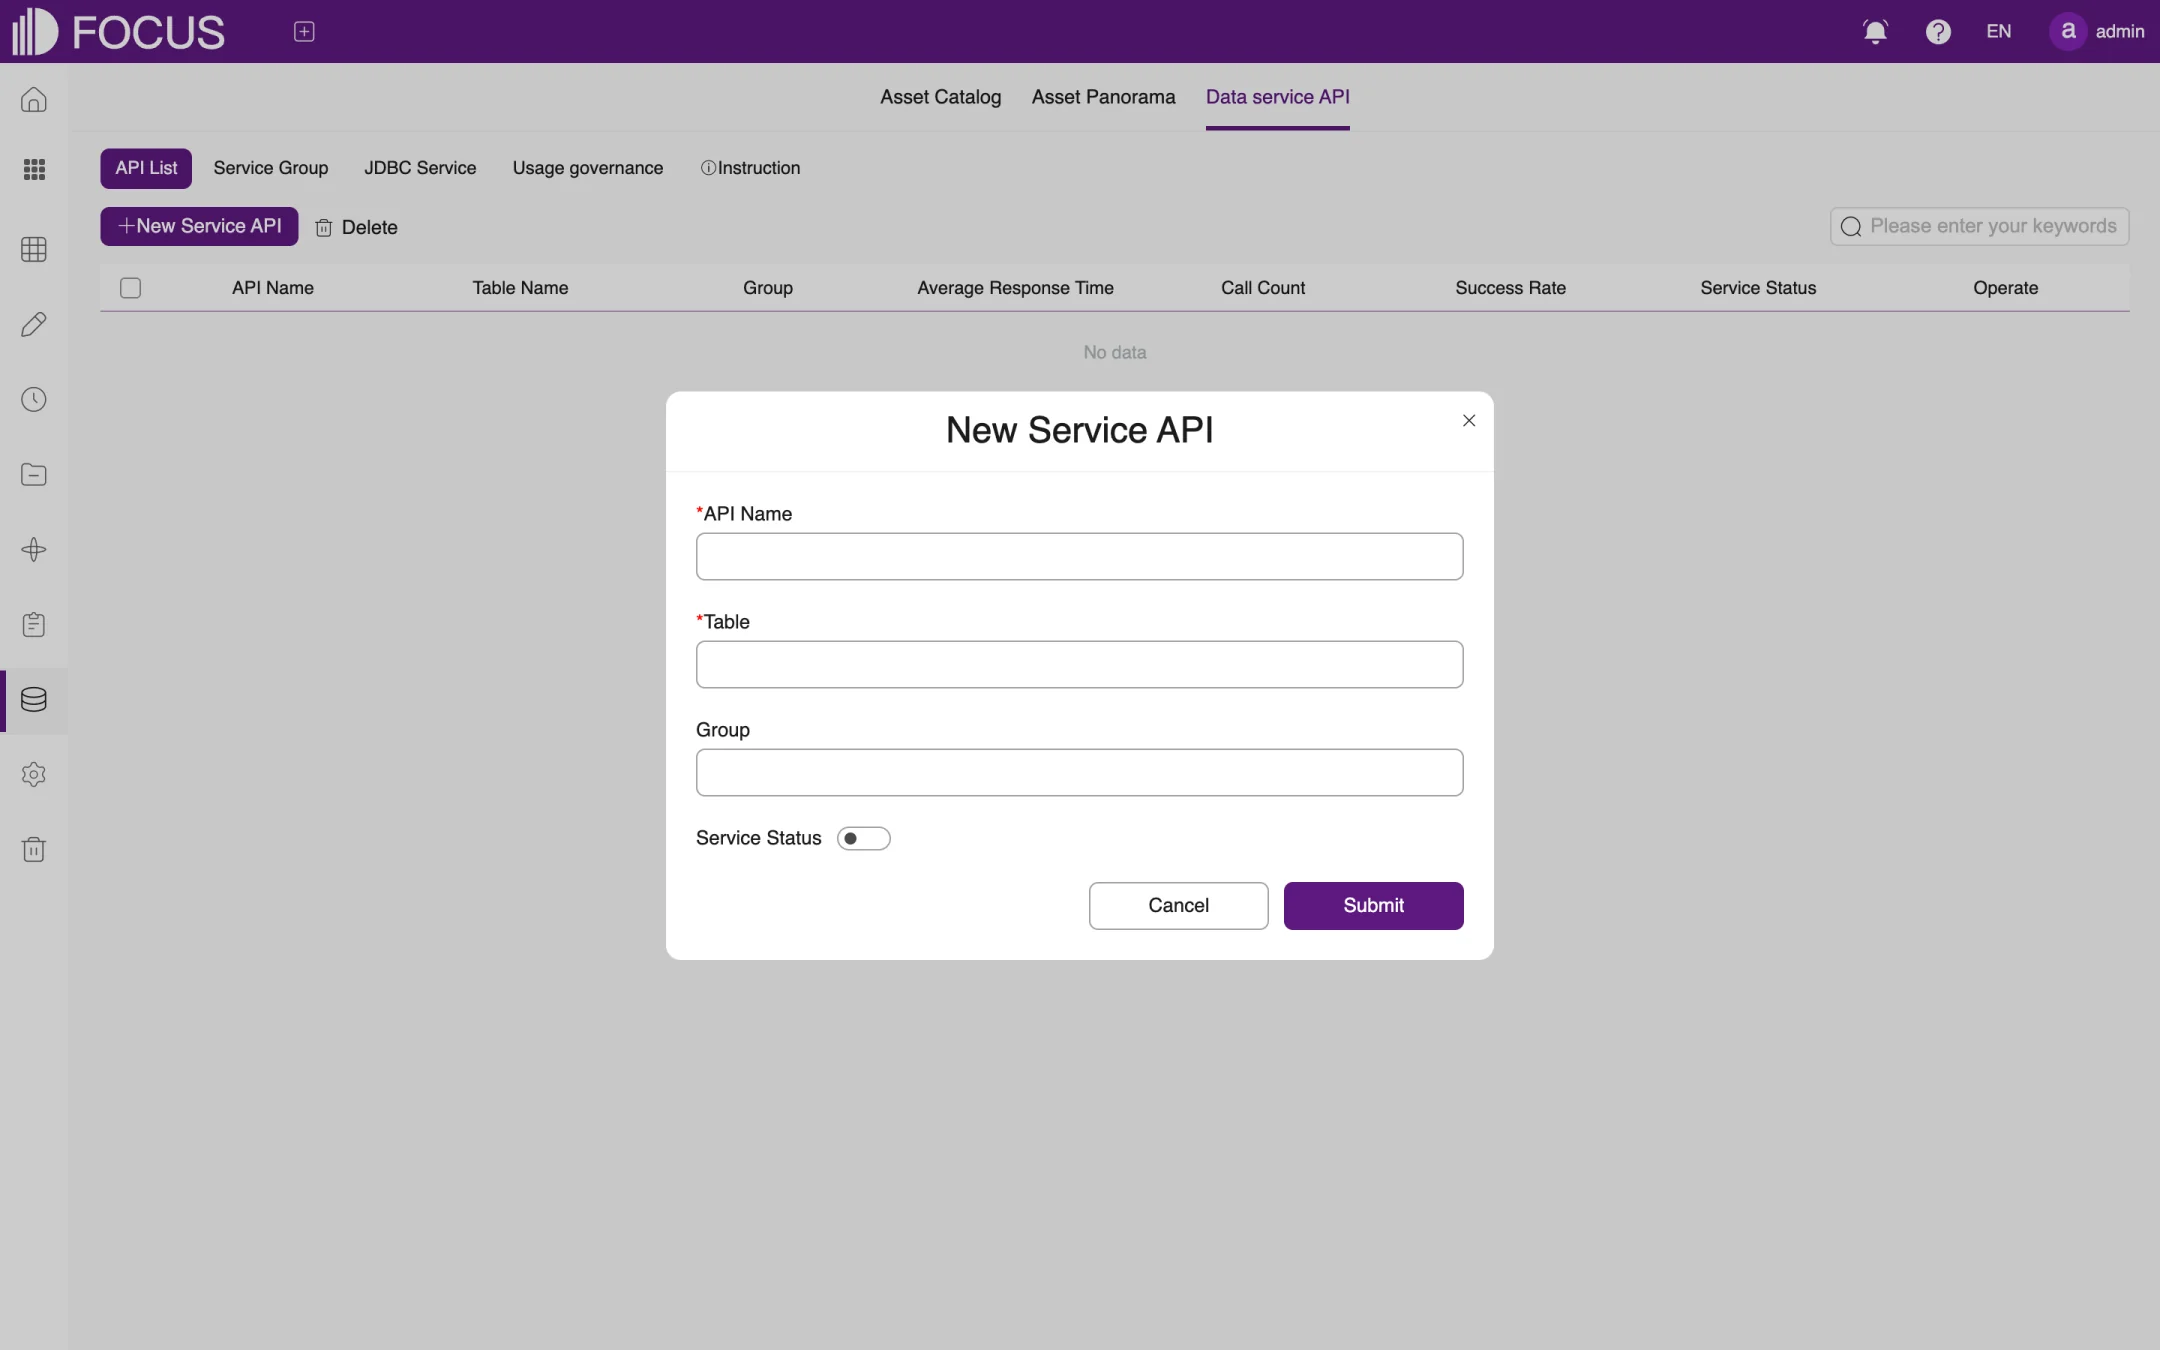
On the API List tab, click New Service API to open the New Service API window, as shown in Figure 12-3.
Enter the API Name (1 to 45 characters).
Choose the Table to publish and the Group the API belongs to (groups are maintained on the Service Group tab).
Turn Service Status on or off, and click Submit.
Figure 12-3. New Service API
Once the API is published, the list shows its Table Name, Group, Average Response Time, Call Count, Success Rate and Service Status. Usage governance is where you view and control how much each API is called, and Instruction explains how to call the APIs.
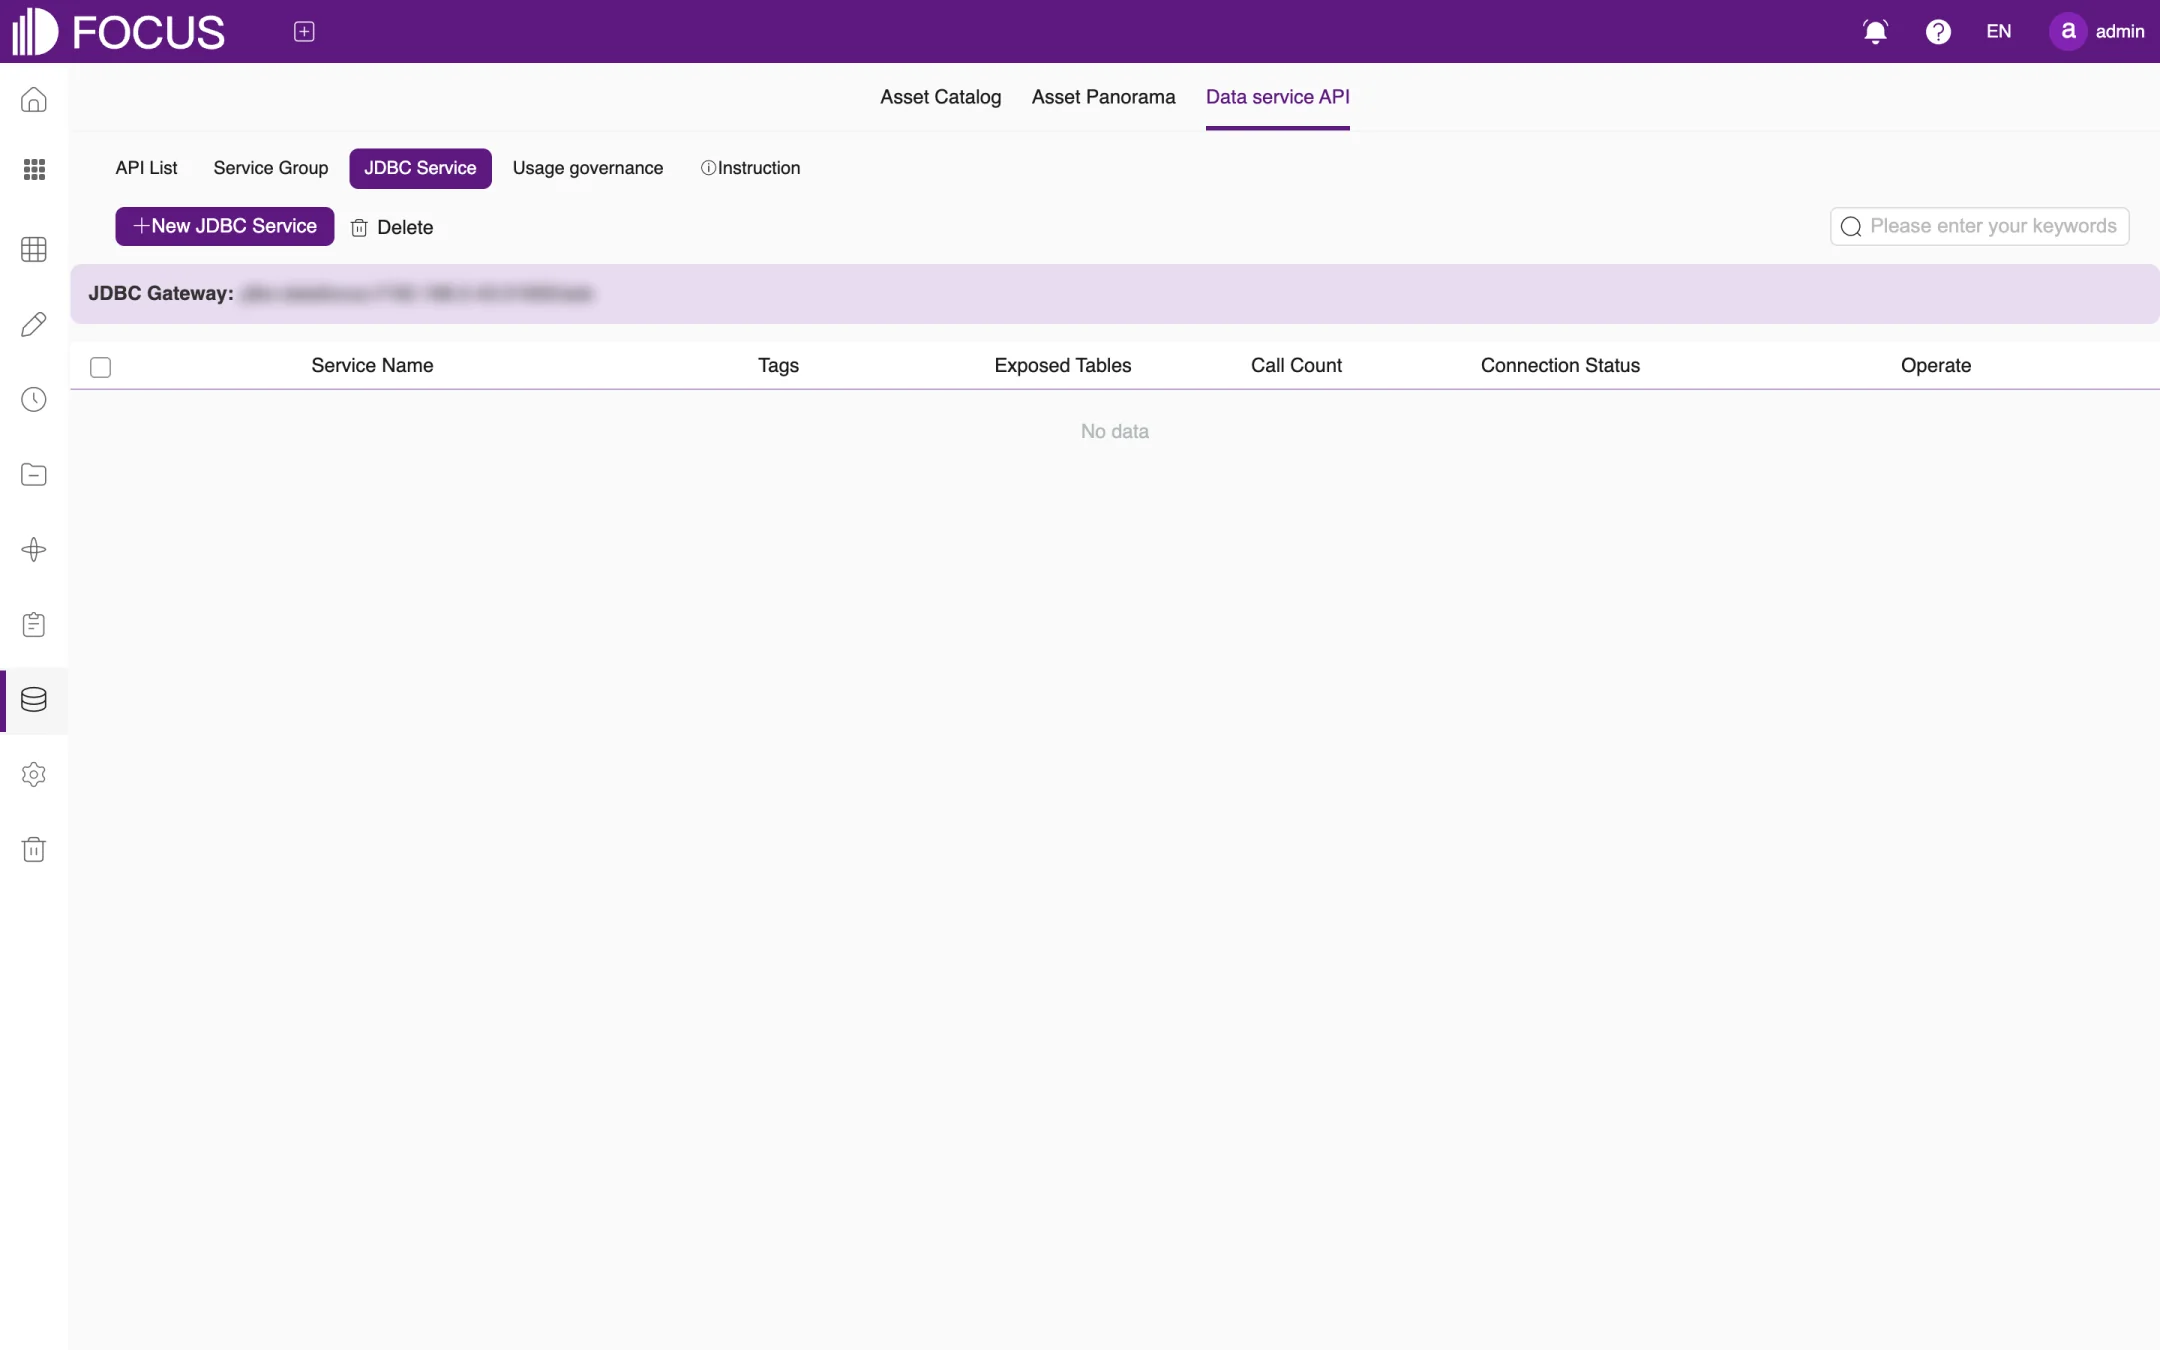
12.3.2JDBC Service
JDBC Service lets BI tools and programs read tables in the system through a JDBC connection, as shown in Figure 12-4. The top of the page shows the system's JDBC Gateway address. Click New JDBC Service and set the service name and the tables to expose. The list shows each service's Tags, Exposed Tables, Call Count and Connection Status.
Figure 12-4. JDBC Service
Note: Before providing data to other systems, make sure you expose only the tables that are needed, and set up access credentials as required under Admin > Interface authentication.
Chapter 13Admin
Admin is for system administrators. Here you manage users, roles and permissions and configure the system. Click Admin in the left menu to open this module.
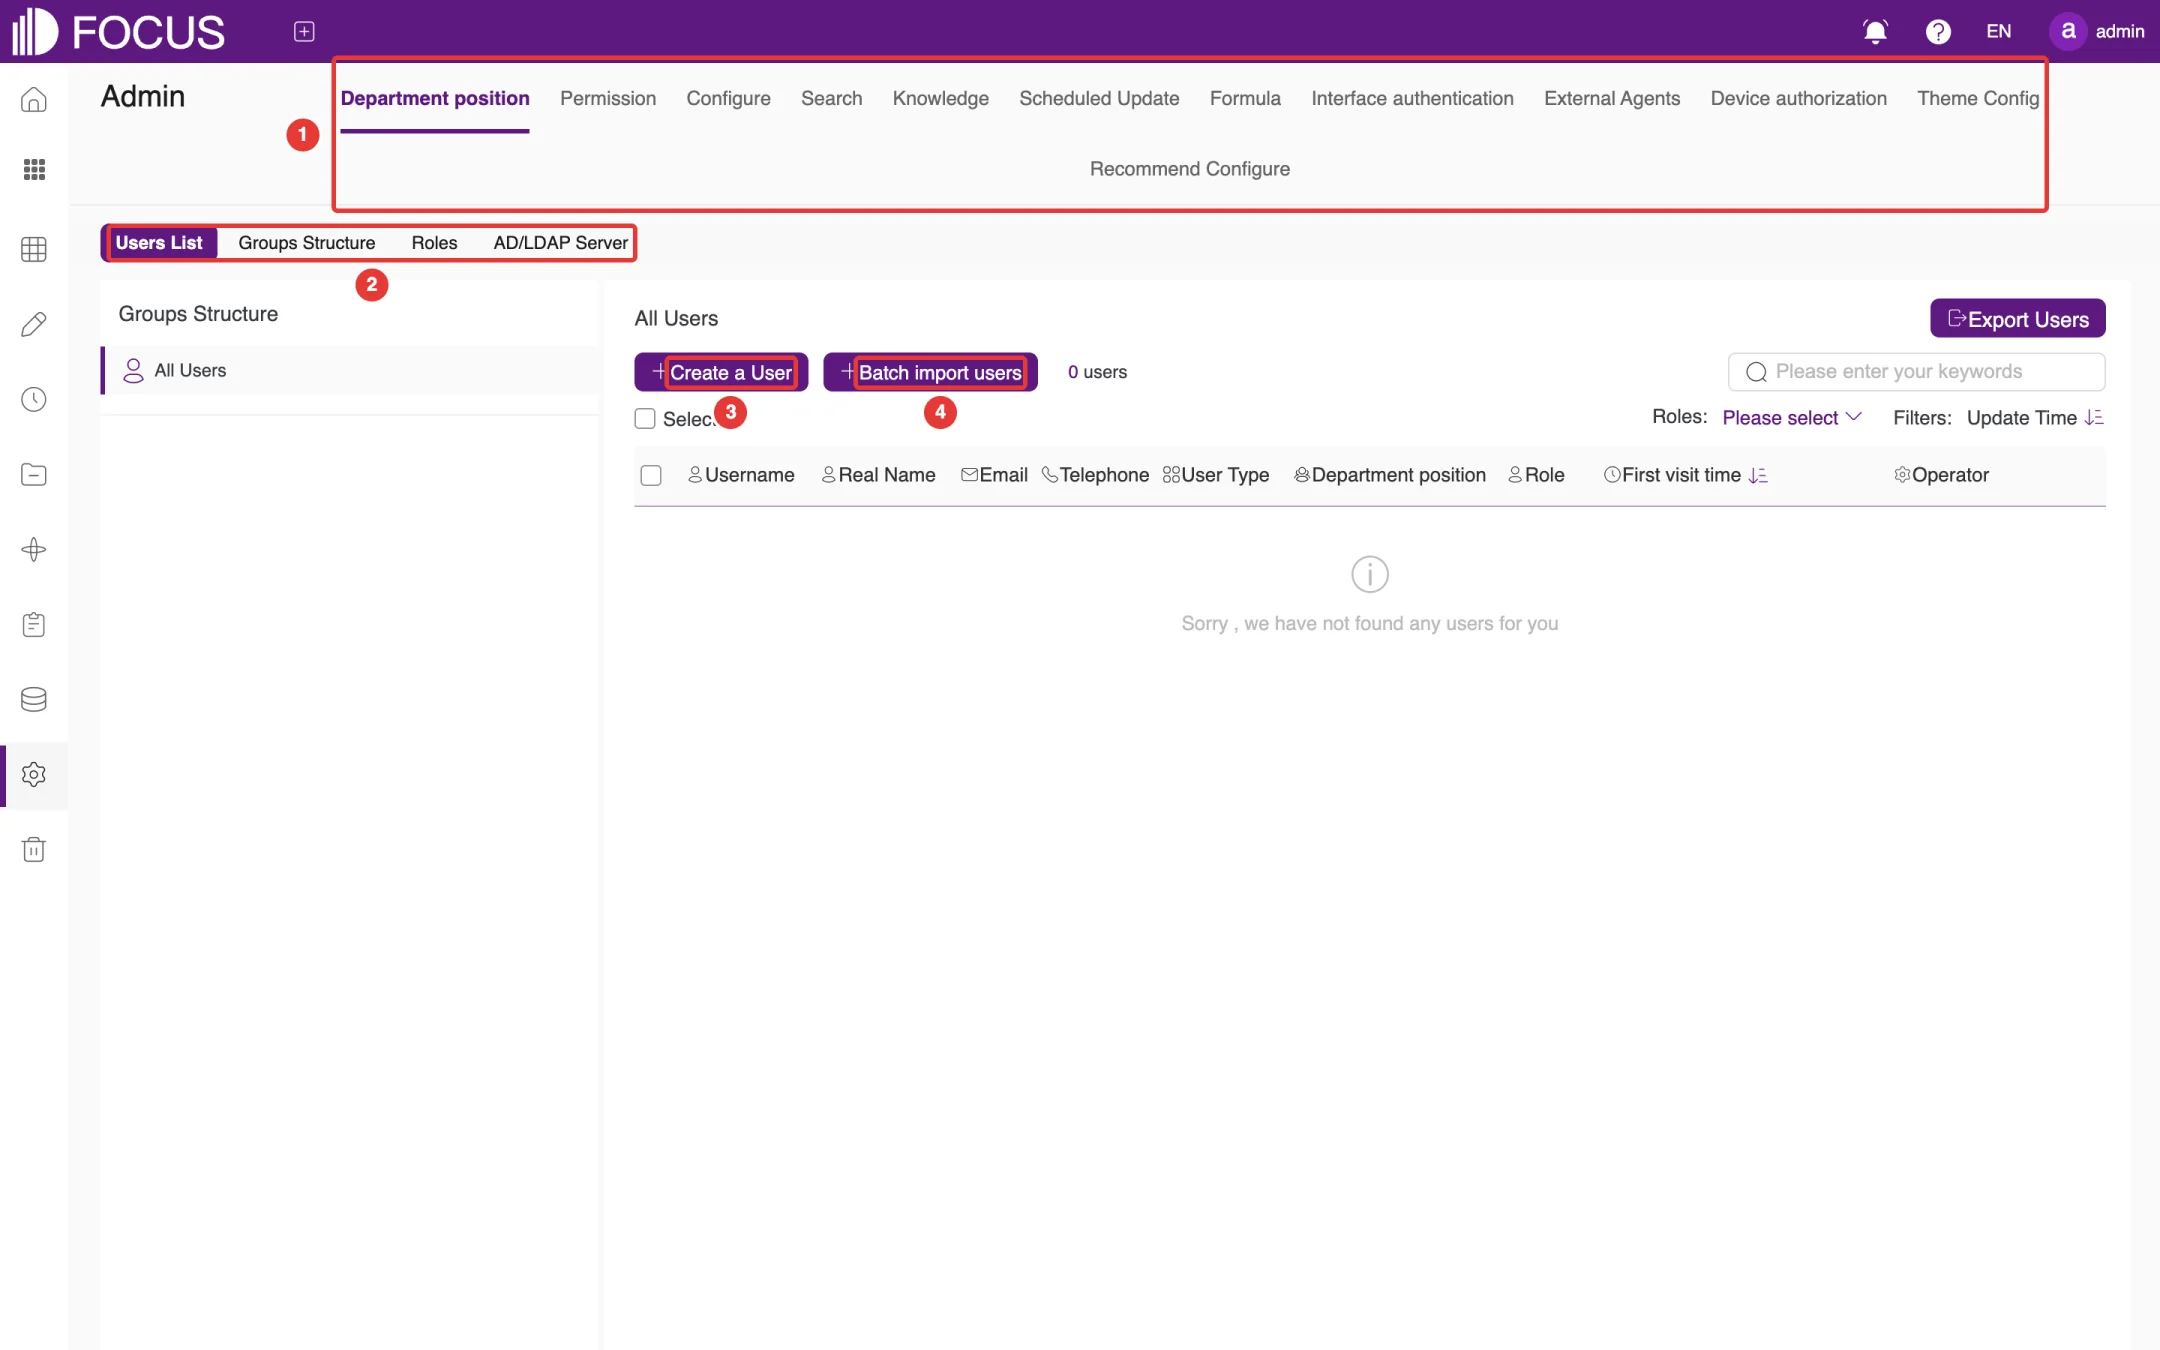
The top of the page has 12 tabs, marked ① in Figure 13-1: Department position, Permission, Configure, Search, Knowledge, Scheduled Update, Formula, Interface authentication, External Agents, Device authorization, Theme Config and Recommend Configure.
13.1Department position
The Department position tab has the four sub-tabs marked ②: Users List, Groups Structure, Roles and AD/LDAP Server.
13.1.1Users
Users List shows the users in the system. You can filter them by role (Roles), search by name, and click Export Users to export the user list, as shown in Figure 13-1.
Figure 13-1. Users List
To add a user:
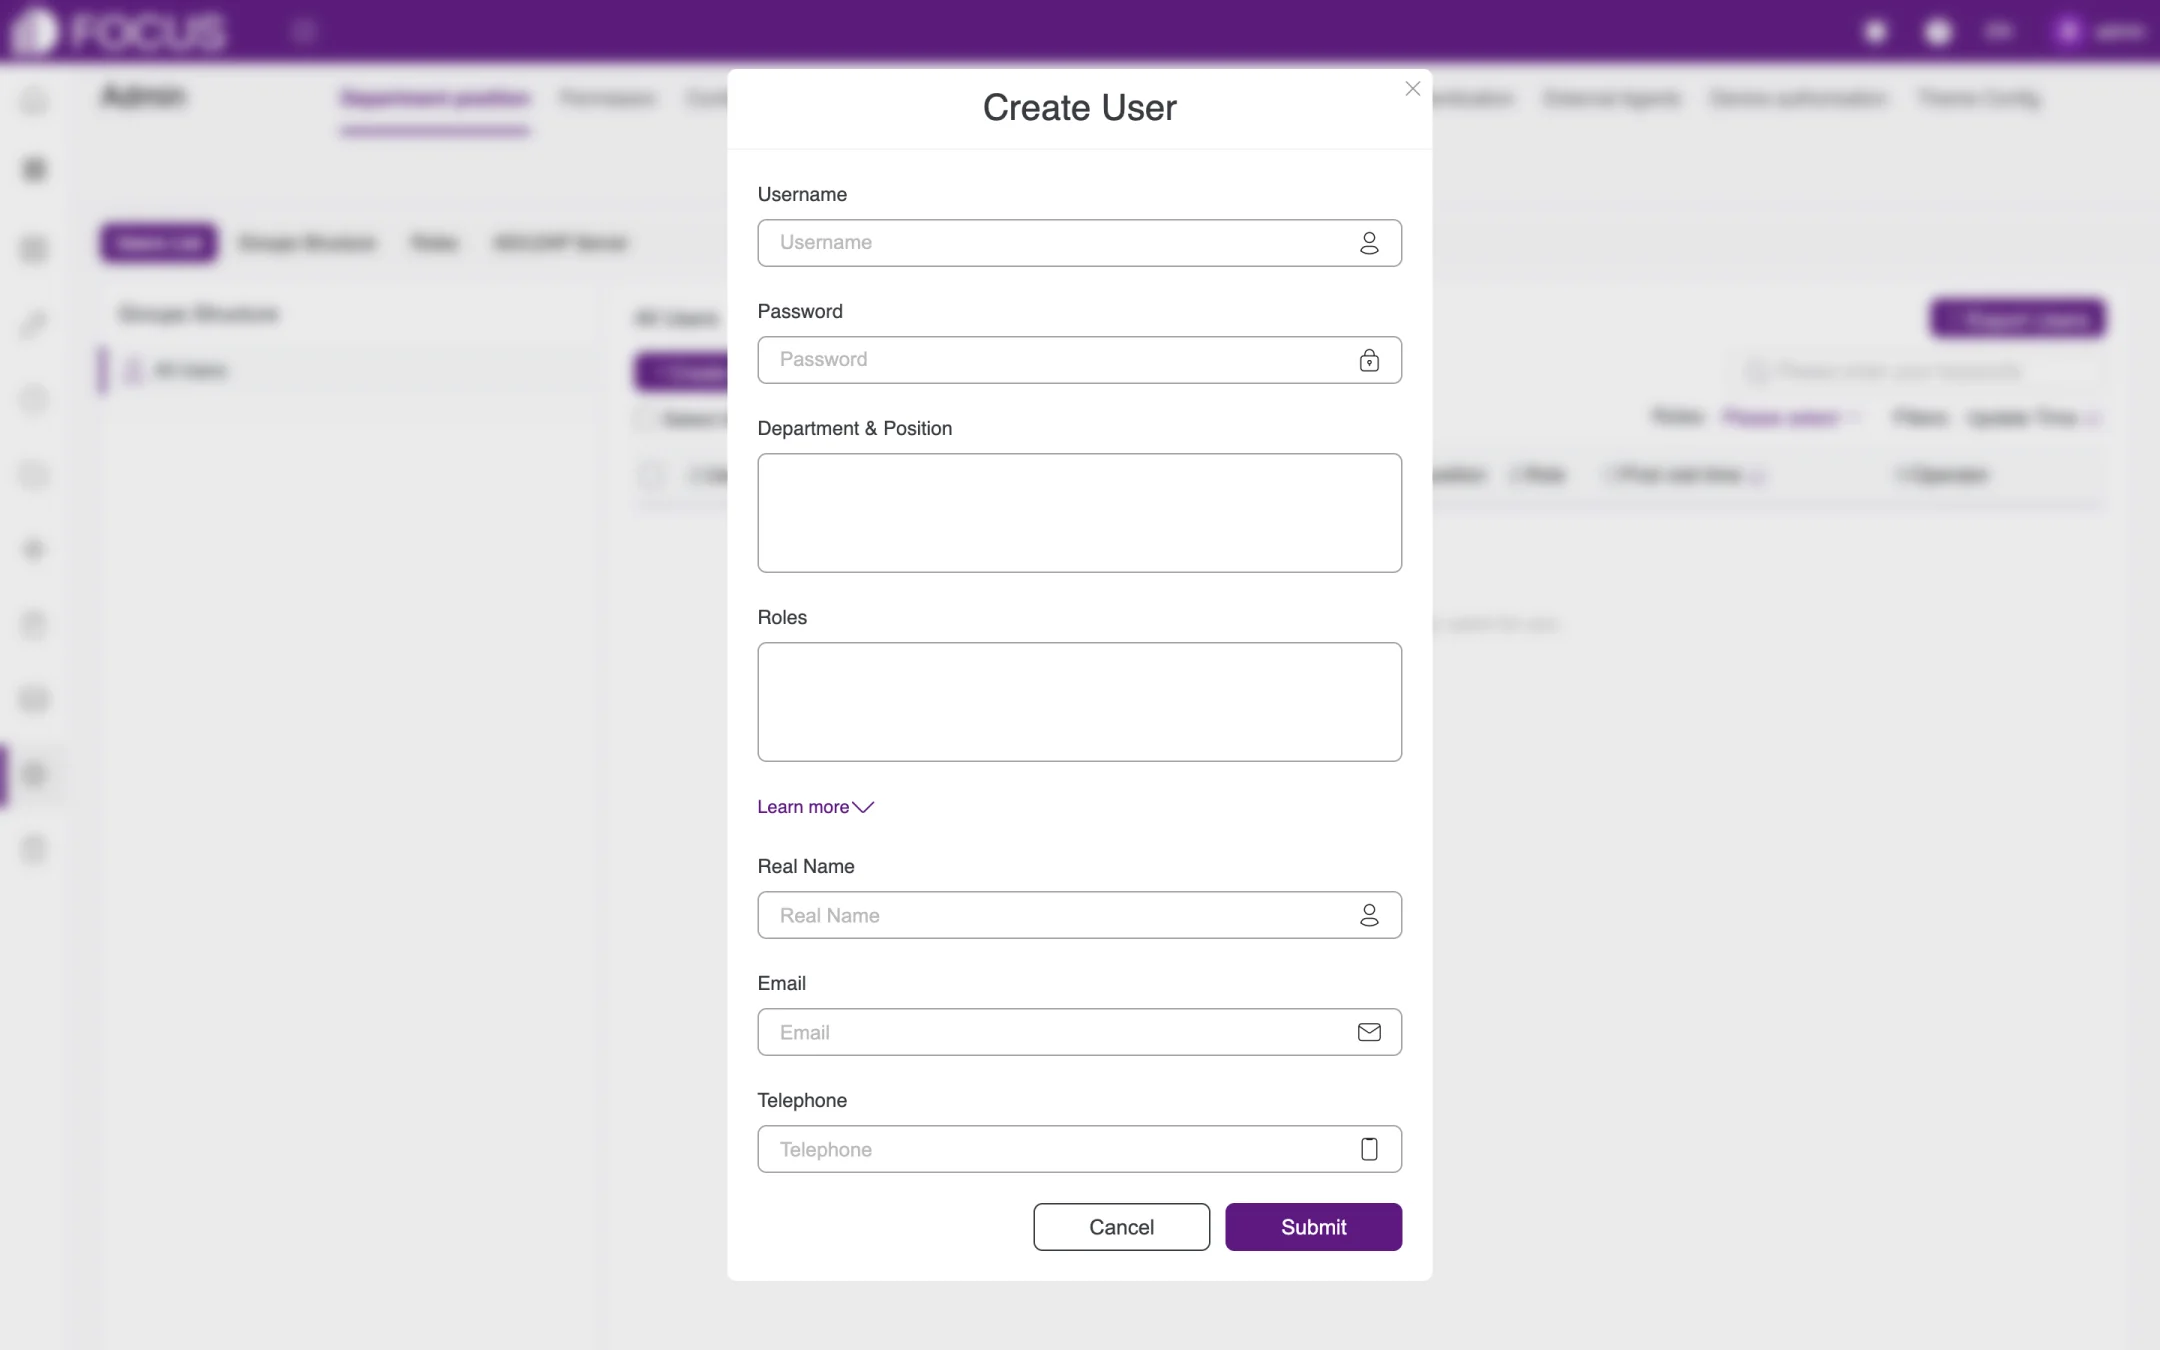
Click Create a User (③) to open the Create User window, as shown in Figure 13-2.
Enter the Username and an initial Password.
Choose the user's Department & Position and Roles.
Click Learn more to expand the optional fields Real Name, Email and Telephone.
Click Submit.
To import users in bulk: click Batch import users (④), fill in the user details according to the template, and import them all at once.
Figure 13-2. Create User
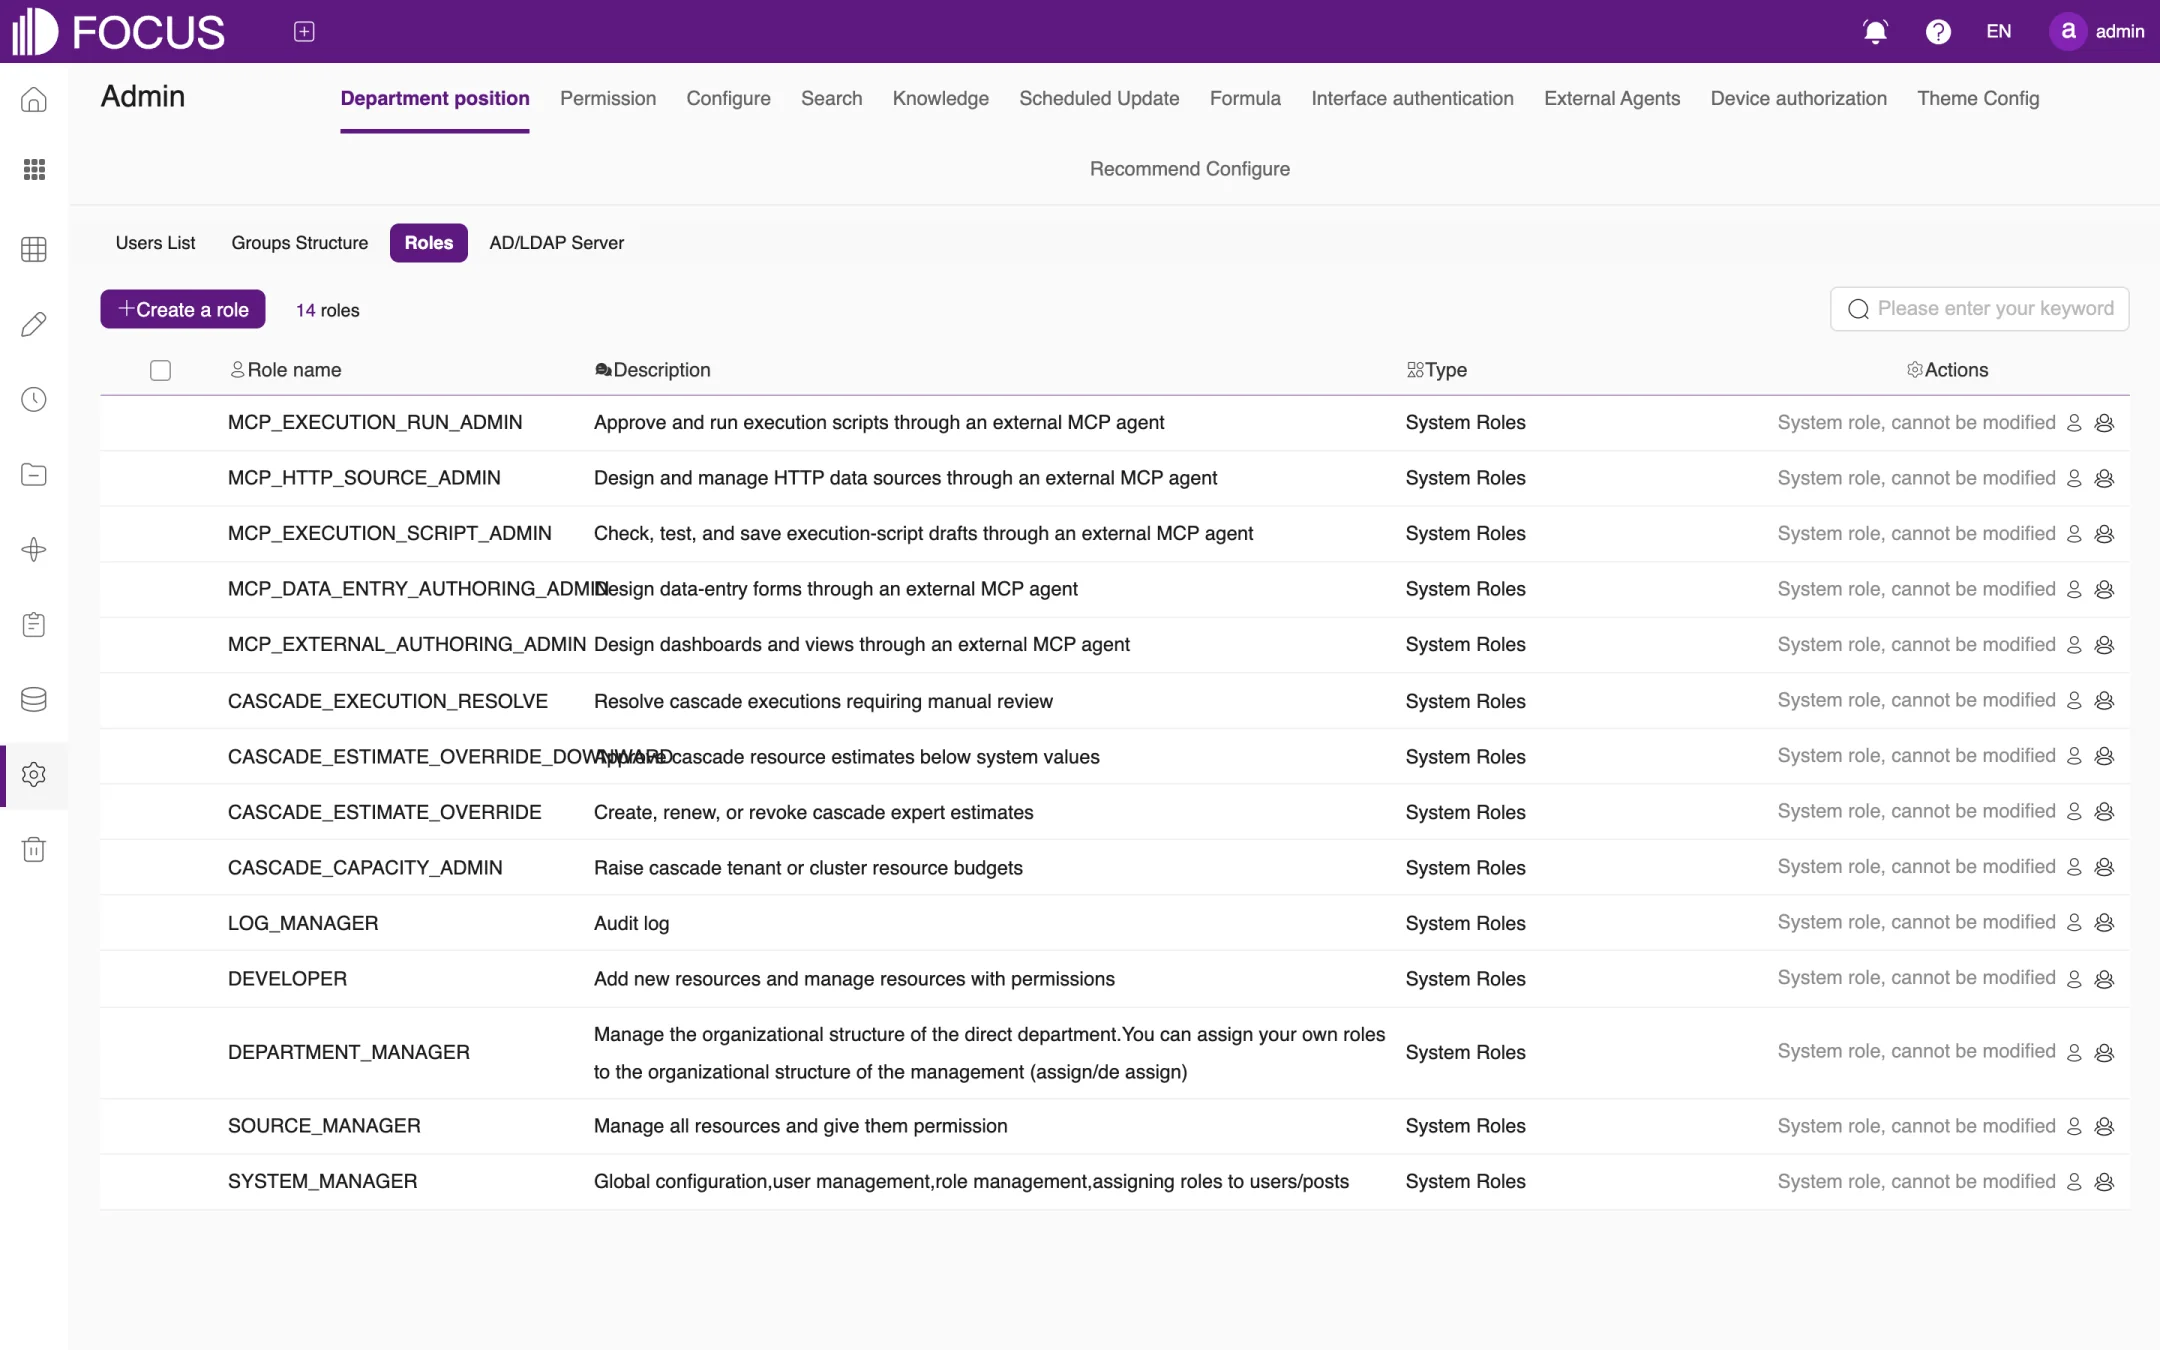
13.1.2Roles
The Roles sub-tab lists the roles in the system and their descriptions, as shown in Figure 13-3. Preset system roles cannot be modified (their Actions column reads "System role, cannot be modified"). The most commonly used are:
Role
Description
SYSTEM_MANAGER
Global configuration, user management and role management; assigns roles to users or positions
SOURCE_MANAGER
Manages all resources and grants permissions on them
DEPARTMENT_MANAGER
Manages the organizational structure of their own department and can assign the roles they hold to the organizations they manage
DEVELOPER
Adds new resources and manages the resources they have permissions on
LOG_MANAGER
Audits the logs
There are also MCP roles for external Agents (such as MCP_EXECUTION_RUN_ADMIN and MCP_DATA_ENTRY_AUTHORING_ADMIN) and roles for cascade scheduling (CASCADE_…). Click Create a role to create a custom role.
Figure 13-3. Roles
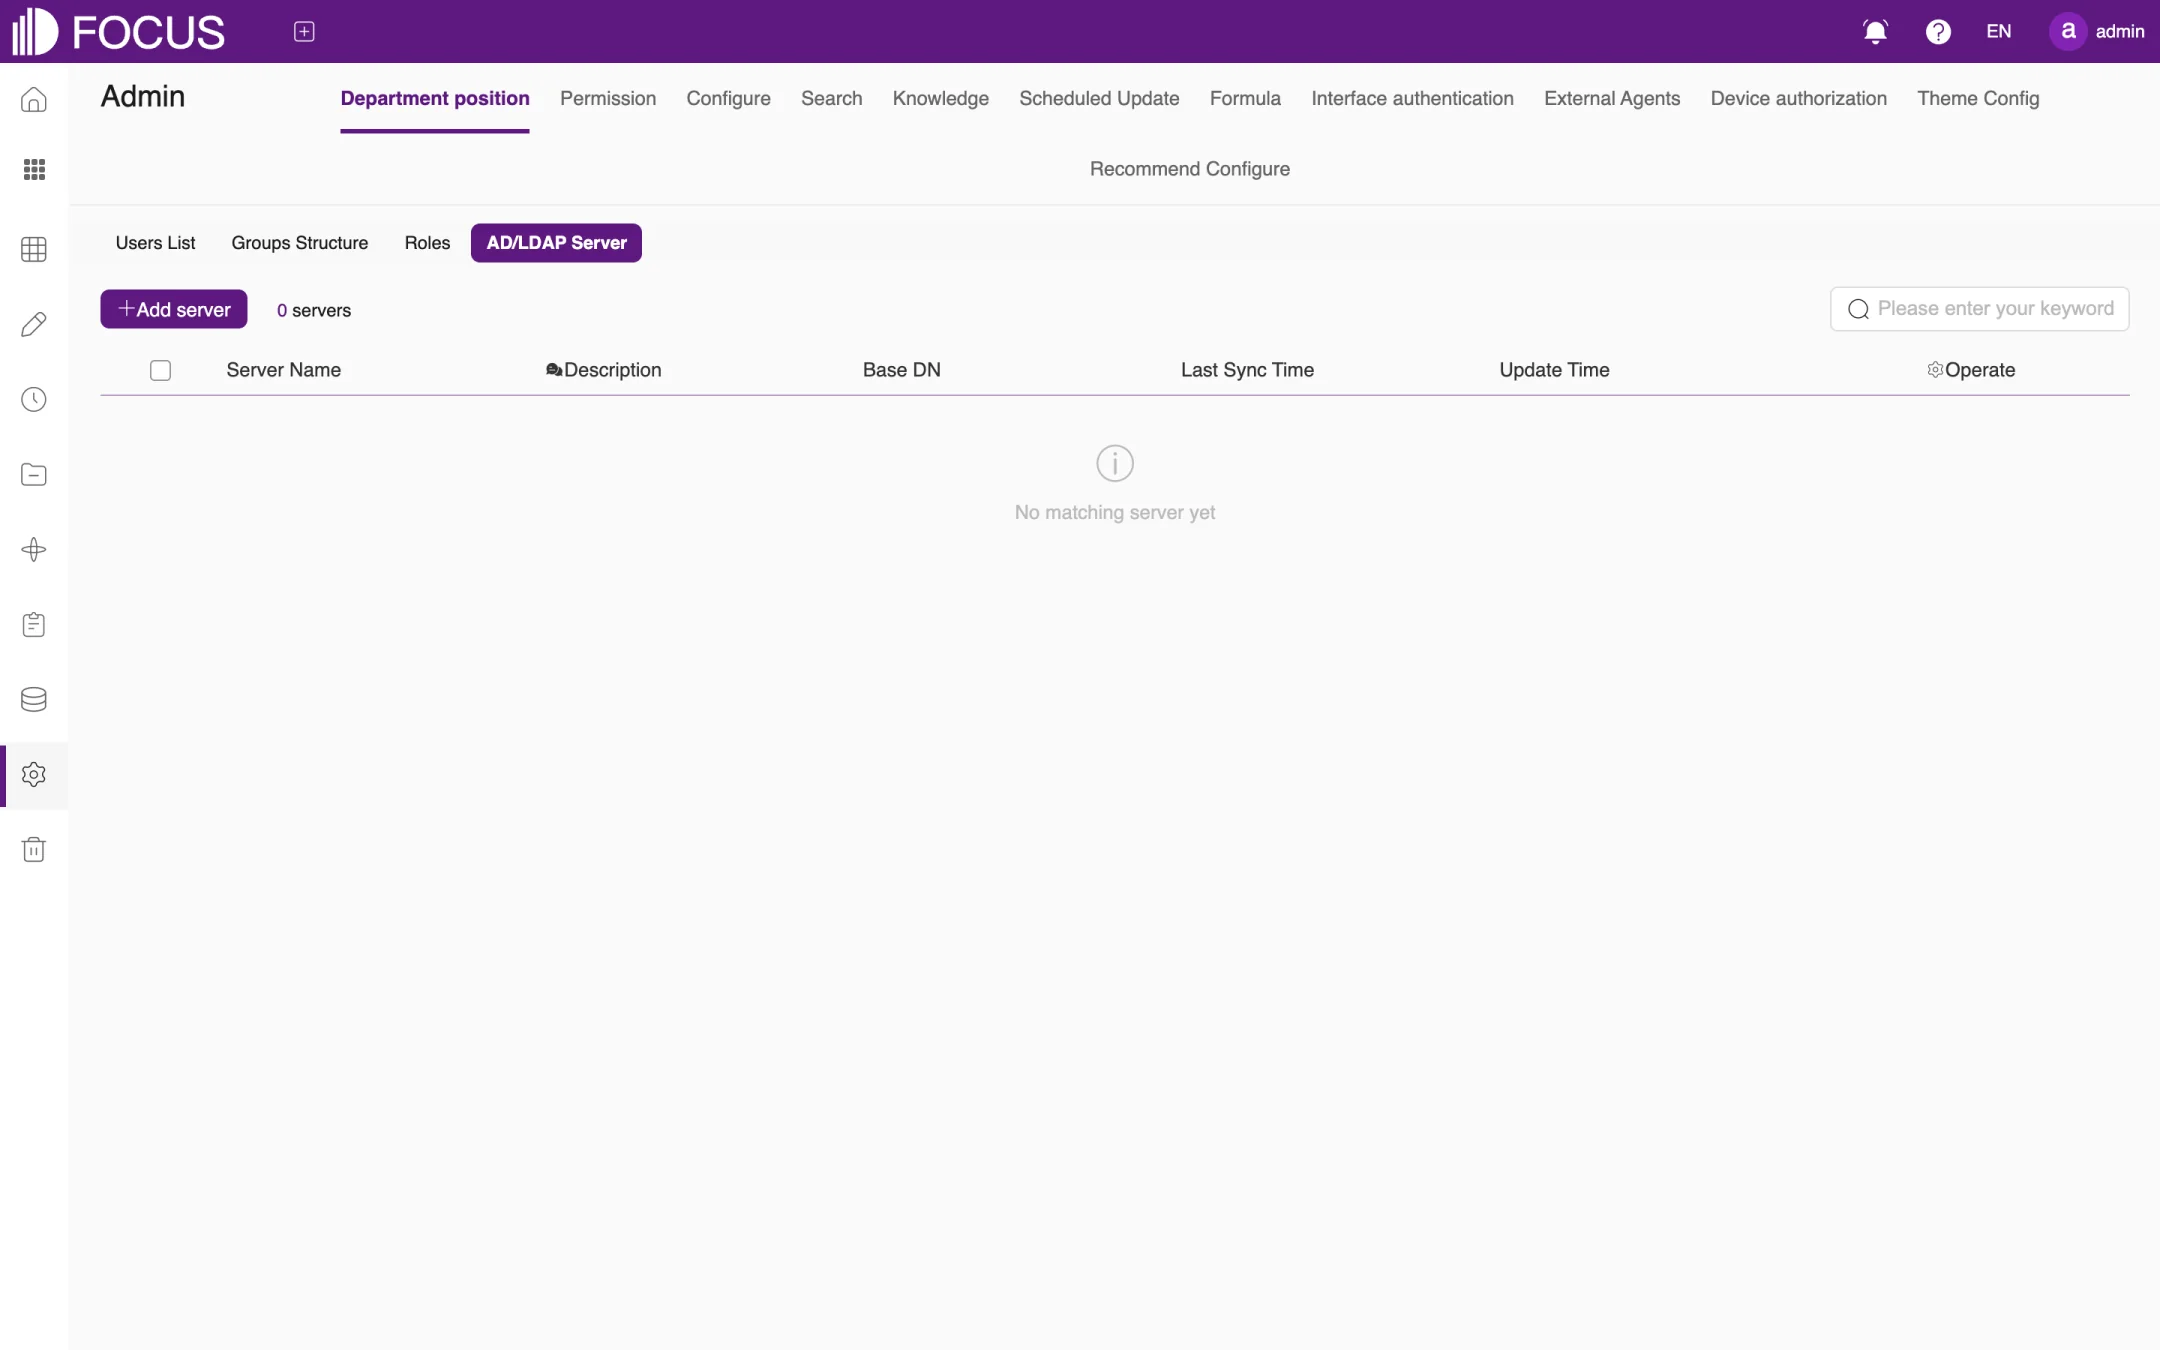
13.1.3AD/LDAP Server
If your company manages accounts centrally with AD or LDAP, click Add server on the AD/LDAP Server sub-tab and enter the Server Name, Base DN and other details to synchronize company accounts into the system, as shown in Figure 13-4.
Figure 13-4. AD/LDAP Server
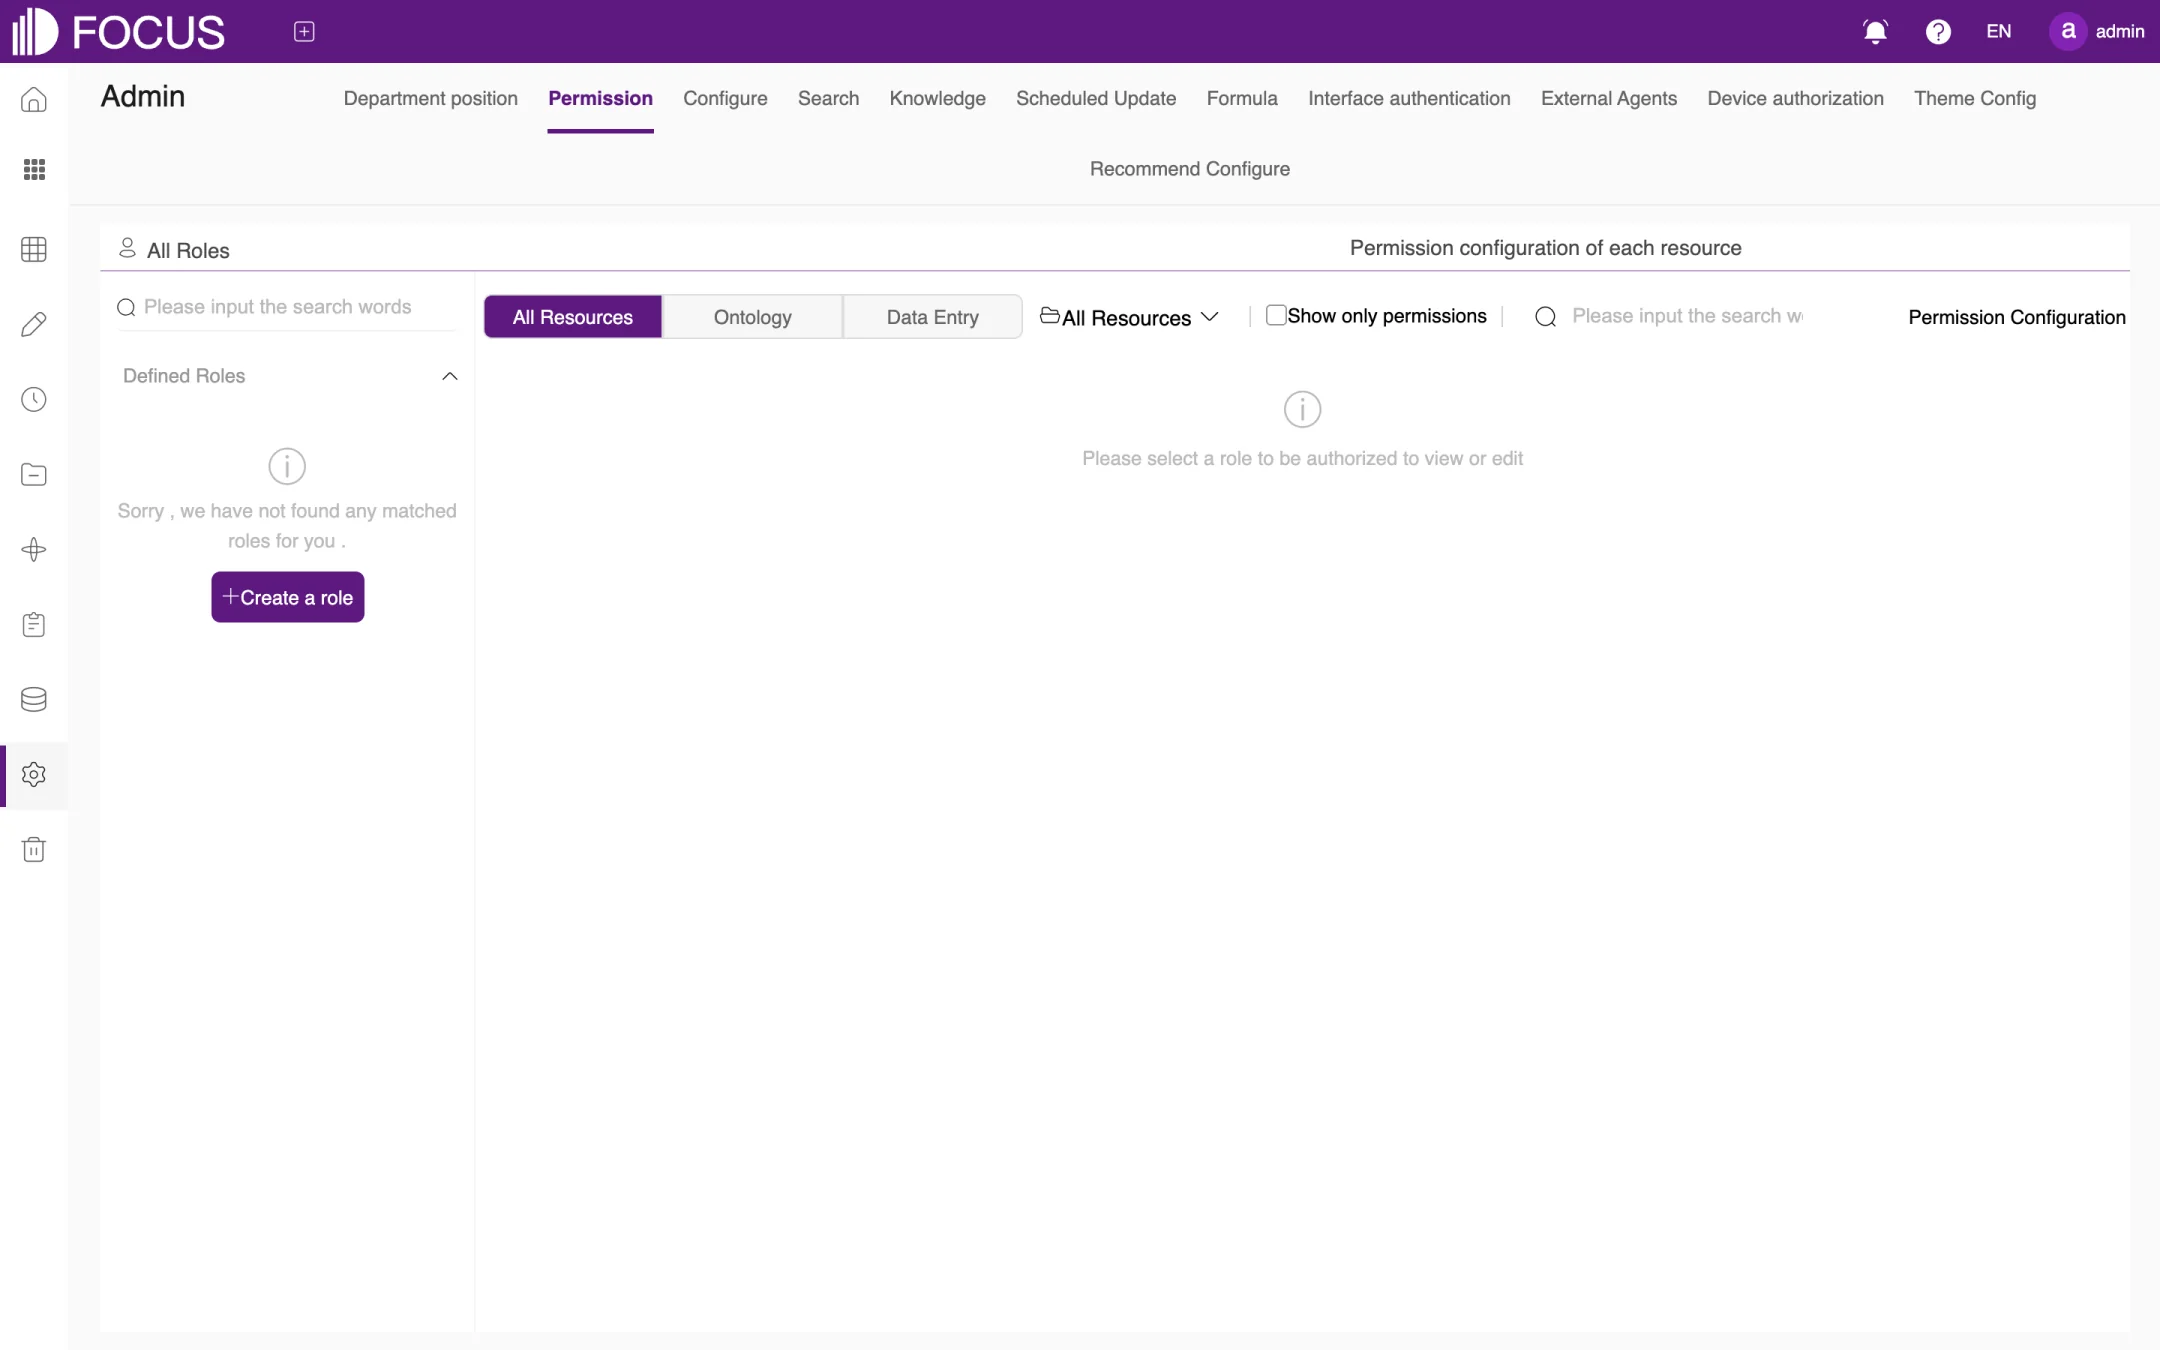
13.2Permission
Permission is where you grant custom roles permissions on resources, as shown in Figure 13-5:
Under All Roles on the left, select a custom role. If there is none yet, click Create a role to create one.
On the right, Permission configuration of each resource lists the resources by category: All Resources, Ontology and Data Entry. Select Show only permissions to see only the resources the role already has permissions on.
Select the role's permissions on each resource and save. Users with this role then receive the corresponding permissions.
Figure 13-5. Permission
13.3Configure
Configure holds the system-wide settings, as shown in Figure 13-6. Its sub-tabs are Base Configure, Wechat Configure, DingDing Configure, Feishu Configure, Yufuid Configure, Map Configure, Plugin charts, Prompt Management, TaoWen Async Configure, Custom Ai, Functional cropping, Email Template, Specifications, SSO, System Sticker, Pinboard Sort and Other Configure.
The most important setting in Base Configure is the mail system: turn on Enable mail system configuration, fill in Mail host, Mail port, Send mail (the sender address), Mail Username and Mail password, set Enable SSL as your mail server requires, and click Save.
Figure 13-6. Configure – Base Configure
Note: We strongly recommend configuring the mail system. Without it, features that send email, such as password recovery and scheduled sending, do not work.
13.4Search
The Search tab adapts data search to your company's business conventions, as shown in Figure 13-7:
Custom Location: define regions (for example, which states and cities make up the East region) that can be used to narrow the scope of a search; you can also use Import system location by country;
Custom Date: define your company's own date conventions, such as the fiscal year;
Synonyms for column values and Custom keywords: set synonyms and keywords for the whole system (for a single table, see "Search extension" in Chapter 6);
Other Configure: other search-related parameters.
Figure 13-7. Search
13.5Knowledge
Knowledge manages the knowledge that FocusGPT uses, as shown in Figure 13-8:
's marking (FocusGPT's markings; the English UI leaves the assistant name out of this tab label): the mappings between natural-language questions and keyword statements that users have corrected or confirmed while searching. You can view and maintain them by knowledge category;
Personal Knowledge and System Knowledge Base: manage personal knowledge and knowledge shared across the whole system;
Bulk Knowledge Import and All bulk imports: import knowledge in bulk and review the import tasks;
Knowledge categories: maintain the categories of knowledge.
Figure 13-8. Knowledge
13.6Other system settings
Tab
Purpose
Scheduled Update
Add and manage system-level scheduled update tasks
Formula
Add custom formulas for use in searches and indicators across the system
Interface authentication
Manage third-party authentication, bearer tokens and ontology scenario approvals
External Agents
Configure which kinds of write operations external Agents (connected through MCP) may initiate, plus Agent change approvals and MCP data administrator access
Device authorization
View the device license information and the daily and monthly AI model token consumption
Theme Config
Choose the style (Default or Enterprise), the theme color (Classic blue, Leaf green, Sapphire Blue, Vital Red or a custom color) and the banner background
Recommend Configure
Set the home page recommendations and the FocusGPT home page recommendations; you can add several groups of recommendations per table
The External Agents tab needs a word of explanation: the scope that an external Agent can actually write to is the intersection of three things, as shown in Figure 13-9: External Agent operation (this page), the Exact OAuth grant range, and System resource EDIT access. This tab does not create a second set of resource permissions; access to tables, ontologies, projects and other resources is still controlled centrally under Permission.
Figure 13-9. External Agents
Chapter 14Recycle
Deleted pinboards, data apps and cards first go to the Recycle, where you can restore them or delete them permanently. Answers do not go to the Recycle when they are deleted.
Click Recycle in the left menu to open this page, as shown in Figure 14-1:
① Type tabs: All, Pinboard, Data App and Card;
② Revert All: restores all resources in the Recycle to their original locations;
③ Clear: permanently deletes all resources in the Recycle.
Figure 14-1. Recycle
In the upper-right corner you can search by name or switch between card view and list view.
Note: Once you delete a resource permanently or clear the Recycle, the resources cannot be restored. Proceed with care.
Chapter 15System Operations
The DataFocus System Manager is for system operations administrators. Here you monitor the servers, containers and services, configure alarms, and manage interface authentication and server upgrades.
The DataFocus System Manager is separate from Admin in Chapter 13. Admin manages users, roles and business settings inside the product; the System Manager is for deployment and operations and has its own operations administrator account, admin.
15.1Logging in to the System Manager
In your browser, open the product's address with the path /manager.html, that is https://<server address>:<port>/manager.html. The login page opens, as shown in Figure 15-1.
The page already shows the operations administrator account, admin. Enter the password in the Password field (①).
Click Login (②).
Use Interface language at the top right (③) to choose 简体中文 (Simplified Chinese) or English. You can also switch it at the top right after logging in. The language you choose is kept when you refresh the page.
Figure 15-1. Login page of the System Manager
First login: the first time you log in, the system asks you to change the initial password. Enter a new password, enter it again to confirm it, and confirm. The new password must differ from the initial one. Ask the person who deployed the system for the initial password.
After you log in, the top of the page has five menus, marked ① in Figure 15-3: System metrics, Setting, Alarm Log, Interface authentication and Upgrade Management. At the top right, marked ②, are Interface language, Change Password and Logout.
To change the password: click Change Password at the top right, enter the Origin Password, the New Password and Confirm Password, and click Confirm, as shown in Figure 15-2.
Figure 15-2. Change password
Caution: admin is the operations account for the whole system. Choose a strong password and keep it safe.
15.2System metrics
System metrics is the back-end monitoring dashboard, DataFocus System monitoring. It opens by default after you log in, as shown in Figure 15-3:
③ Period and refresh: Period can be Last hour, Last 12 hours, Last day, Last 7 days, Last 30 days or Last 90 days. The refresh setting can be No refresh or every 3 minutes, 5 minutes or 10 minutes.
④ Status tabs: Node status, Container status, Infrastructure services, Business services and Business data.
⑤ Host name: on the Node status tab, choose the server to view.
Figure 15-3. System metrics: Node status
The tabs show the following:
Tab
Content
Node status
Total disk space, Available disk space and Disk usage; Average CPU usage by node (user usage, system usage, idle ratio and I/O wait ratio); Memory usage by node; Disk usage by node for each disk mount point
Container status
Number of running instances and number of restarts for each service container, as shown in Figure 15-4
Infrastructure services
Doris query status (running and waiting queries), Doris server status (active FE and BE), Doris storage status and internal table count; PostgreSQL connections; RabbitMQ connections, memory usage and queues; Redis connections, keys and memory usage, as shown in Figure 15-5
Business services
BI Server memory usage (MB); Search Server persistent connections and heap usage; System Manager resident process memory (RSS, MB); Task Manager memory usage (MB); task scheduling (tasks triggered and skipped); Web Server heap usage, as shown in Figure 15-6
Business data
Numbers of answers, online users, pinboards, data tables, scheduled tasks, tenants and users, as shown in Figure 15-7
Figure 15-4. Container status
Container status lists all service containers of the system, such as df-webserver, df-search, df-biserver, df-doris-fe, df-doris-be, df-pgsql, df-redis and df-nginx. In normal operation each container has one running instance. Watch for containers whose restart count keeps rising.
Figure 15-5. Infrastructure servicesFigure 15-6. Business servicesFigure 15-7. Business data
The Warning panel at the bottom right of the page shows the number of alarms and the latest ones (measure, record detail and alarm time).
15.3Setting
Click Setting in the top menu to open this page, as shown in Figure 15-8. It has four parts: ① Global Domain, ② Mail Server, ③ Warning (alarm notifications) and ④ Alarm thresholds. To change a setting, click Edit below it (for example ⑤), fill in the window that opens, and click Save. Click Cancel to leave it unchanged.
Figure 15-8. Setting
15.3.1Global Domain
Click Edit under Global Domain, enter the domain name, and click Save.
15.3.2Mail Server
Alarm emails are sent through the mail server configured here. Click Edit under Mail Server and fill in the Setting Mail Server window, as shown in Figure 15-9:
Server and Port: the address and port of the mail server;
Sender email: the address that alarm emails are sent from;
Username and Password: the account used to sign in to the mail server;
Enable SSL: turn this on if the mail server requires an encrypted connection.
Figure 15-9. Setting Mail Server
15.3.3Warning (alarm notifications)
The Warning section sets the language of alarm notifications, how they are delivered and who receives them. Click Edit under Warning and make the settings in the Setting Warning window, as shown in Figure 15-10:
Choose the Notification language: chinese or english.
Select the delivery methods: In-app alerts and Email alerts. You can select both.
If you use email alerts, enter a recipient address under Recipients. Click + at the right of the field to add more recipients.
Set Email cooldown in minutes (default 60), so that the same alarm is not emailed again and again within a short time.
Click Save.
Figure 15-10. Setting Warning
Note: Configure the mail server before you turn on email alerts.
15.3.4Alarm thresholds
Alarm thresholds lists every measure that can raise an alarm, grouped by statistical type: nodes (CPU, memory, disks), pods (running pods and restarts), Doris, PostgreSQL, RabbitMQ, Redis, the memory of each service, task scheduling, and business data such as answers, users and tables. The Alarm conditions column shows the conditions that have been set; an empty cell means no alarm has been set for that measure.
To set an alarm condition for a measure:
Click Edit in the measure's row to open the Setting Alarm threshold window, as shown in Figure 15-11. The top of the window shows the statistical type and the measure.
Choose an Operator (>, >=, <, <= or =) and enter the threshold under Value. The unit, for example GB, is shown at the right of the field.
Select Enable or not to turn the condition on.
Click Save.
Figure 15-11. Setting Alarm threshold
When a measure meets an alarm condition, the system notifies according to the Warning settings and adds an entry to the Alarm Log.
15.4Alarm Log
Click Alarm Log in the top menu to see the alarms the system has raised, as shown in Figure 15-12. The top left shows the number of alarms. Use the filters marked ① to filter by Statistical type, Measure and Alarm time range. Each row shows the statistical type, measure, record detail and alarm time. When there are no alarms, the list says so.
Figure 15-12. Alarm Log
15.5Interface authentication
Interface authentication manages the authentication information (keys) used to call the system's interfaces, as shown in Figure 15-13. The list shows the Name, Description, Status and Update Time of each entry; use the search box at the top right to search by keyword. The system comes with one entry, ADM_CENTER_SECRET (description: Secret info of admin center.).
① New interface authentication: enter the Interface authentication name and a Description, and click Submit, as shown in Figure 15-14.
② View Key (eye icon): show the entry's key.
③ Edit (edit icon): edit the entry.
The two icons in the Operator column appear when you move the pointer over a row.
Figure 15-13. Interface authenticationFigure 15-14. New interface authentication
Caution: A key is an access credential for the interfaces. Give it only to the systems or people that need to call them, and never post it in chats or write it into documents.
15.6Upgrade Management
Click Upgrade Management in the top menu to open the Server Upgrade Management page, as shown in Figure 15-15. The top of the page shows the Product name, Current version and Latest version. If no online update source is configured, the page says "No online update source is configured. Use a verified release package to upgrade." and the latest version shows Unavailable; in that case, upgrade with a verified release package.
The lower part of the page sets how the server is upgraded:
Select Automatic upgrade, then choose how often (Per day, week or month) and the Time (hour and minute). Or select Do not upgrade (not recommended).
Click Save.
Figure 15-15. Server Upgrade Management
Note: Automatic upgrade updates the system on the server at the time you set. Choose a time outside business hours, for example early in the morning.